

The Luxury Goods KPI Scorecard in Google Sheets tracks 15+ KPIs across 4 interactive worksheets, with built-in MTD and YTD analysis, trend charts, and conditional formatting. Setup takes under 10 minutes — just make a copy to your Google Drive, replace the sample data, and every metric updates automatically.
🌍 Join 8,400+ teams in 40+ countries using NextGenTemplates to replace paid SaaS tools with one-time-purchase Excel, Google Sheets, Power BI, and HTML templates.
✅ Instant download · One-time payment · No subscription · No per-user fees · Lifetime access
🔑 Key Features of Luxury Goods KPI Scorecard in Google Sheets
📊 4 Dedicated Worksheets – Scorecard, KPI Trend, Input Data, and KPI Definition sheets work together to deliver a 360° view of your luxury brand performance.
📅 MTD & YTD Tracking – Dropdown menus let you switch between Month-to-Date and Year-to-Date analysis instantly. This Luxury Goods KPI Scorecard in Google Sheets covers revenue, profitability, customer retention, and marketing ROI across your luxury business operations.
🎯 Actual vs Target Comparison – Compare actual performance against set targets and previous year benchmarks for each KPI with auto-calculated variances.
📈 Visual Indicators – Color-coded conditional formatting with arrows instantly highlights whether a KPI is on track, needs attention, or underperforming.
💡 KPI Trend Charts – Select any KPI from the dropdown to view MTD and YTD trend charts showing Actual, Target, and Previous Year lines.
🧩 Fully Customizable – Add, modify, or remove KPIs to match your fashion house, jewelry brand, or watch retailer needs.
💻 Cloud-Based & Shareable – Works on any device with a browser. Share via Google Drive link with your team — no software installation needed.
Explore more Google Sheets Dashboard Templates from NextGenTemplates for every industry and department.
📦 What’s Inside the Luxury Goods KPI Scorecard in Google Sheets
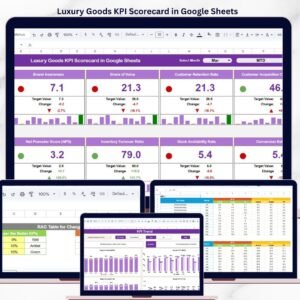
1️⃣ Scorecard Sheet
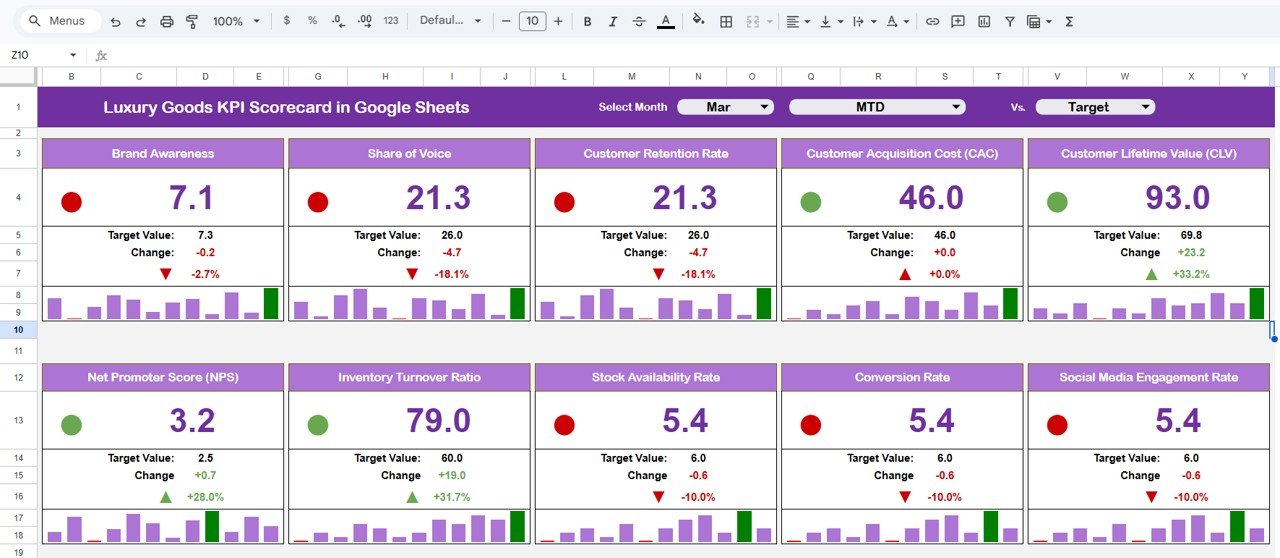
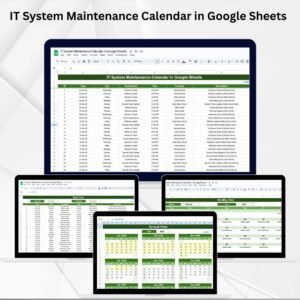
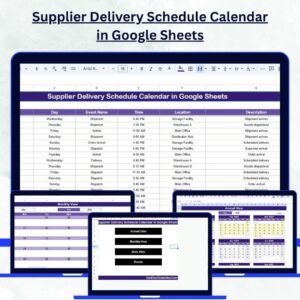
Luxury Goods KPI Scorecard in Google Sheets
The Scorecard sheet is the main interface where you can view KPI performance. Key features include dropdown menus to select the month, MTD, or YTD for performance analysis. Compare actual performance against targets for each KPI with visual indicators using color-coded conditional formatting. It provides a complete KPI overview including MTD and YTD comparisons.
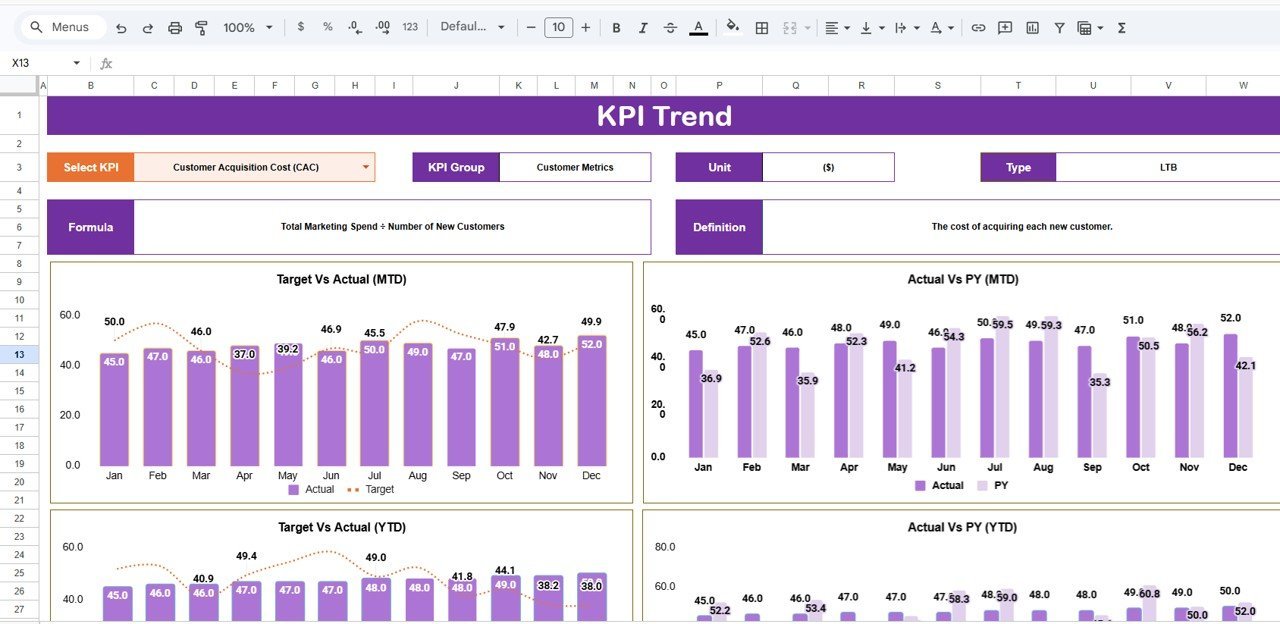
2️⃣ KPI Trend Sheet
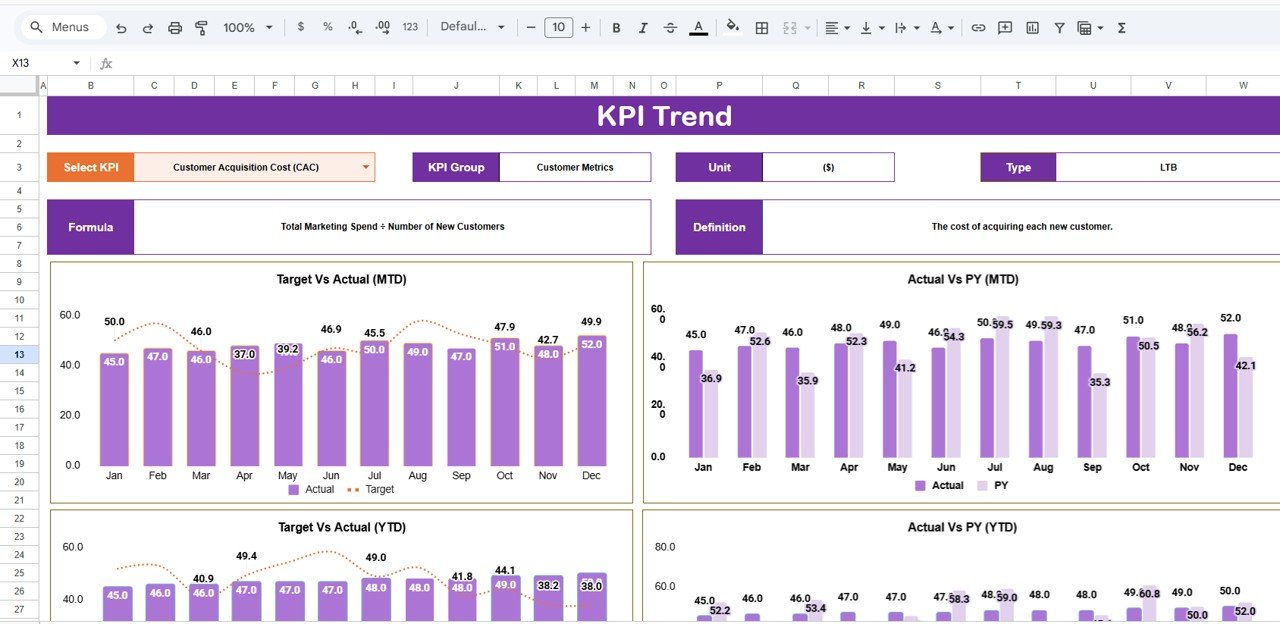
KPI Trend Sheet
Select any KPI name from the dropdown available on range C3. The sheet displays the KPI Group, Unit of KPI, Type of KPI (Lower the Better or Upper the Better), Formula, and Definition. MTD and YTD trend charts show Actual, Target, and PY numbers side by side for deeper analysis.
3️⃣ Input Data Sheet
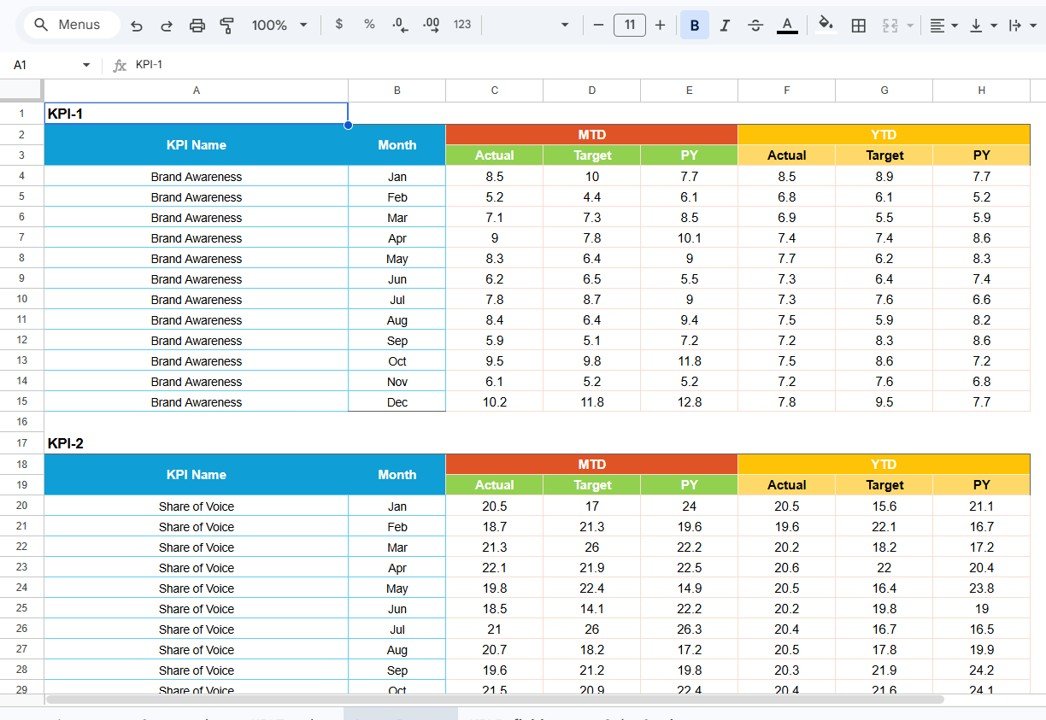
Input Data Sheet
The Input Data sheet is where you enter all KPI data. Record actual values, targets, and other metrics for each KPI. Easily update data as new results become available, ensuring the scorecard remains current and accurate.
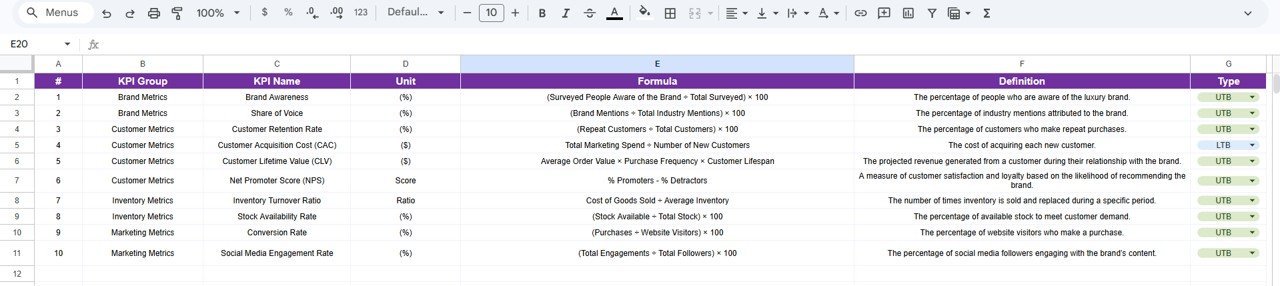
4️⃣ KPI Definition Sheet
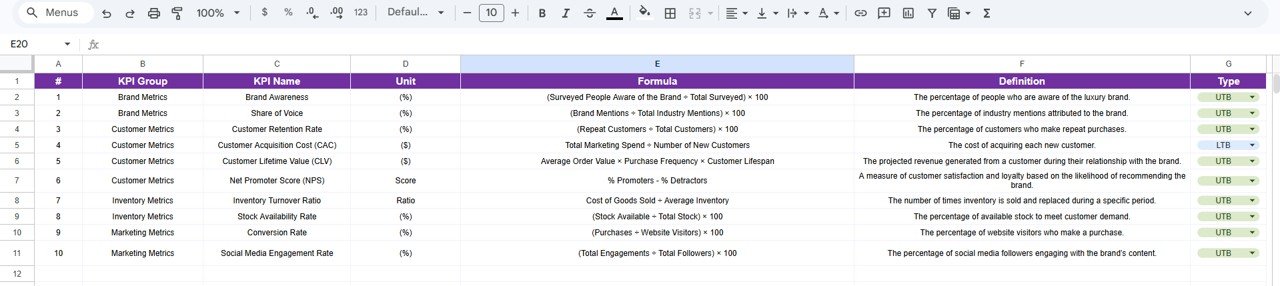
KPI Definition Sheet
In this sheet, enter the KPI Name, KPI Group, Unit, Formula, and KPI definition. This ensures every team member understands each KPI clearly for consistency across global luxury operations.
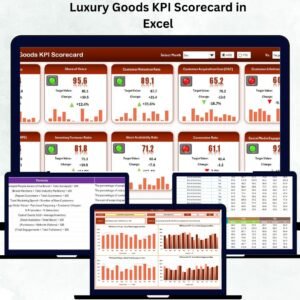
Also available: Luxury Goods KPI Scorecard in Excel if you prefer a desktop-based solution.
📊 Luxury Goods KPI Scorecard in Google Sheets vs. Microsoft Excel Dashboard vs. Paid SaaS — Where This Fits
| Feature | Luxury Goods KPI Scorecard in Google Sheets | Microsoft Excel Dashboard | NetSuite / Salesforce |
|---|---|---|---|
| Cost | $8.99 one-time | $14.99+ one-time | $25–150/user/month |
| Platform | Google Sheets (browser-based) | Desktop Excel required | Cloud SaaS |
| Setup Time | Under 10 minutes | Under 10 minutes | Days to weeks |
| Real-time Collaboration | ✅ Built-in via Google Drive | Limited (OneDrive) | ✅ Yes |
| Mobile Access | ✅ Any browser | ❌ Desktop only | ✅ Mobile app |
| Customizable KPIs | ✅ Fully editable | ✅ Fully editable | Limited by plan |
| Share with Link | ✅ One-click share | ❌ Email attachment | ✅ Role-based |
| Year-1 Cost (5 users) | $8.99 total | $14.99 total | $1,500–$9,000+ |
For luxury brands that want structured KPI tracking without paying monthly SaaS fees, the Luxury Goods KPI Scorecard in Google Sheets sits in the sweet spot.
👥 Who This Template Is For — and Who It’s Not For
✅ This template is built for:
- Luxury brand managers at fashion houses, jewelry firms, and watch retailers tracking 10–20 KPIs monthly
- Retail executives at boutiques and high-end stores who need quick, visual performance summaries
- Marketing and operations teams monitoring campaign ROI, customer retention, and inventory turnover
❌ This template is NOT for:
- Enterprise luxury conglomerates (LVMH, Kering) needing multi-entity ERP integration with SOC 2 compliance
- Teams requiring real-time POS or CRM data sync — this template uses manual data entry
⚙️ How to Use the Luxury Goods KPI Scorecard in Google Sheets
1️⃣ Open the PDF guide from your download and click the Google Sheets copy link to create your own editable copy in Google Drive.
2️⃣ Go to the KPI Definition sheet and enter your KPI names, groups, units, formulas, and definitions.
3️⃣ Navigate to the Input Data sheet and fill in your Actual, Target, and Previous Year values for each KPI by month.
4️⃣ Switch to the Scorecard sheet, select the month and analysis type (MTD or YTD) from the dropdowns, and review all visual indicators.
5️⃣ Use the KPI Trend sheet to select individual KPIs and study their performance patterns over time.
💼 Real-World Use Cases
Isabella manages a luxury handbag brand with 8 retail locations. She uses the Luxury Goods KPI Scorecard in Google Sheets to track monthly gross profit margin, average transaction value, and customer retention rate across all stores. The MTD/YTD toggle lets her compare seasonal performance without switching between multiple reports — saving her 4 hours each month that she previously spent building manual presentations.
Raj runs marketing for a Swiss watch retailer. He tracks campaign ROI, brand engagement rate, and customer acquisition cost in the Scorecard sheet. The KPI Trend charts help him identify which quarterly campaigns drove the highest repeat purchase rates, guiding budget allocation for the next season.
Sophie oversees operations at a luxury jewelry brand. She monitors inventory turnover, stock-out rate, and order fulfillment time. The color-coded indicators immediately flag when any metric falls below target, allowing her team to take corrective action before quarterly reviews.
Browse more KPI Dashboard Templates for other industries. Also see: Distribution KPI Scorecard in Google Sheets and Transportation Safety KPI Scorecard in Google Sheets.
❓ Frequently Asked Questions
What KPIs does the Luxury Goods KPI Scorecard in Google Sheets track?
The Luxury Goods KPI Scorecard in Google Sheets tracks 15+ KPIs including total sales revenue, gross profit margin, average transaction value, customer retention rate, inventory turnover, and campaign ROI. All metrics update automatically when you replace the sample data.
Can I customize the KPIs for my specific luxury brand?
Yes. The KPI Definition sheet lets you add, rename, or remove any KPI. You can define custom formulas, units, and groupings to match your fashion house, jewelry brand, or watch retailer operations.
How does this compare to Salesforce or NetSuite?
The Luxury Goods KPI Scorecard in Google Sheets costs $8.99 one-time versus $25–150/user/month for SaaS platforms. It tracks the same core KPIs with MTD/YTD analysis but uses manual data entry instead of automated CRM integration.
Does this work on mobile devices?
Yes. Google Sheets runs in any modern browser on desktop, tablet, or phone. Your team can view and update KPIs from anywhere without installing software.
How long does setup take?
Setup takes under 10 minutes. Make a copy to Google Drive, enter your KPI definitions, fill in 1–2 months of data, and the Scorecard sheet populates with all charts and visual indicators automatically.
Can multiple team members access the scorecard simultaneously?
Yes. Google Sheets supports real-time collaboration. Share the file via Google Drive link and multiple team members can view or edit simultaneously with role-based permissions.
Is the Excel version of this scorecard also available?
Yes. The Luxury Goods KPI Scorecard in Excel is available separately for teams that prefer desktop-based tracking with offline access.
👤 About the Author
Built by PK — Microsoft Certified Professional with 15+ years of Excel, Google Sheets, and Power BI experience. Founder of NextGenTemplates, reaching 300K+ subscribers across YouTube channels (@PK-AnExcelExpert, @NextGenTemplates, @NeoTechNavigators). Every template is hand-built and tested before release.
🔗 Explore Related Templates
👉 Luxury Goods KPI Scorecard in Excel — Same KPI structure in Microsoft Excel for offline tracking.
👉 Distribution KPI Scorecard in Google Sheets — Track supply chain and distribution performance.
👉 Transportation Safety KPI Scorecard in Google Sheets — Monitor safety and logistics KPIs.
📖 Click here to read the Detailed Blog Post
🎥 Visit our YouTube channel for step-by-step video tutorials
👉 YouTube.com/@NextGenTemplates


Reviews
There are no reviews yet.