

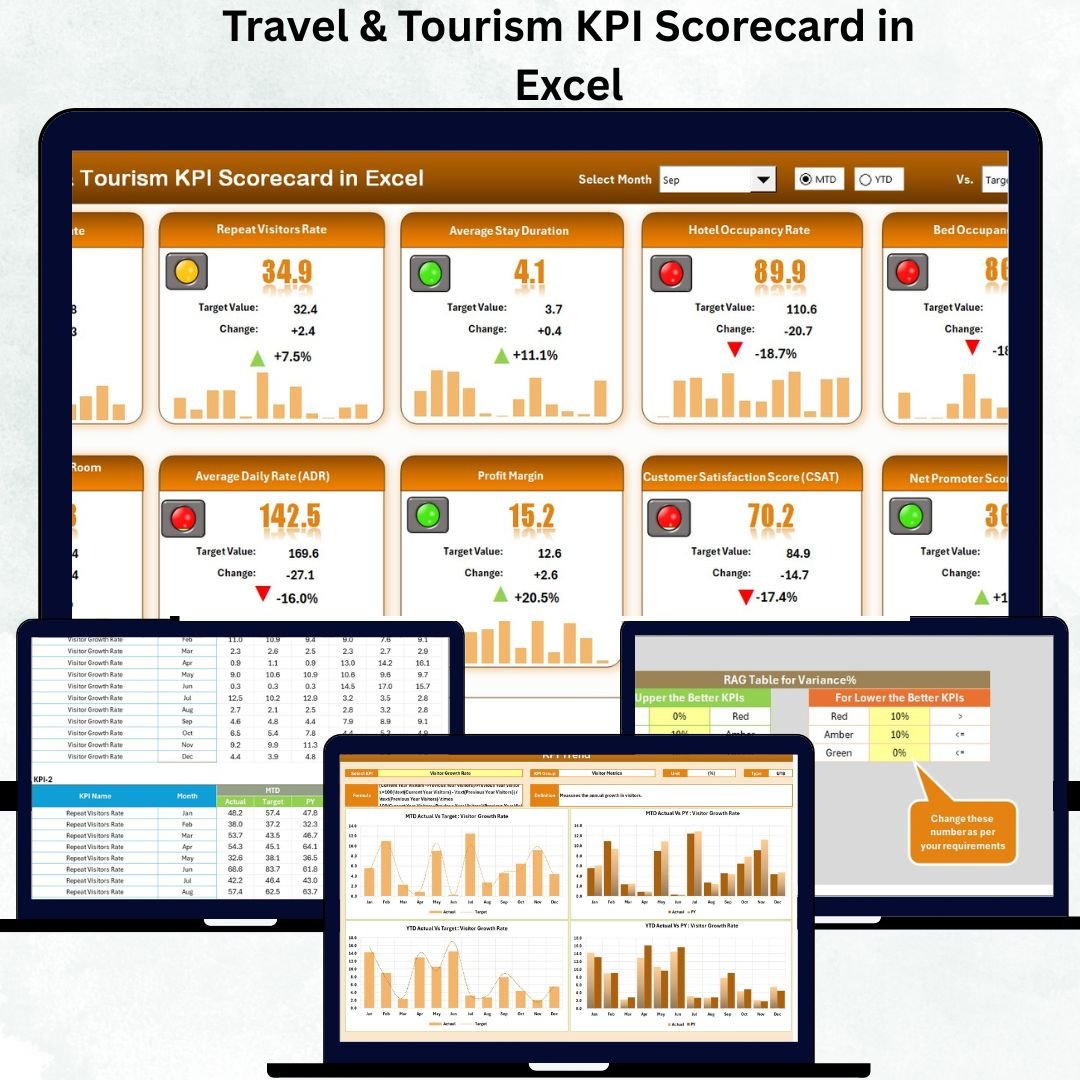

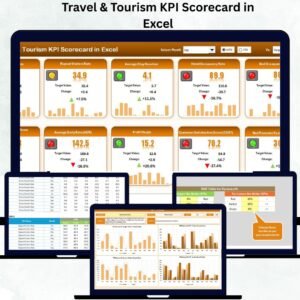
Managing performance in the travel and tourism industry has never been easier! Whether you’re running a hotel chain, travel agency, tour operator, or destination management company, data is the backbone of your success. The Travel & Tourism KPI Scorecard in Excel helps you track all critical business metrics in one interactive, ready-to-use Excel file — empowering you to make smarter, faster, and more profitable decisions.Travel & Tourism KPI Scorecard in Excel
📊 Download now to transform your raw tourism data into meaningful insights!
🌟 Key Features of the Travel & Tourism KPI Scorecard in Excel
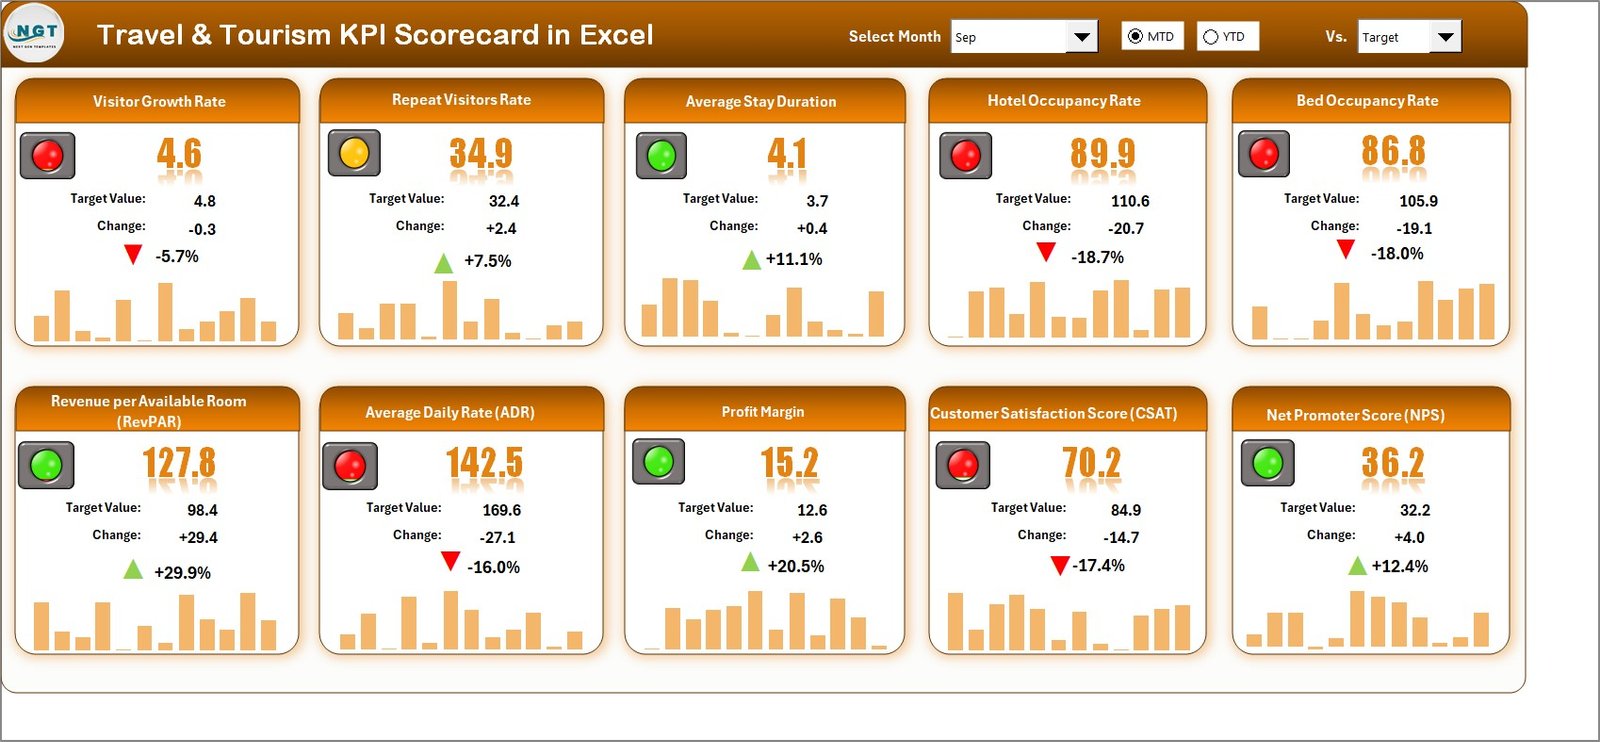
✅ Fully Interactive Dashboard: View KPIs in real-time using color-coded visuals and automatic updates.
✅ MTD & YTD Analysis: Easily compare Month-to-Date and Year-to-Date results.
✅ Actual vs Target Comparison: Quickly identify areas performing above or below goals.
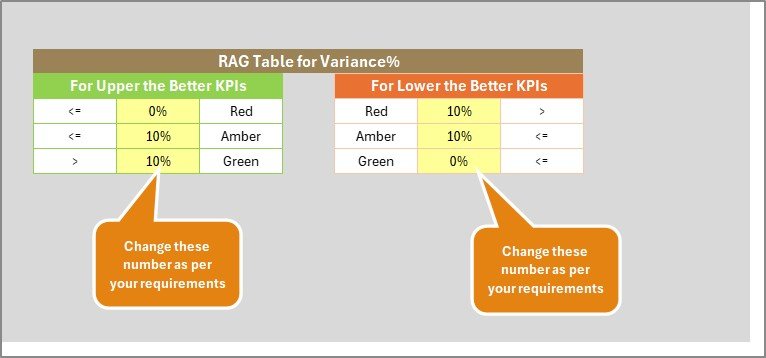
✅ Color Indicators: Red, yellow, and green icons highlight performance levels.
✅ No Coding Needed: 100% Excel-based — simple formulas and drop-down menus.
✅ Multi-Sheet Structure: Scorecard, KPI Trend, Input Data, and KPI Definition sheets for total clarity.
✅ Customizable KPIs: Add, remove, or modify indicators to fit your travel business needs.
✅ Instant Insights: Track occupancy rate, revenue per room, customer satisfaction, and more.Travel & Tourism KPI Scorecard in Excel
✅ Professional Layout: Clean and visually appealing interface for easy presentation to stakeholders.
✅ Compatible Across Versions: Works smoothly in Excel 2016, 2019, 2021, and Microsoft 365.
📘 What’s Inside the Travel & Tourism KPI Scorecard
💼 1. Scorecard Sheet (Main Dashboard):
Your one-stop command center for performance monitoring! It shows actual vs target comparisons, MTD/YTD insights, and 10 KPIs side by side.Travel & Tourism KPI Scorecard in Excel
📈 2. KPI Trend Sheet:
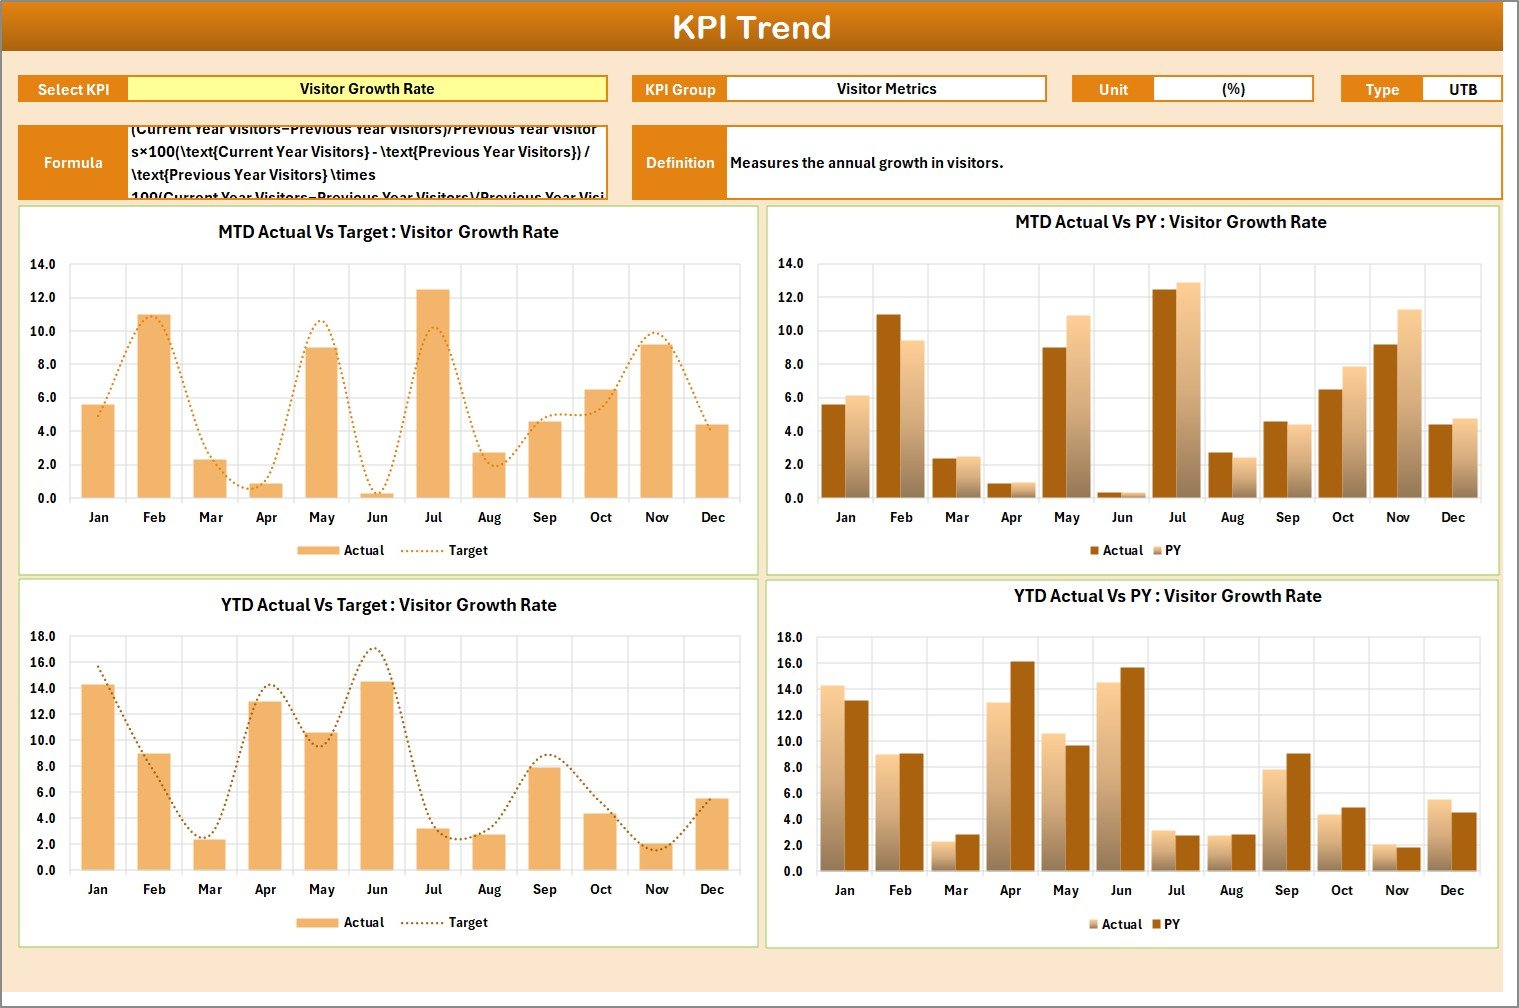
Analyze performance over time — with dropdown selection for each KPI (Cell C3) and trend charts for Actual, Target, and Previous Year.
🗂 3. Input Data Sheet:
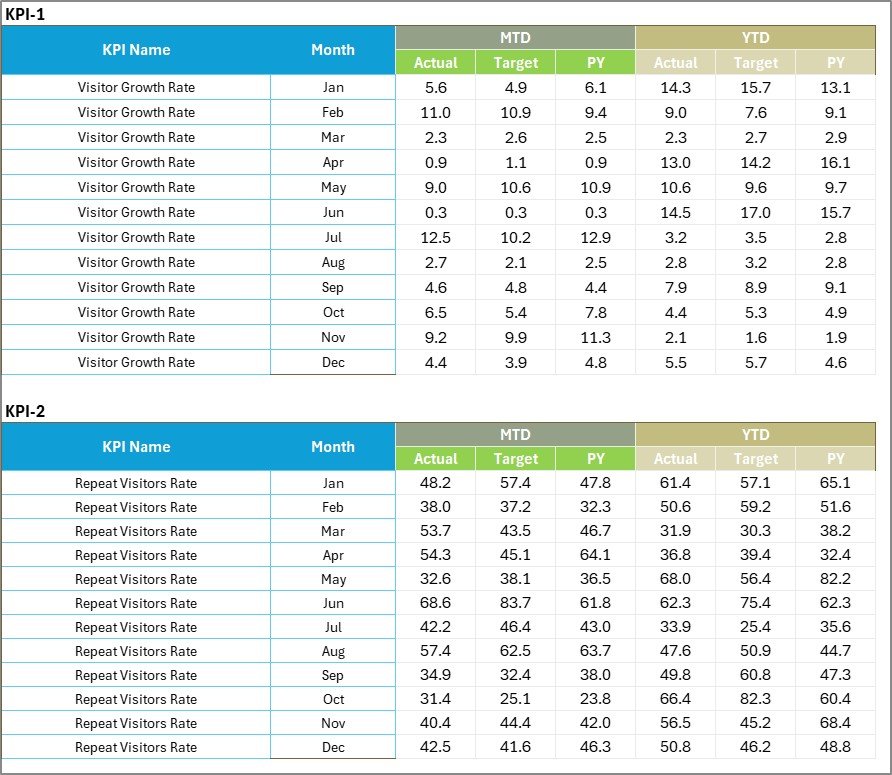
Where all your data lives. Enter monthly values, and the dashboard auto-updates instantly.
📋 4. KPI Definition Sheet:
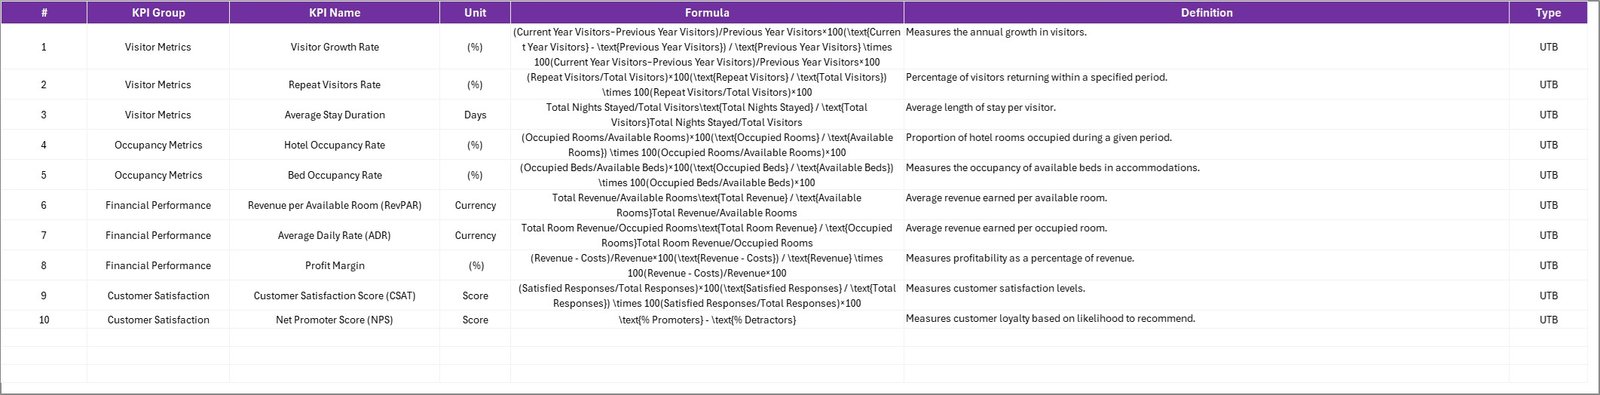
A detailed reference page explaining each KPI — Group, Unit, Formula, and Definition — ensuring everyone on your team stays aligned.
Each sheet is interconnected, allowing seamless data flow and eliminating manual calculations.
🧭 How to Use the Travel & Tourism KPI Scorecard
🧩 Step 1: Enter your actual, target, and previous year values in the Input Data Sheet.
🧩 Step 2: Check KPI meanings and formulas in the KPI Definition Sheet.
🧩 Step 3: Open the Scorecard Sheet to view instant visual comparisons for MTD/YTD.
🧩 Step 4: Explore the KPI Trend Sheet to identify seasonal patterns and progress over time.
🧩 Step 5: Take corrective actions where performance lags behind targets.
That’s it! Within minutes, you’ll have a complete picture of your business health.
🌍 Who Can Benefit from This KPI Scorecard
🏨 Hotels & Resorts: Track occupancy rates, ADR, and RevPAR easily.
✈️ Travel Agencies: Monitor bookings, cancellations, and customer satisfaction.
🚌 Tour Operators: Measure tour completion rates and profit per trip.
🛫 Airlines: Analyze seat occupancy, route profitability, and on-time performance.
🏝️ Destination Management Companies: Evaluate marketing ROI, visitor counts, and partner performance.
📊 Consultants & Analysts: Use this ready-to-use template to deliver client-ready insights.
With this Excel scorecard, every data point turns into an opportunity for improvement and growth.
Click here to read the Detailed blog post
Watch the step-by-step video tutorial:
Visit our YouTube channel to learn step-by-step video tutorials
Compatibility and Requirements
- Works in Microsoft Excel desktop (Excel 2016 or later, or Microsoft 365).
- The KPI Trend sheet uses a dropdown in cell C3 to pick a KPI. Microsoft explains how in Create a drop-down list.
Frequently Asked Questions
Which sheets are included?
Four sheets: Scorecard, KPI Trend, Input Data and KPI Definition.
How do I update the scorecard?
Enter your actual, target and previous year values in the Input Data sheet. The Scorecard sheet updates from that data.
How many KPIs does the scorecard show?
The Scorecard sheet shows 10 KPIs side by side, with actual vs target comparisons for MTD and YTD. You can add, remove or change KPIs to fit your business.
How do I see the trend for one KPI?
Open the KPI Trend sheet and choose the KPI from the dropdown in cell C3. The charts show Actual, Target and Previous Year over time.
Is there a Power BI or Google Sheets version?
Yes. See the Travel and Tourism KPI Scorecard in Google Sheets and the Travel & Tourism KPI Dashboard in Power BI.
Related Travel and KPI Templates
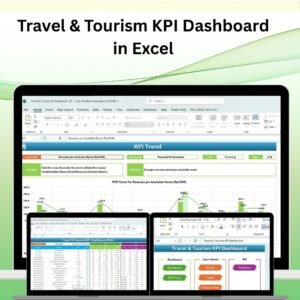
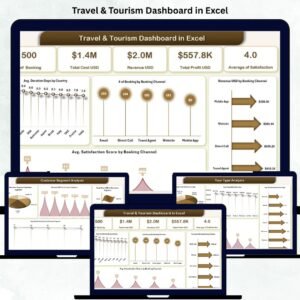
- Travel & Tourism KPI Dashboard in Excel: a dashboard view of the same industry
- Travel and Tourism KPI Scorecard in Google Sheets: the scorecard for Google Sheets
- Hospitality KPI Scorecard in Excel: a scorecard for hotels and similar businesses
- Luxury Travel KPI Scorecard in Excel: a scorecard for luxury travel
- KPI Dashboard Library (Excel): 15 KPI templates in one download
Browse all Excel KPI dashboards.











Reviews
There are no reviews yet.