



The space industry is advancing at lightning speed. From satellite launches to orbital infrastructure, every project involves massive investments, tight deadlines, and high risks. Without a structured performance tracking system, organizations risk delays, failures, and missed opportunities. That’s why we created the Space Tech KPI Dashboard in Power BI—a ready-to-use digital solution that transforms raw data into clear, interactive insights.
Built in Power BI and powered by a simple Excel backend, this dashboard helps aerospace companies, defense organizations, and research teams track launch efficiency, satellite performance, mission readiness, and operational KPIs in real time. With dynamic slicers, conditional icons, and drill-through analysis, it ensures decision-makers always have the right information at the right moment.
✨ Key Features of Space Tech KPI Dashboard in Power BI
📊 3 Smart Pages – Summary, KPI Trend, and KPI Definition for a complete 360° view.
🎯 Target vs Actual Tracking – Compare MTD (Month-to-Date) and YTD (Year-to-Date) with instant green/red visual indicators.
⚡ Excel-Powered Backend – Simple Input_Actual, Input_Target, and KPI Definition sheets for easy updates.
🔍 Drill-Through KPI Definitions – Standardized formulas, definitions, and KPI types (UTB/LTB).
📈 KPI Trend Charts – Analyze performance over time with Actual vs Target vs Previous Year comparisons.
🛠 Customizable Framework – Add sustainability KPIs (e.g., reusability, carbon emissions) or tailor metrics to your mission.
💡 Real-Time Refresh – Update Excel data and refresh Power BI for instant insights.
💰 Cost-Effective – Built with widely available tools (Power BI + Excel).
📂 What’s Inside the Space Tech KPI Dashboard

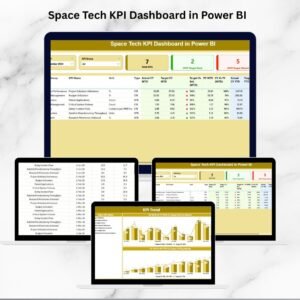
Summary Page – Overview with slicers (Month, KPI Group), KPI cards (Total KPIs, Targets Met, Targets Missed), and detailed tables with performance comparisons.
KPI Trend Page – Combo charts for MTD and YTD, showing Actual, Target, and Previous Year data with KPI selection filters.
KPI Definition Page – Hidden drill-through with formulas, definitions, and KPI types to ensure consistent measurement.
Excel Data Source –
Input_Actual: Record monthly actual performance.
Input_Target: Define monthly and yearly benchmarks.
KPI Definition: Store KPI numbers, groups, units, and formulas.
📖 How to Use the Space Tech KPI Dashboard
Prepare Excel Data – Enter actuals, targets, and definitions.
Connect Power BI – Load the Excel file to refresh visuals.
Monitor Performance – Use the Summary Page for high-level results.
Analyze Trends – Drill into the KPI Trend page for deeper insights.
Standardize KPIs – Ensure all teams understand metrics via the Definition page.
👥 Who Can Benefit from This Dashboard?
🛰 Aerospace Companies – Track launch efficiency, R&D progress, and mission outcomes.
🛡 Defense Organizations – Ensure readiness, safety, and compliance in space programs.
🌍 Research Institutions – Monitor satellite operations and data reliability.
💼 Private Space Startups – Balance innovation with accountability and growth.
📡 Global Agencies – Improve transparency and collaboration with stakeholders.
This dashboard ensures that every stakeholder, from engineers to executives, has data-driven clarity for mission success.
✅ Click here to read the Detailed blog post
Visit our YouTube channel to learn step-by-step video tutorials
Watch the step-by-step video tutorial:
Compatibility and Requirements
- Works in Power BI Desktop, which is free to download from Microsoft. Microsoft explains how to get it in Get Power BI Desktop.
- The data lives in an Excel file with three sheets: Input_Actual, Input_Target and KPI Definition. Power BI reads from that file.
Frequently Asked Questions
Which pages does the dashboard have?
Three pages: Summary, KPI Trend and KPI Definition. The KPI Definition page is a hidden drill-through page.
How do I update the numbers?
Enter monthly actuals in the Input_Actual sheet and benchmarks in the Input_Target sheet of the Excel file. Then refresh Power BI to update the visuals.
Can I compare MTD and YTD against targets and last year?
Yes. The KPI Trend page has combo charts for MTD and YTD that show Actual, Target and Previous Year, and you can pick the KPI you want to view.
Can I add my own KPIs?
Yes. The framework is customizable, so you can add KPIs such as reusability or carbon emissions, or change the metrics to fit your mission. Define each new KPI in the KPI Definition sheet.
Is there an Excel or Google Sheets version?
Yes. See the Space Tech KPI Dashboard in Excel and the Space Tech KPI Dashboard in Google Sheets.
Related Space and Aerospace Templates
- Space Tech KPI Dashboard in Excel: the same dashboard in Excel
- Space Tech KPI Dashboard in Google Sheets: a Google Sheets edition
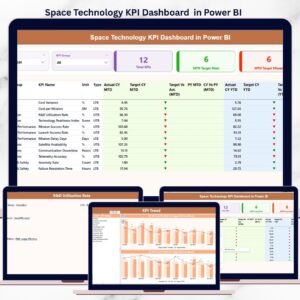
- Space Technology KPI Dashboard in Power BI: another space KPI dashboard for Power BI
- Aerospace KPI Dashboard in Power BI: KPI tracking for aerospace teams in Power BI
- Power BI Dashboard Mega Collection: 15 Power BI templates in one download
Browse all Power BI KPI dashboards.























Reviews
There are no reviews yet.