

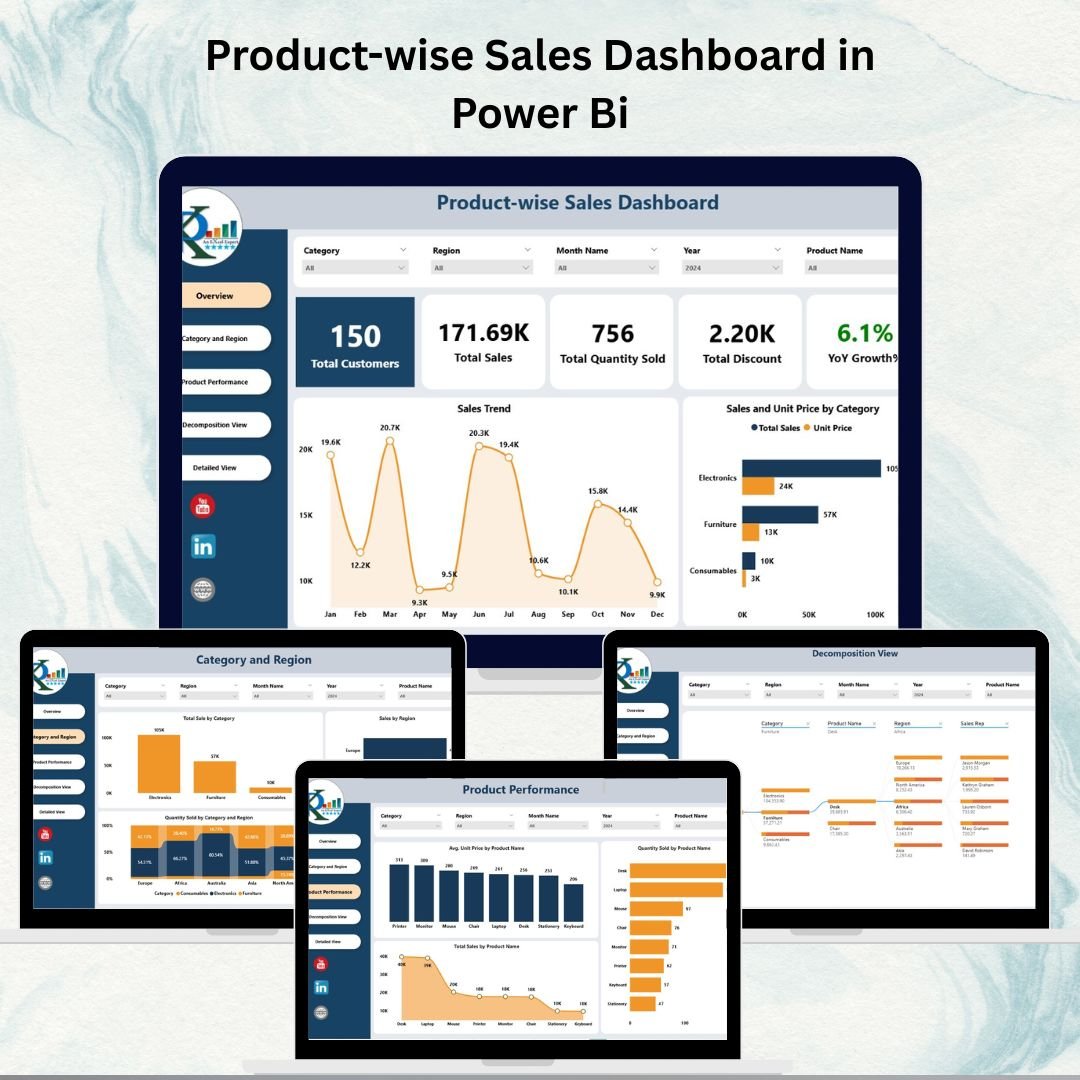

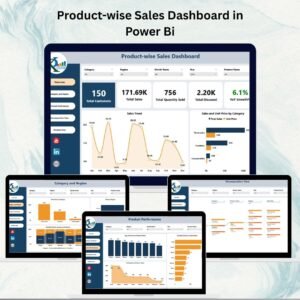
When it comes to driving business growth, understanding product-level sales performance is critical. The Product-wise Sales Dashboard in Power BI is a ready-to-use, fully interactive solution that consolidates all your sales data into one powerful platform. Designed for sales managers, business analysts, and business owners, this dashboard provides real-time insights into product performance, customer buying behavior, and regional trends — so you can make smarter, faster, and more informed decisions.
From Total Sales to YOY Growth, this dashboard visualizes every key metric with intuitive cards, charts, and drill-down options. Whether you’re identifying best-selling products, uncovering underperforming regions, or analyzing seasonal patterns, this tool helps you stay one step ahead of the competition.
🔑 Key Features of the Product-wise Sales Dashboard in Power BI
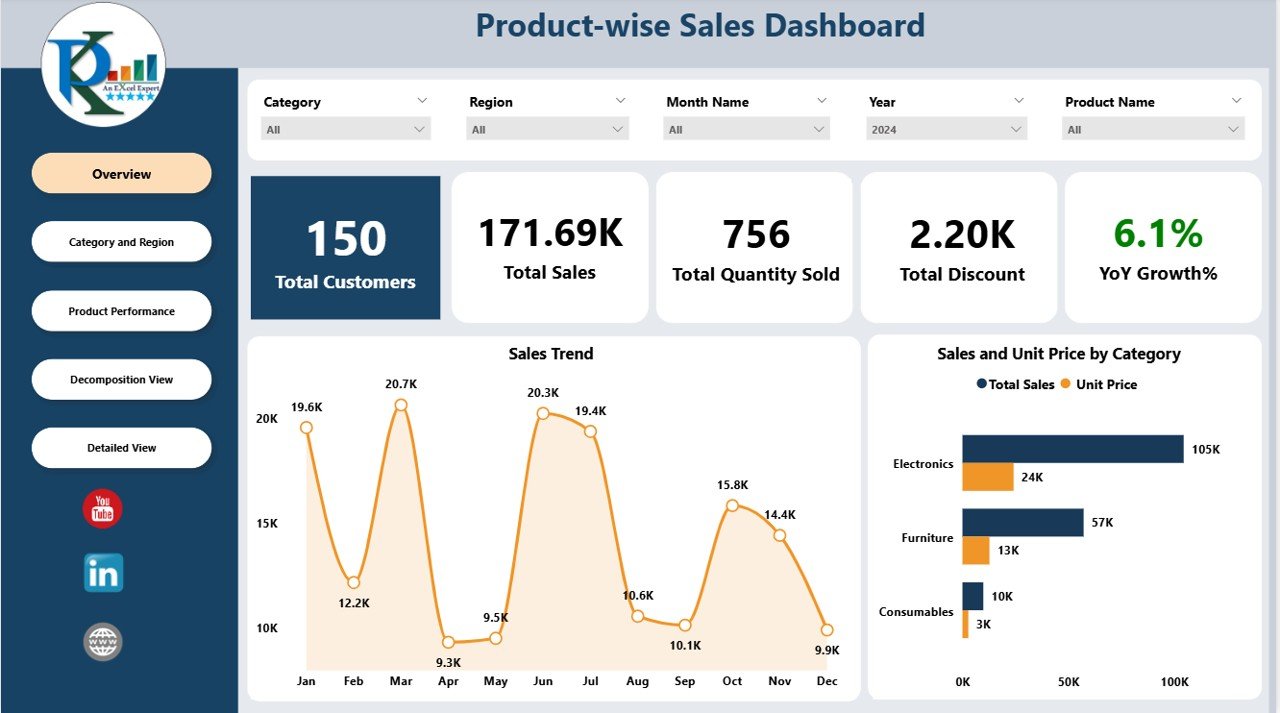
📌 Overview Page – High-Level Performance Summary
Cards Include:
Total Customers
Total Sale
Total Quantity Sold
Total Discount
YOY Growth %
Charts Include:
Sales Trend
Sales and Unit Price by Category
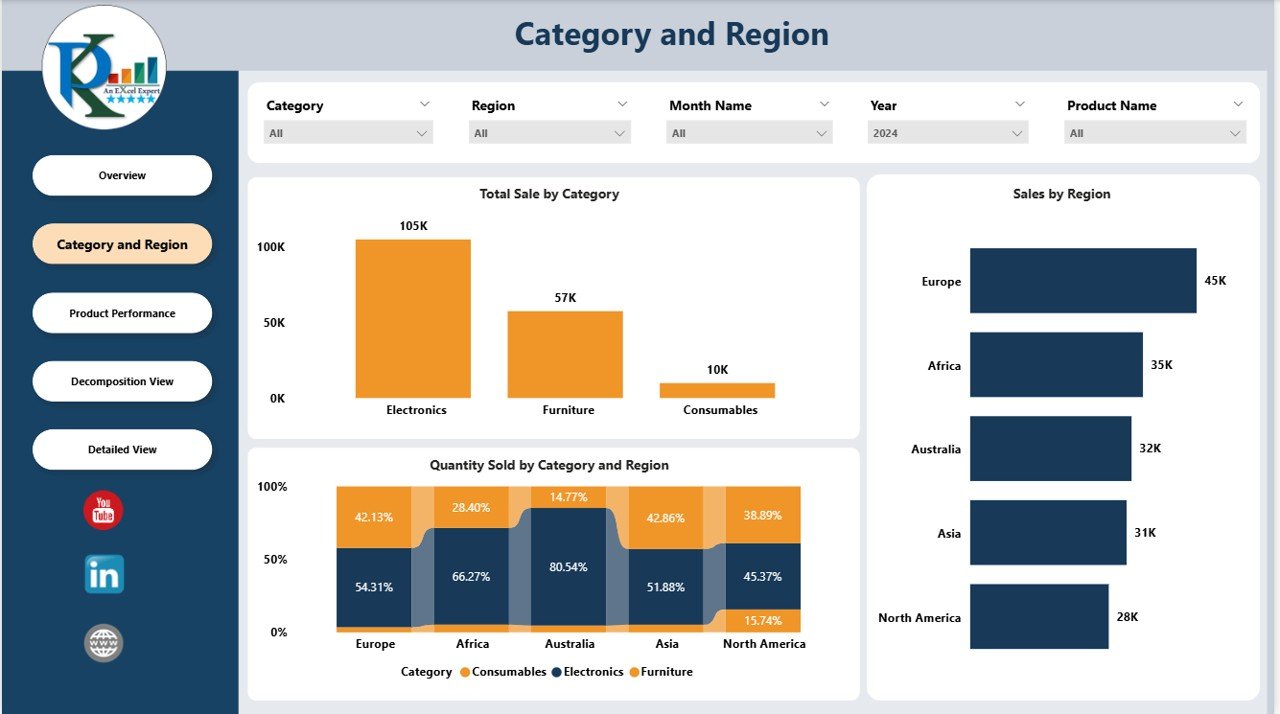
Sales by Region
Total Sales by Category
Quantity Sold by Category & Region
Perfect for a quick snapshot of your entire sales landscape.
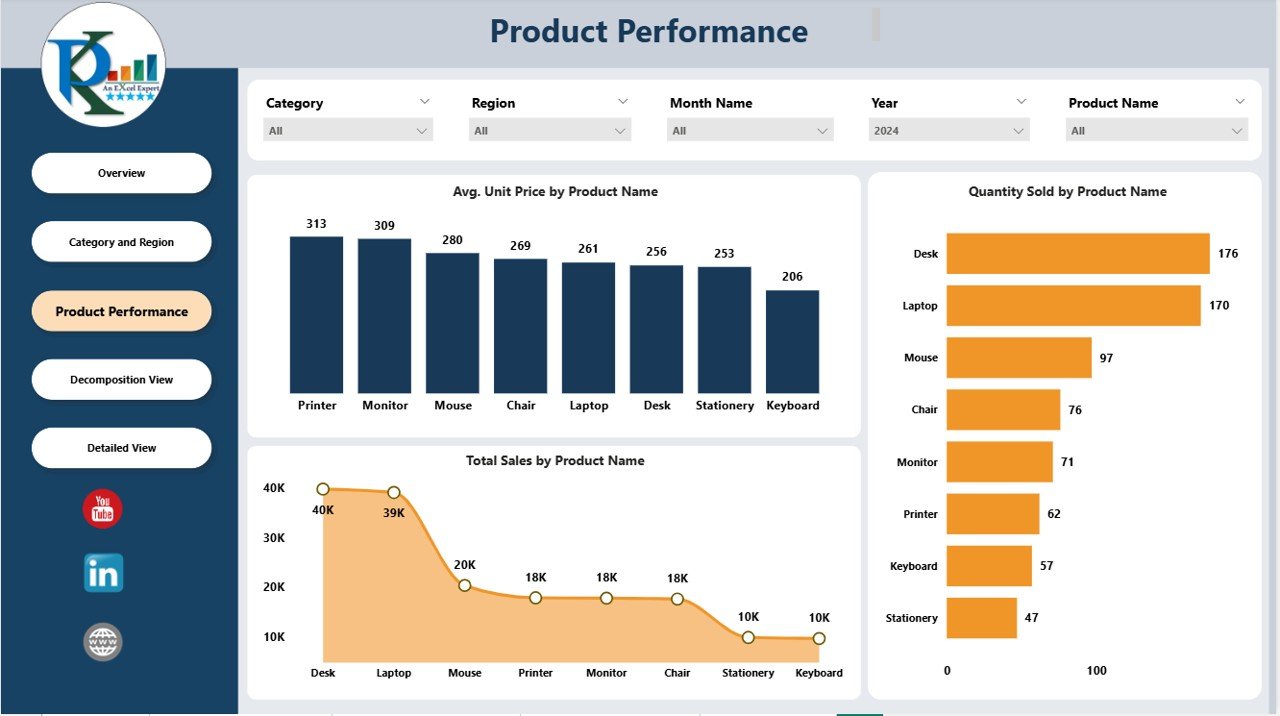
📌 Product Performance Page – Deep Product-Level Insights
Visualize Average Unit Price, Quantity Sold, and Total Sales by product
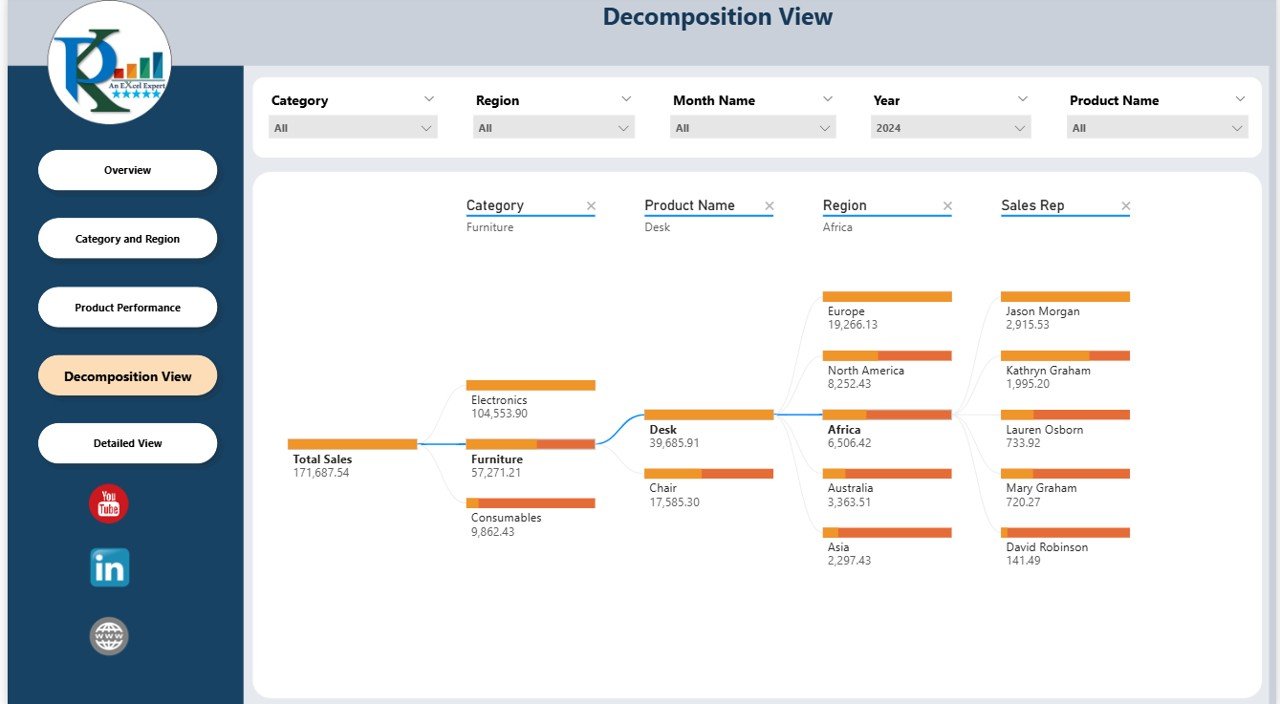
Decomposition Tree to analyze how products contribute to overall sales across categories and regions
Quickly identify top-performing products and those needing improvement
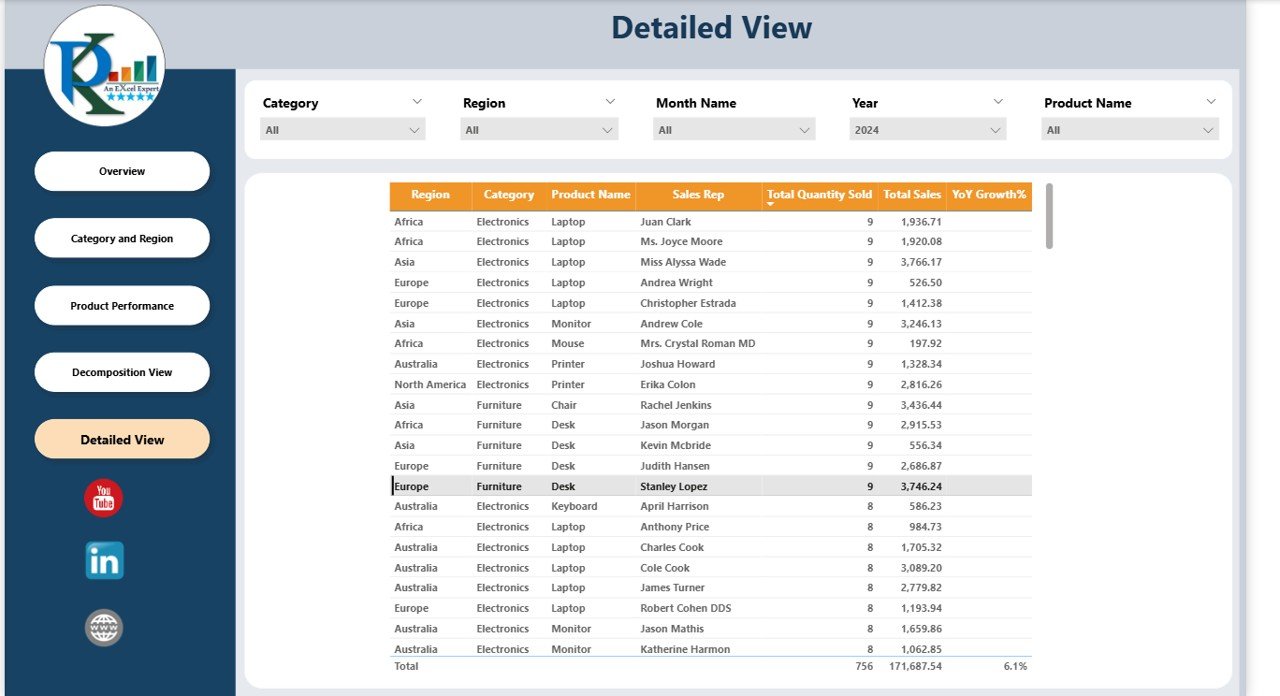
📌 Detailed View Page – Granular Transaction-Level Tracking
Interactive tables with product-level sales detail
Filter by Category, Region, Customer for focused analysis
Ideal for analysts who need to dive into transaction-level data and build custom insights
📦 What’s Inside the Dashboard?
✅ Overview Page – KPI cards and trend charts
✅ Product Performance Page – Visual breakdown by product
✅ Detailed View Page – Interactive tables and filters
✅ Decomposition Tree – Deep-dive exploratory visual
✅ Dynamic Filters – Category, Region and Customer filters
✅ Clean, Modern UI – Designed in Power BI with intuitive layout
✅ Completely Editable – Add your own KPIs or visuals as needed
🧠 How to Use the Product-wise Sales Dashboard
Load your sales dataset into Power BI
Review Overall Sales KPIs on the Overview page
Move to the Product Performance Page to explore product-level insights
Use filters (category, region, customer) to adjust the view
Analyze transactional-level data in the Detailed View Page
Monitor YOY Growth and Discounts to refine your sales strategy
👥 Who Can Benefit from This Dashboard?
🧑💼 Sales Managers – Monitor product performance and sales trends
📈 Business Analysts – Conduct deep-dive analysis by product, category, or region
🏪 Business Owners – Identify high-performing areas and improve underperforming ones
🛒 Product Managers – Track product-level profitability and discount impact
🔗 Click here to read the Detailed blog post
Watch the step-by-step video Demo:
🔗 Visit our YouTube channel to learn step-by-step video tutorials
Compatibility and Requirements
- Built for Power BI Desktop, which is free to download for Windows.
- Microsoft explains how to install it in Get Power BI Desktop.
Frequently Asked Questions
Which pages are in the Product-wise Sales Dashboard?
Three: Overview, Product Performance and Detailed View.
Which KPI cards are on the Overview page?
Total Customers, Total Sale, Total Quantity Sold, Total Discount and YOY Growth %.
What does the Decomposition Tree do?
It breaks total sales down by product, category and region so you can see what drives the total.
Can I filter the report?
Yes. Filter by Category, Region and Customer, and use the Detailed View page for transaction-level data.
Related Sales Dashboards
- Sales Dashboard in Power BI: an overall sales view in Power BI
- Channel Sales Dashboard in Power BI: compare sales by channel
- Daily Sales Dashboard in Excel: day-by-day sales in Excel
- Profit Analysis Dashboard using What-if Parameter in Power BI: test price and cost scenarios
- Power BI Dashboard Mega Collection: 15 Power BI dashboards in one bundle
Browse all Power BI dashboards or the Sales and Marketing templates.



























Reviews
There are no reviews yet.