

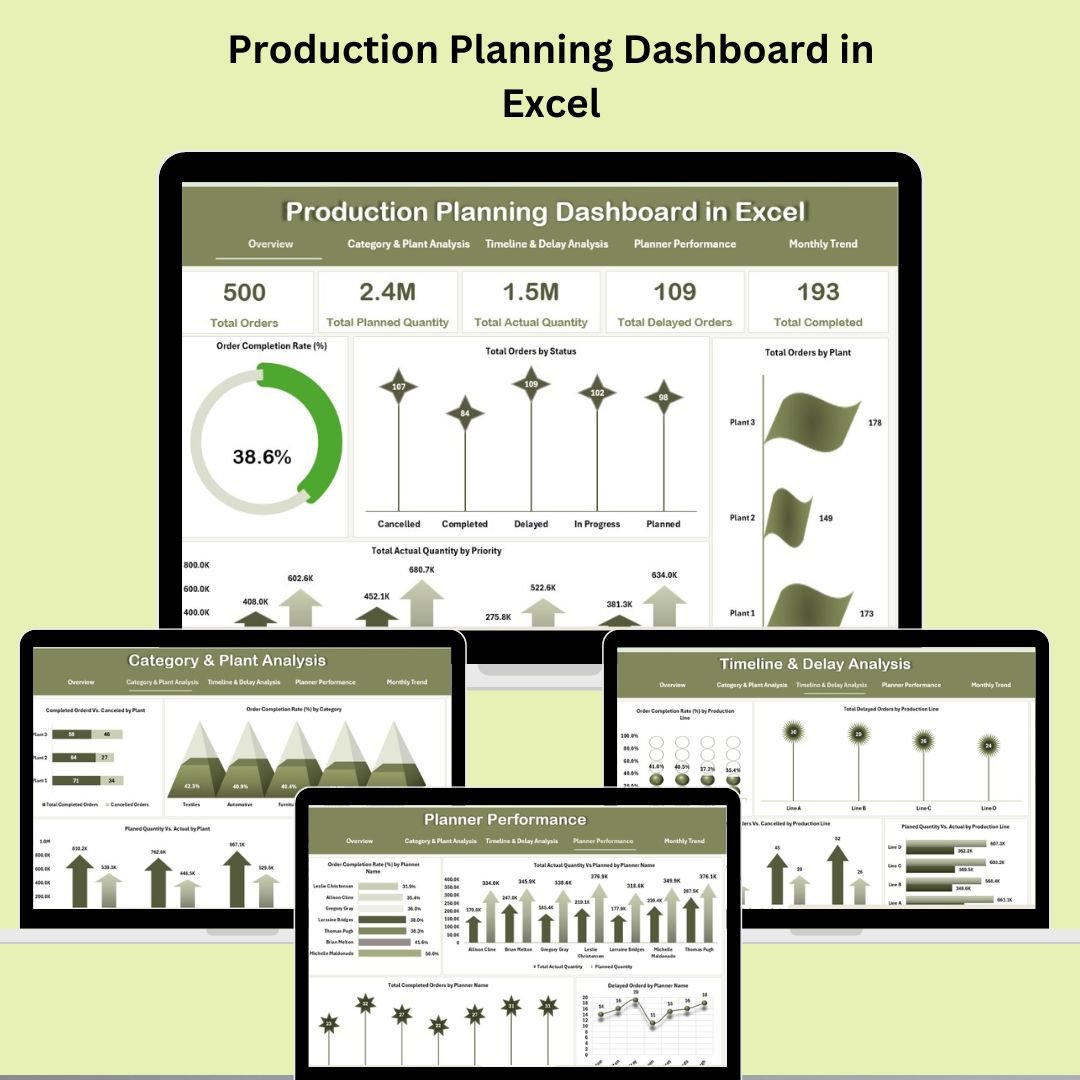
This interactive and fully automated Excel tool is your all-in-one solution for managing production orders, tracking delays, and optimizing planner performance. Whether you’re running a small factory or managing large-scale operations, this dashboard offers the real-time visibility you need to plan smart and execute flawlessly.
🎯 Key Features of the Production Planning Dashboard
Our Excel-based dashboard combines intuitive charts, slicers, and data visualizations to help you control every stage of the production process.
📌 Order Tracking: Monitor planned vs. actual production numbers, and stay updated on delayed or completed orders.
🚦 Status Management: Visualize the number of orders across statuses – Pending, Completed, or Delayed.
🏭 Plant Performance: Evaluate which plants are performing well and which need attention.
🔍 Priority-Based Metrics: Analyze production output based on order priority to align with business goals.
📦 What’s Inside the Production Planning Dashboard
This tool is structured with six powerful worksheet tabs that break down your production insights:
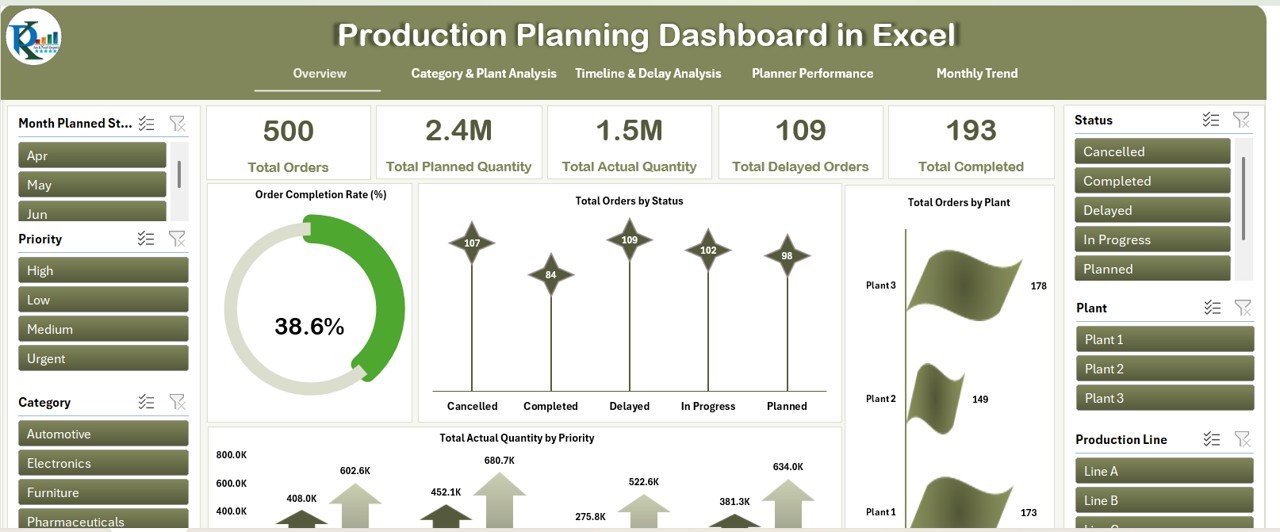
Overview Sheet 🧾
See your entire production status at a glance with summary cards and charts. Metrics include Total Orders, Planned vs. Actual Quantities, and Delayed/Completed Orders.Category & Plant Analysis Sheet 🏗️
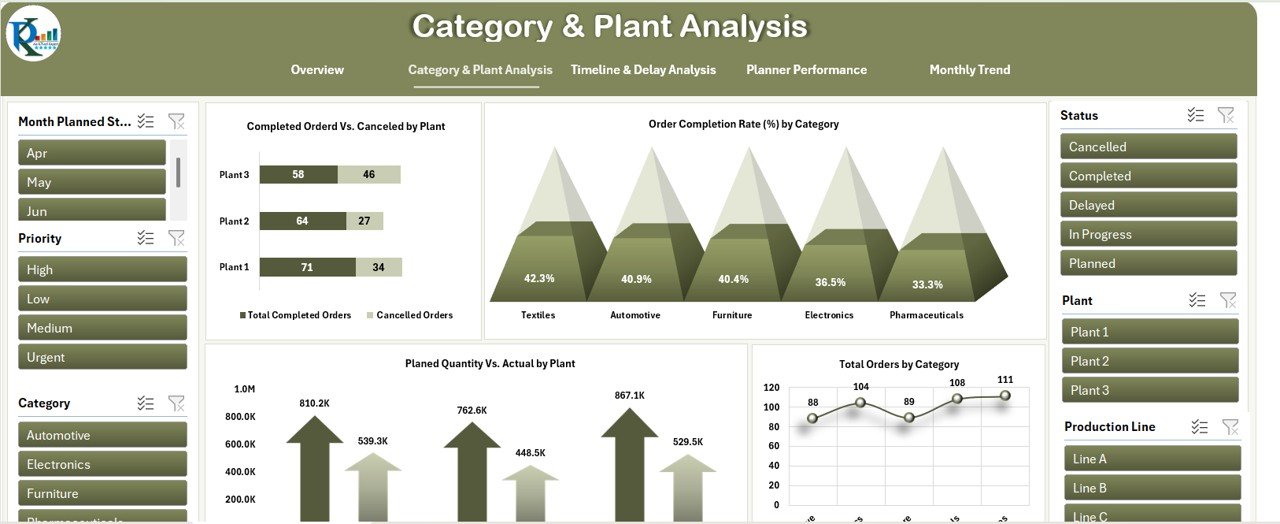
Track performance by product category and plant, including planned vs. actual output, cancellation trends, and completion rates.Timeline & Delay Analysis Sheet ⏰
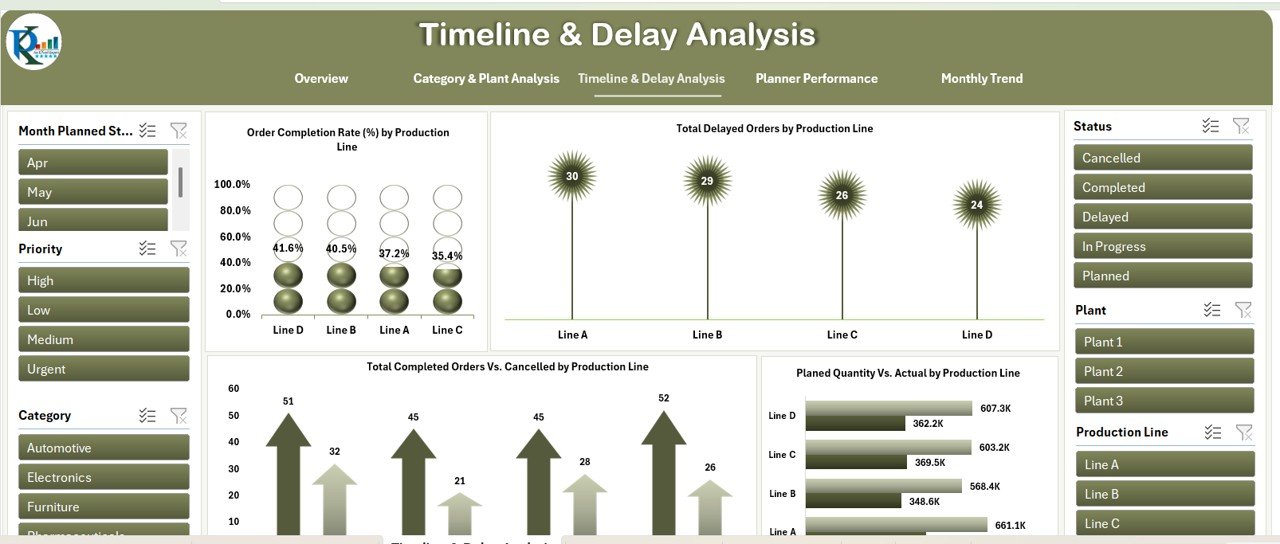
Uncover which production lines are causing delays and compare actual vs. planned production timelines.Planner Performance Sheet 👨💼
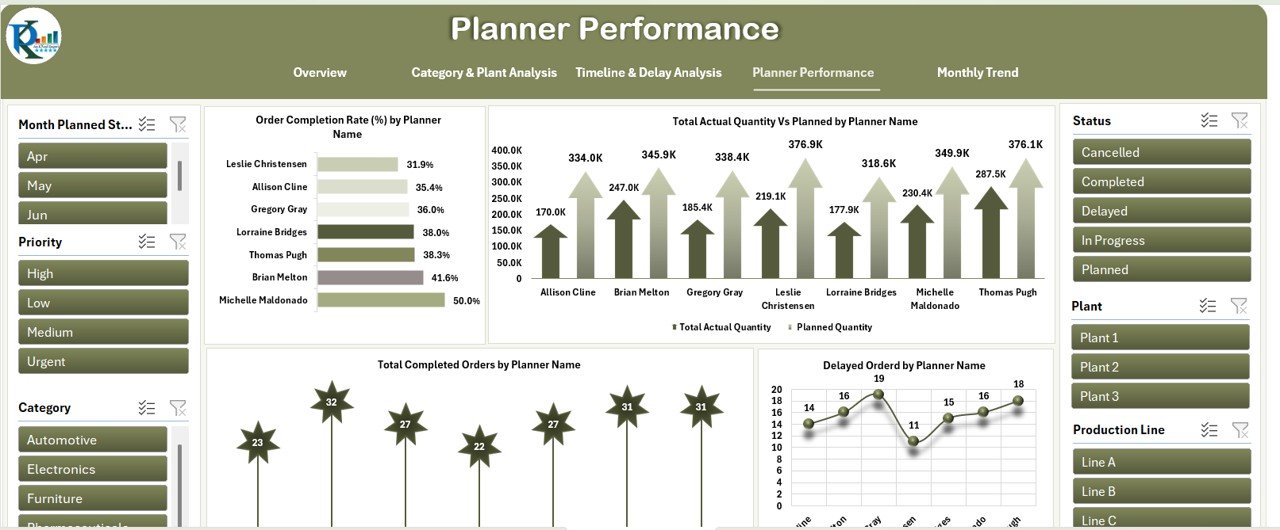
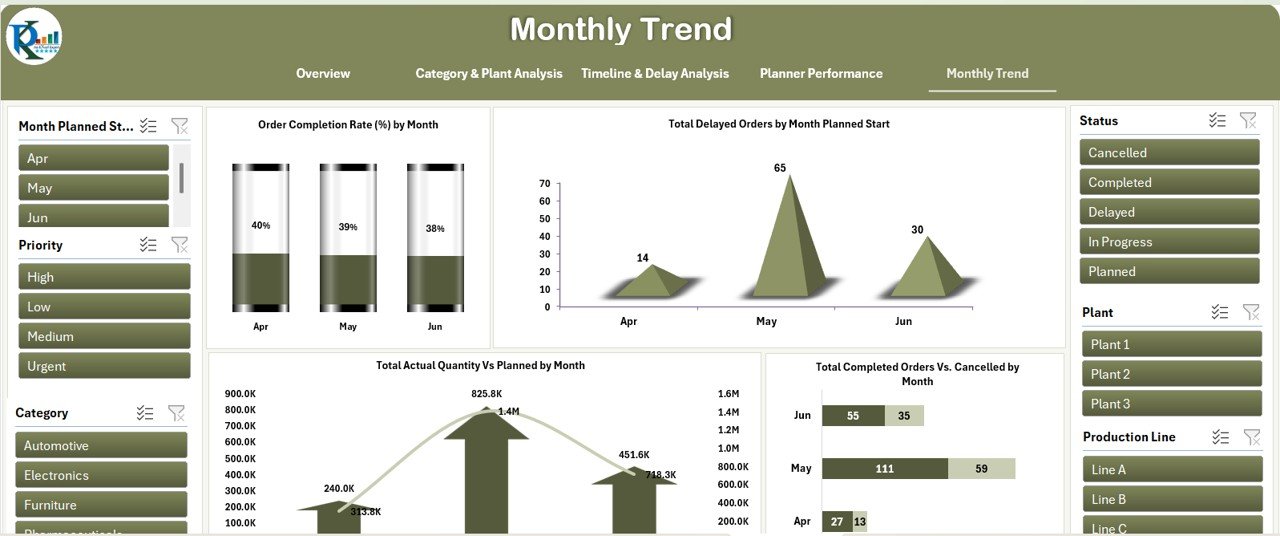
Identify your top-performing planners and find areas where planning improvements are needed.Monthly Trend Sheet 📅
Get a historical view of your production KPIs to understand long-term trends and optimize future planning.Data Sheet 💾
Your central input area for updating order, quantity, planner, plant, and production line information.
🛠️ How to Use the Production Planning Dashboard
Getting started is simple! Just follow these steps:
🔄 Input Order Data in the Data Sheet including planned dates, actual completion, plant info, and planner name.
📈 View Real-Time Metrics on the Overview tab as charts auto-update with new data.
🧮 Analyze Trends in the Timeline & Monthly Trend Sheets to detect delays or inefficiencies.
🧑🔧 Measure Planner Output using the Planner Performance Sheet.
🔧 Customize any sheet as per your reporting needs or add new KPIs using Pivot Tables.
🧑🏭 Who Can Benefit from This Dashboard
This dashboard is ideal for:
🏭 Manufacturing Managers – To oversee plant and line-level productivity.
🧑💻 Production Planners – To monitor their planning accuracy and manage timelines.
📈 Operations Teams – To ensure smooth coordination across plants and categories.
🧾 Business Analysts – For building production reports and optimization models.
































Reviews
There are no reviews yet.