

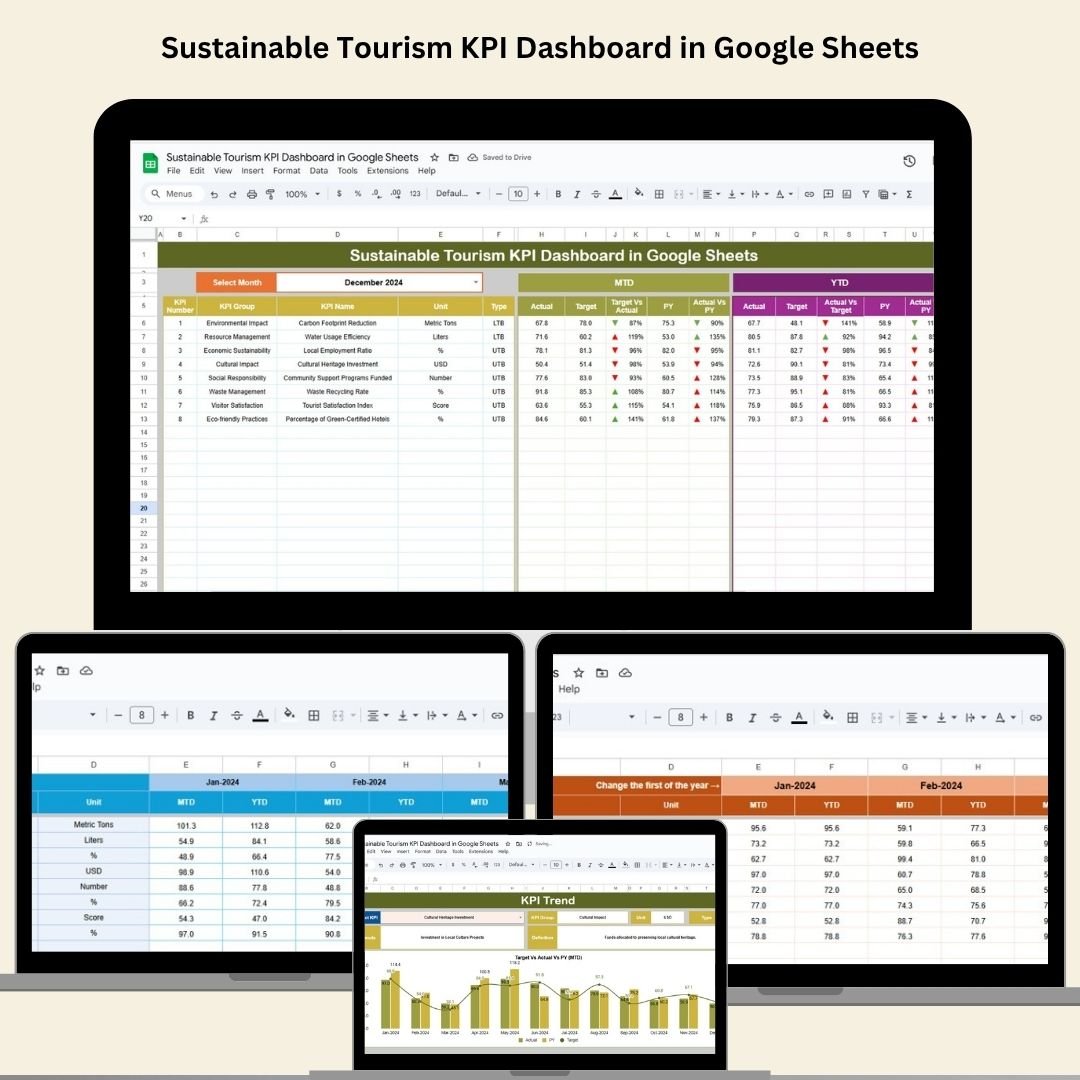

In today’s eco-conscious world, sustainability isn’t just a trend—it’s a responsibility. The Sustainable Tourism KPI Dashboard in Google Sheets gives tourism businesses the power to track environmental, social, and economic impact with precision. From carbon footprint to community engagement, this all-in-one dashboard helps you measure what truly matters.
🧭 Key Features of the Sustainable Tourism KPI Dashboard
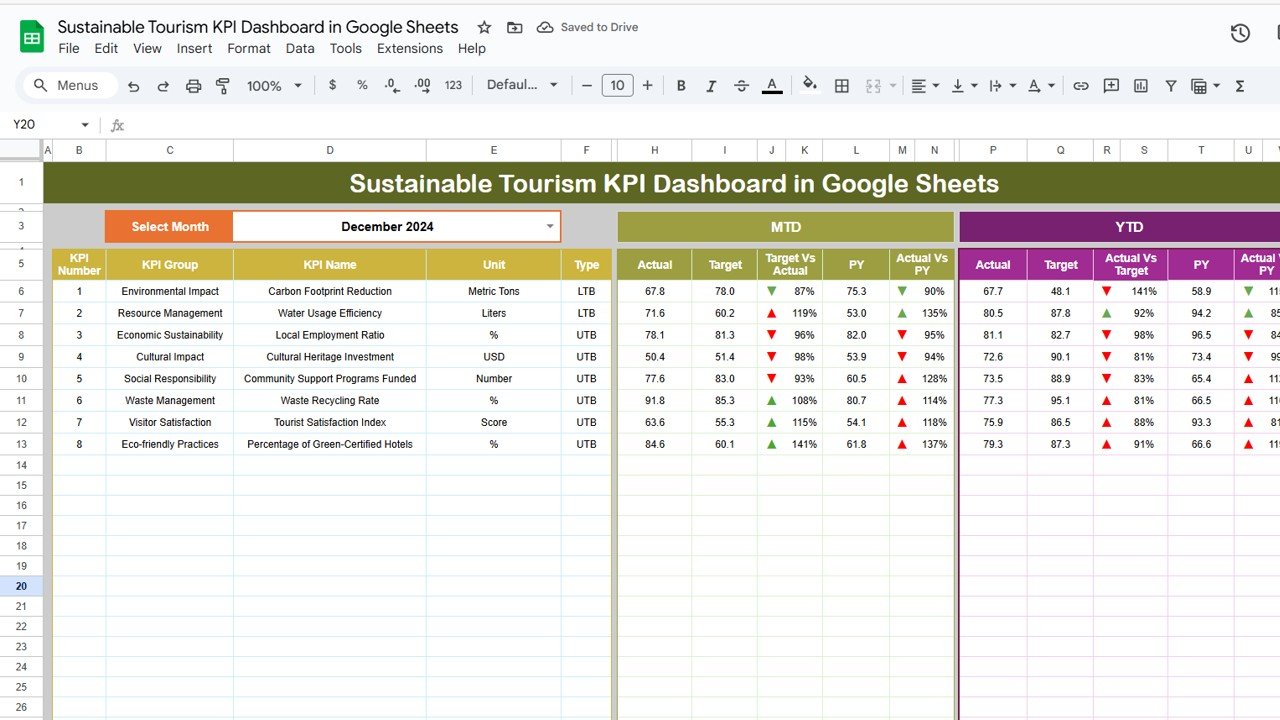
📊 Interactive Dashboard Sheet
✅ MTD & YTD Actuals – Stay updated with current and year-to-date performance
🎯 Target vs Actual – Instantly see which KPIs are on track or need improvement
📆 Previous Year Comparison – Compare against last year’s numbers
🔽 Month Dropdown (Cell D3) – Select a month and auto-refresh the entire dashboard
🔺🔻 Conditional Formatting – Visual indicators for fast performance assessment
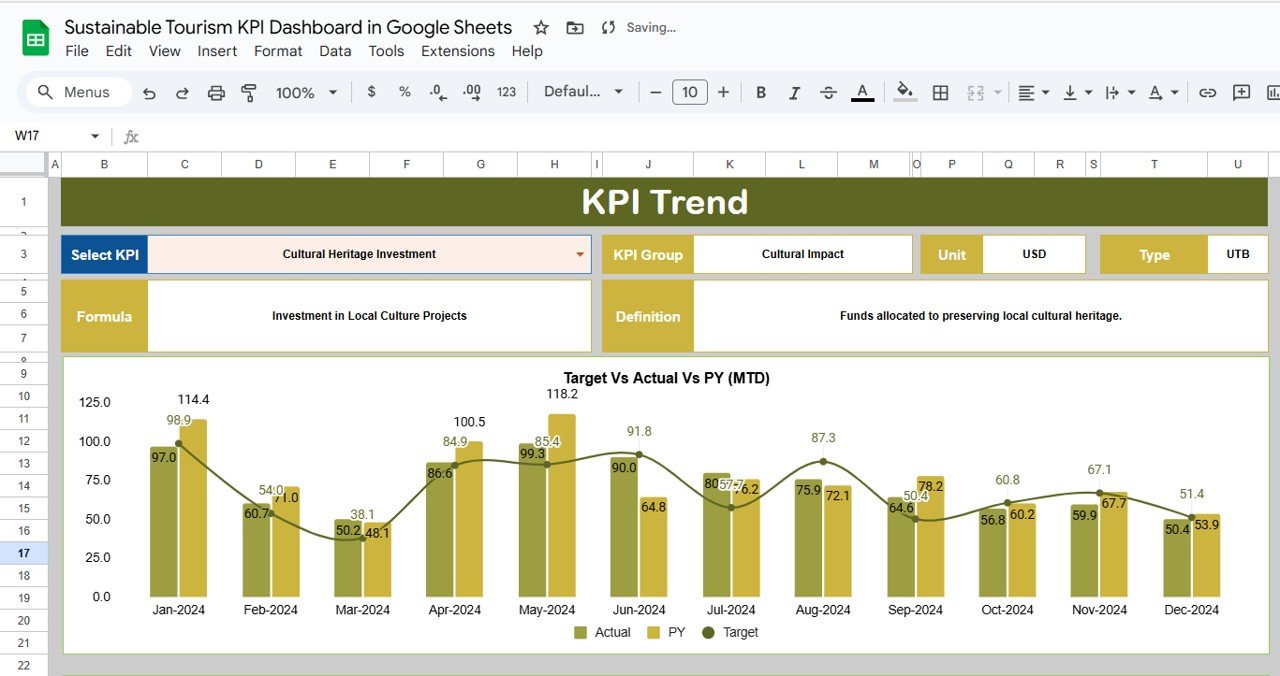
📈 KPI Trend Sheet Tab
🔍 Select any KPI to analyze historical trends
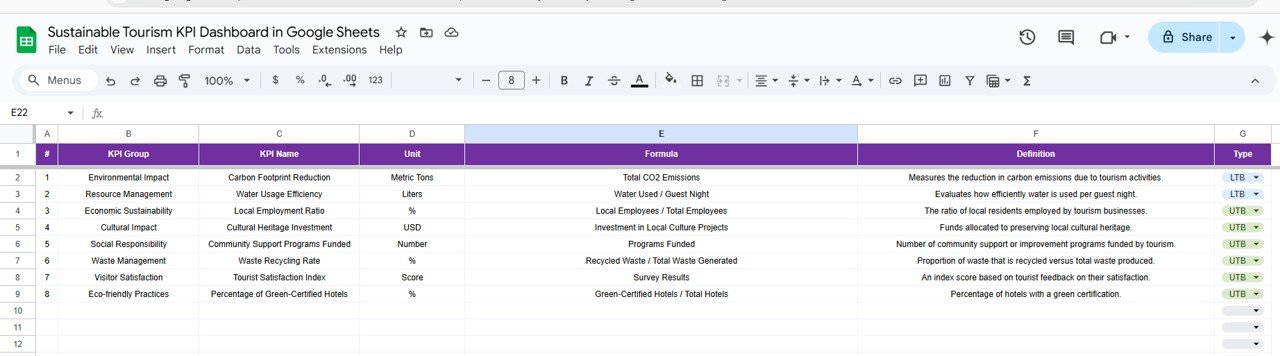
🧮 View its Group, Unit, Formula, Definition, and whether it’s LTB (Lower the Better) or UTB (Upper the Better)
📥 Data Entry Made Easy
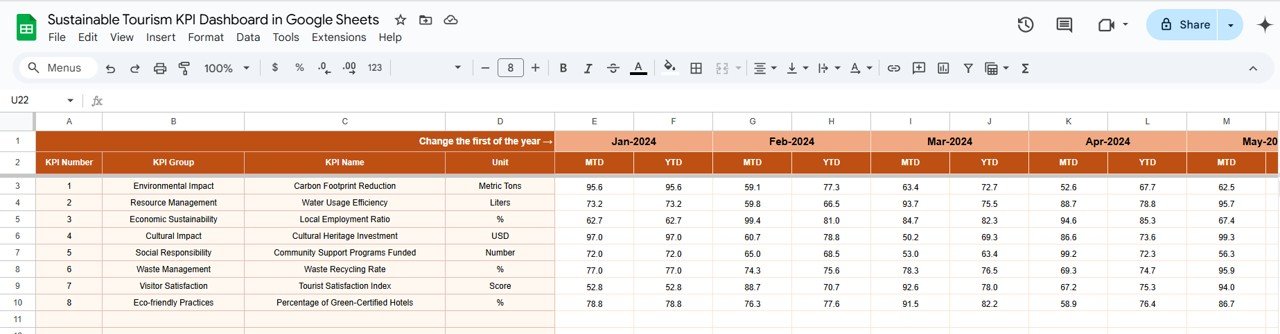
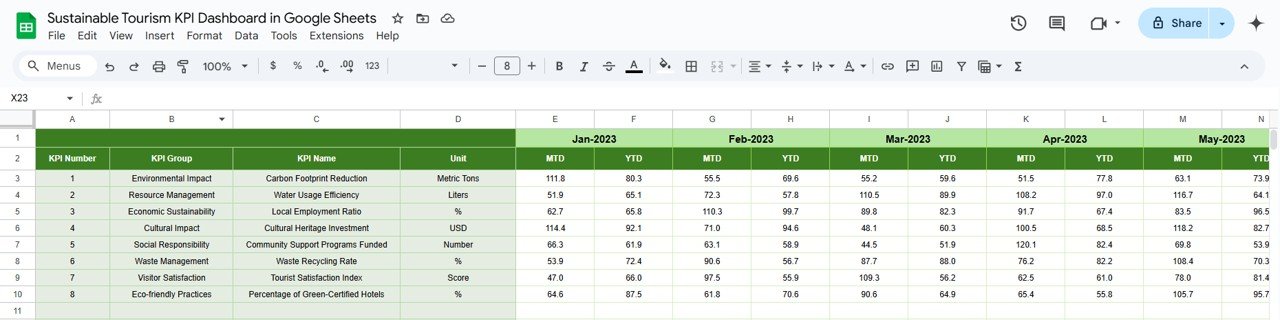
Actual Numbers Sheet – Enter MTD/YTD actuals; the dashboard updates automatically
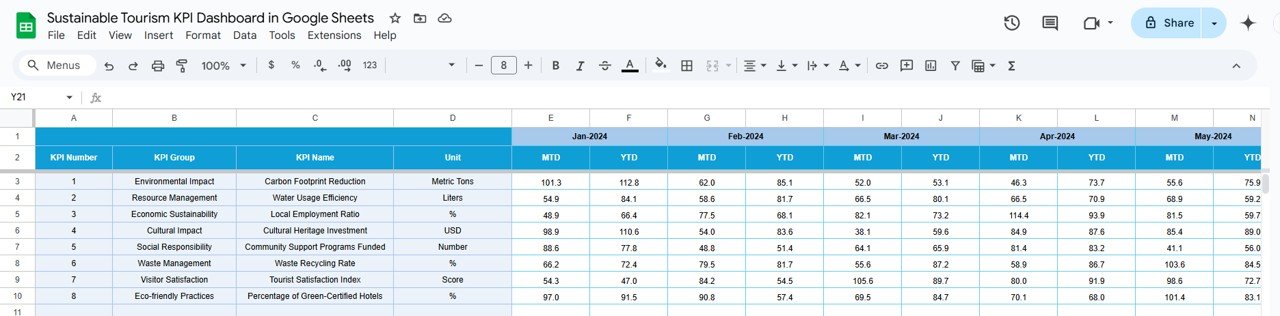
Target Sheet – Input monthly and annual sustainability goals
Previous Year Sheet – Enter last year’s data to track progress over time
📖 KPI Definition Sheet
View definitions, formulas, and measurement units for each KPI
Ensures clarity and alignment across your sustainability team
📦 What’s Inside the Sustainable Tourism KPI Dashboard
This Google Sheets template includes six fully integrated tabs:
1️⃣ Dashboard – High-level KPI summary with interactive visuals
2️⃣ KPI Trend – Choose any KPI and visualize monthly performance
3️⃣ Actual Numbers – Fill in monthly and year-to-date actuals
4️⃣ Target Sheet – Enter monthly and yearly goals
5️⃣ Previous Year Numbers – Store and compare past performance
6️⃣ KPI Definitions – Complete glossary of KPI formulas and purposes
Each tab works together to give you real-time insight into your sustainability journey.
🛠️ How to Use the Sustainable Tourism KPI Dashboard
📝 Enter Actual Data – Input monthly & YTD numbers into the Actual Numbers tab
🎯 Set Targets – Define realistic goals in the Target tab
📅 Select Month – Use the dropdown to focus on a specific month
📊 View Results – The dashboard automatically calculates and displays comparisons
📈 Track KPI Trends – Use the Trend tab to spot performance over time
🔄 Compare with Previous Year – Analyze YOY growth in sustainability
Zero coding. Zero setup. 100% impact.
👥 Who Can Benefit from This Dashboard?
🏨 Eco-Friendly Hotels & Resorts – Track water, energy, and waste reduction efforts
🗺️ Sustainable Tour Operators – Monitor community engagement and emissions
🛳️ Cruise Lines & Adventure Companies – Evaluate resource efficiency metrics
🌿 Destination Management Organizations – Oversee multi-location sustainability KPIs
🏕️ Ecotourism & Nature Parks – Track conservation goals and visitor impact
If sustainability matters to your tourism brand—this tool is essential.
💡 Why Choose This Google Sheets Dashboard?
✅ Easy to Use – No learning curve. Plug in your data and go
✅ Fully Editable – Add KPIs, adjust formulas, or change layouts
✅ Live Visuals – Real-time arrows and highlights for instant decisions
✅ Month & Year Comparisons – Spot trends and gaps
✅ No Software Required – Google Sheets = access from anywhere
✅ Professional-Grade Reporting – Export to PDF or present live in meetings
🔁 Click here to read the Detailed blog post
Click here to read the Detailed blog post
Watch the step-by-step video Demo:
🎥 Visit our YouTube channel to learn step-by-step video tutorials
Youtube.com/@NeotechNavigators
Compatibility and Requirements
- Works in Google Sheets. You need a free Google account and a web browser.
- You pick the month from a dropdown in cell D3 of the Dashboard sheet. Google explains dropdowns in Create an in-cell dropdown list.
More Questions About This Template
How many sheets does the dashboard have?
Six sheets: Dashboard, KPI Trend, Actual Numbers, Target, Previous Year Numbers and KPI Definitions.
How do I update the dashboard?
Enter your MTD and YTD figures in the Actual Numbers sheet and your goals in the Target sheet. Then choose a month in cell D3 of the Dashboard sheet and the whole dashboard refreshes.
Can I compare this year with last year?
Yes. Add last year’s figures to the Previous Year Numbers sheet and the Dashboard shows them next to your actuals and targets.
How do I see the history of one KPI?
Open the KPI Trend sheet and select the KPI. It shows the group, unit, formula, definition and whether the KPI is Lower the Better (LTB) or Upper the Better (UTB).
Is there an Excel or Power BI version?
Yes. See the Sustainable Tourism KPI Dashboard in Excel and the Sustainable Tourism KPI Dashboard in Power BI.
Related Tourism Templates
- Sustainable Tourism KPI Dashboard in Excel: the same sustainability KPIs in Excel
- Sustainable Tourism KPI Dashboard in Power BI: the Power BI edition
- Travel & Tourism KPI Dashboard in Google Sheets: general tourism KPIs in Google Sheets
- Travel and Tourism KPI Scorecard In Google Sheets: a scorecard view of tourism metrics
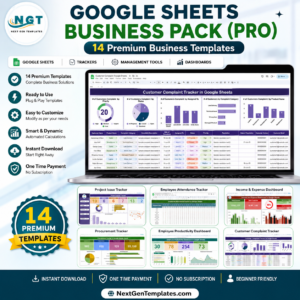
- Google Sheets Business Pack (Pro): 14 business templates in one download
Browse all Google Sheets KPI dashboards.


Reviews
There are no reviews yet.