



Key Features of Artificial Intelligence KPI Dashboard in Excel ✨
Artificial Intelligence (AI) is transforming industries—from financial services and healthcare to marketing and logistics. But tracking the performance of AI initiatives isn’t simple. Scattered reports and manual tracking methods are slow, error-prone, and fail to provide real-time insights. The Artificial Intelligence KPI Dashboard in Excel solves this challenge by offering a consolidated, easy-to-use, and visual tracking system.
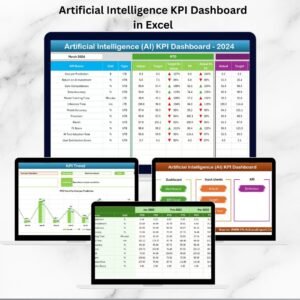
This Excel-based tool centralizes AI-related metrics, from model accuracy and data quality to ROI and adoption rates. With dynamic charts, slicers, and conditional formatting, even complex performance indicators become simple to understand and act upon.
Key highlights include:
📊 MTD & YTD Tracking – Monitor short-term and long-term AI performance.
✅ Actual vs. Target Comparisons – Identify gaps quickly.
📈 Trend Analysis – Spot patterns and evaluate KPI behavior over time.
🎨 Interactive Design – Built-in navigation buttons for easy movement.
💡 Customizable KPIs – Add new metrics to match your business goals.
🚀 Audit-Friendly – Transparent KPI definitions and formulas.
What’s Inside the AI KPI Dashboard 📂
The template comes with seven structured worksheets that make performance tracking effortless:

Home Sheet
Works as an index page with six navigation buttons.
Lets you jump directly to Dashboard, KPI Trend, Data Input, Targets, and more.
Dashboard Sheet
The main performance hub.
Drop-down menu (cell D3) to select a month.
Updates automatically with MTD & YTD insights.
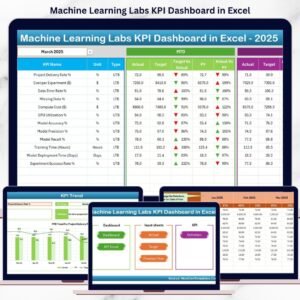
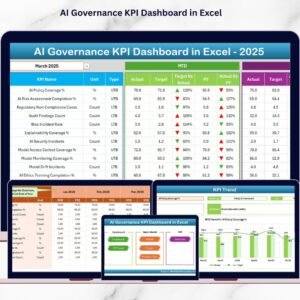
Displays Actual vs. Target vs. Previous Year.
Conditional arrows show growth or decline instantly.
KPI Trend Sheet
Deep dive into individual KPIs.
Drop-down selector (cell C3) to analyze a specific metric.
Includes KPI details like Group, Unit, Formula, and Definition.
Charts show MTD & YTD trends across Actual, Target, and Previous Year.
Actual Numbers Input Sheet
Enter monthly performance data.
Control cell (E1) allows you to set your fiscal year start month.
Ensures consistent alignment with reporting timelines.
Target Sheet
Stores monthly and yearly target values.
Helps you set benchmarks and measure progress accurately.
Previous Year Numbers Sheet
Historical data storage for YoY comparisons.
Mirrors the structure of the Actual and Target sheets.
KPI Definition Sheet
Master reference list of KPIs.
Provides KPI Name, Group, Unit, Formula, and Definition.
Ensures transparency and consistency across teams.
Advantages of Using the AI KPI Dashboard 🌟
📌 Centralized Insights – One file for all AI KPIs.
⏳ Real-Time Updates – Dashboard updates instantly when data is entered.
🎯 Customizable – Adapt it to industries like healthcare AI, finance AI, or retail AI.
🖱️ Easy Navigation – Index buttons save time and effort.
📊 Transparent Metrics – Clear KPI definitions and formulas.
🔄 Comprehensive Tracking – Both MTD and YTD performance in one place.
🕒 Historical Comparisons – Compare with last year’s data to measure growth.
Opportunities for Improvement 💡
You can enhance this template even further by:
🔔 Adding Forecasting Models – Use Excel’s predictive analytics.
⚙️ Automating Data Input – Link with external sources or databases.
📈 Expanding KPI Library – Add advanced AI metrics like model drift or fairness score.
👤 Role-Based Dashboards – Create executive, manager, and developer views.
🌐 Integrating with Power BI – For more interactive visuals.
Best Practices for Using the AI KPI Dashboard 🛠️
Define KPIs clearly with formulas in the KPI Definition sheet.
Update Actual and Target data monthly for accuracy.
Use visuals wisely—only meaningful arrows and progress bars.
Train your team on how to navigate and interpret trends.
Align KPIs with business goals, not just technical performance.
Review definitions and targets annually to keep them relevant.
✅ Click here to read the Detailed blog post
📺 Visit our YouTube channel to learn step-by-step video tutorials
Watch the step-by-step video tutorial:
Compatibility and Requirements
- Works in Microsoft Excel desktop (Excel 2016 or later, or Microsoft 365).
- You pick the month from a dropdown on the Dashboard sheet and the KPI from a dropdown on the KPI Trend sheet. Microsoft explains dropdowns in Create a drop-down list.
Frequently Asked Questions
Which sheets are included?
Seven sheets: Home, Dashboard, KPI Trend, Actual Numbers Input, Target, Previous Year Numbers and KPI Definition.
How do I update the dashboard?
Enter your monthly figures in the Actual Numbers Input sheet and your goals in the Target sheet. Then choose a month in cell D3 of the Dashboard sheet and it shows MTD and YTD results.
Can I compare this year with last year?
Yes. Add last year’s figures to the Previous Year Numbers sheet. The Dashboard shows Actual, Target and Previous Year side by side, with arrows for growth or decline.
How do I look at one KPI in detail?
Open the KPI Trend sheet and pick the KPI in cell C3. It shows the group, unit, formula and definition, plus MTD and YTD charts for Actual, Target and Previous Year.
Can I change the fiscal year start month?
Yes. Set the start month in cell E1 of the Actual Numbers Input sheet so the reporting periods match your fiscal year.
Is there a Power BI or Google Sheets version?
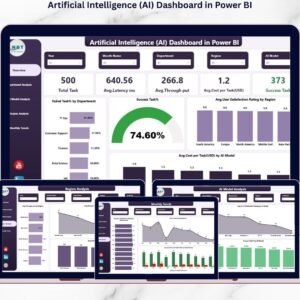
There is an Artificial Intelligence (AI) KPI Dashboard in Power BI. For Google Sheets, see the Artificial Intelligence AI Dashboard in Google Sheets.
Related AI and Business Intelligence Templates
- Artificial Intelligence (AI) KPI Dashboard in Power BI: the same AI KPIs in Power BI
- Artificial Intelligence (AI) Dashboard in Excel: another AI dashboard layout in Excel
- Artificial Intelligence AI Dashboard in Google Sheets: an AI dashboard for Google Sheets
- Creating an Artificial Intelligence Ethics KPI Dashboard in Excel: KPIs for AI ethics
- Business Intelligence (BI) KPI Dashboard in Excel: a general BI KPI dashboard
Browse all Excel KPI dashboards.




















Reviews
There are no reviews yet.