

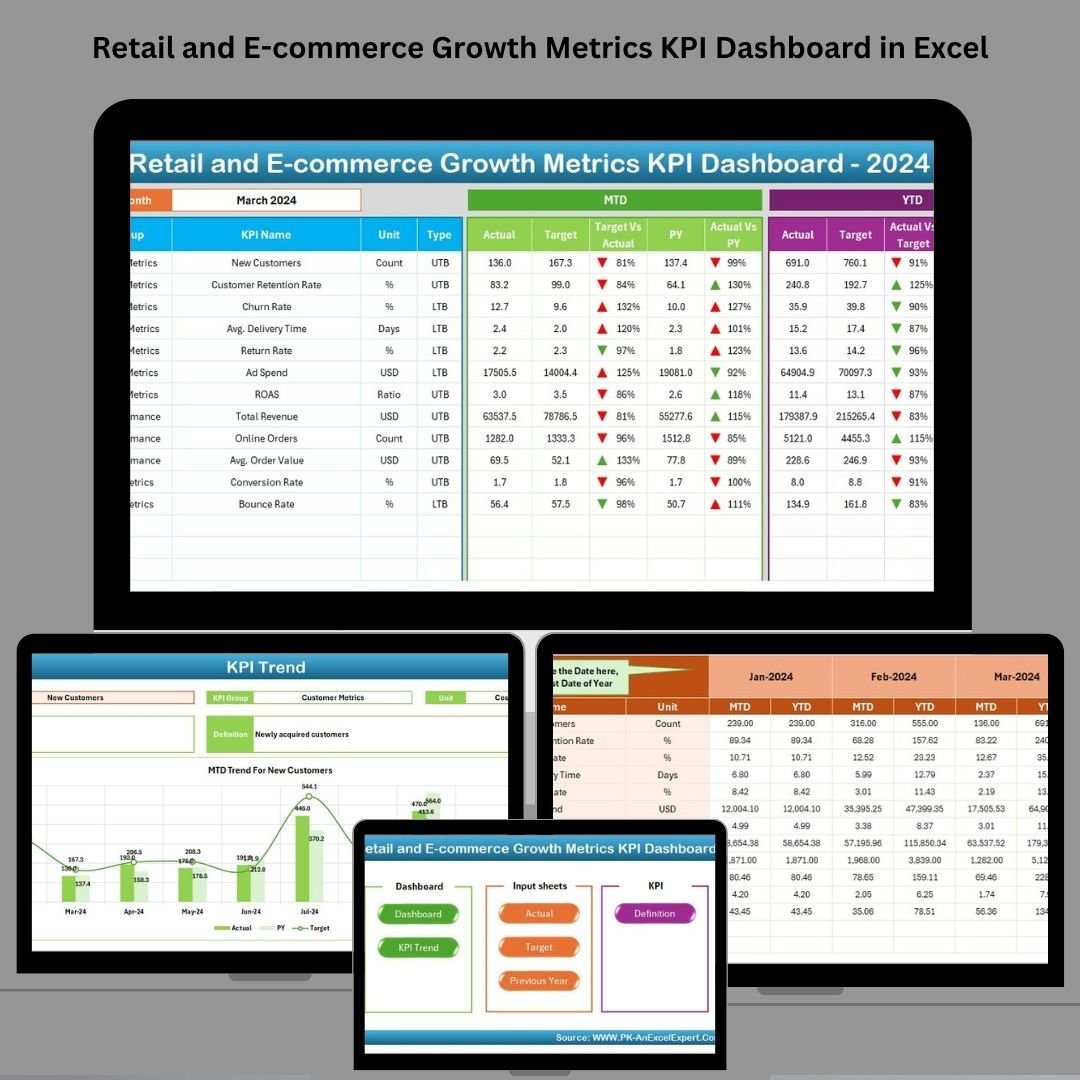


Success in retail and e-commerce hinges on real-time insights and fast decision-making. That’s exactly what the Retail and E-commerce Growth Metrics KPI Dashboard in Excel delivers—a plug-and-play analytics tool that gives you a 360° view of your business performance. 🧾📈
This Excel-based dashboard helps you track vital KPIs like revenue growth, conversion rate, customer acquisition cost, and inventory turnover—all from one centralized, easy-to-use file. Whether you’re a store owner, analyst, or manager, this tool equips you to analyze, optimize, and scale your operations efficiently.
🔧 Key Features of the KPI Dashboard
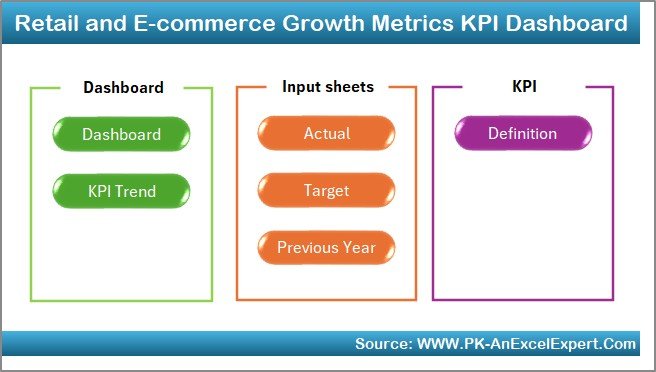
🏠 Home Sheet – Central Command
Navigate the entire dashboard with ease using button-based shortcuts to all seven worksheet tabs.
📊 Dashboard Sheet – MTD & YTD Metrics in One View
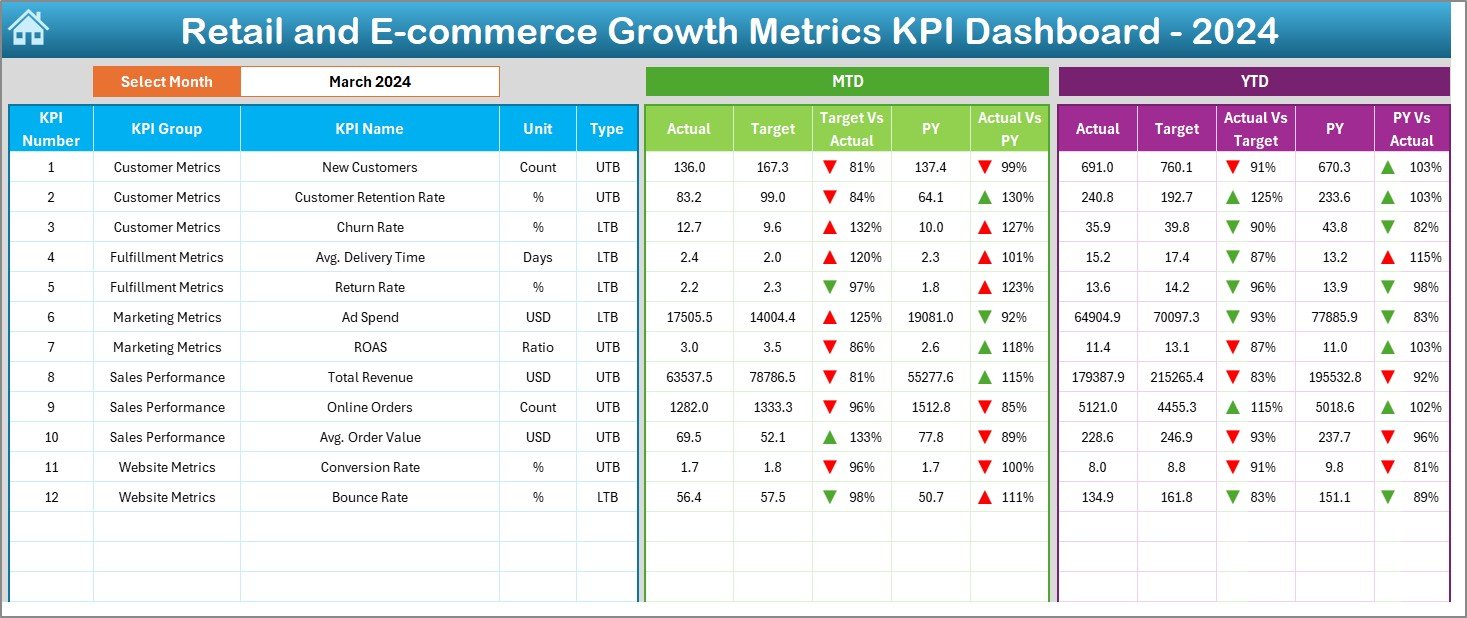
Drop-down selector for month (cell D3)
Visual charts with Actual vs Target
Compare with Previous Year (PY) figures
Conditional formatting for quick up/down visual cues
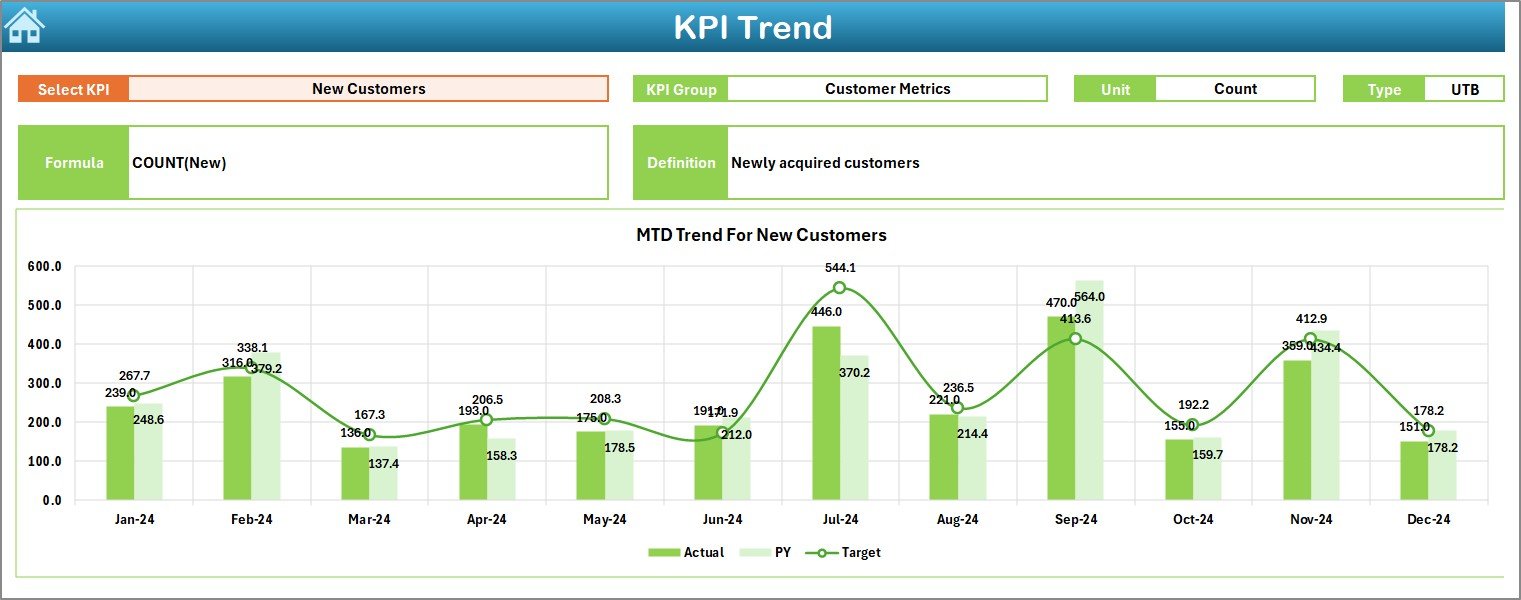
📈 KPI Trend Sheet – Pattern Detection Made Easy
Select any KPI from a drop-down
See detailed charts for Month-to-Date and Year-to-Date trends
Auto-pulls definitions and formulas from the KPI list
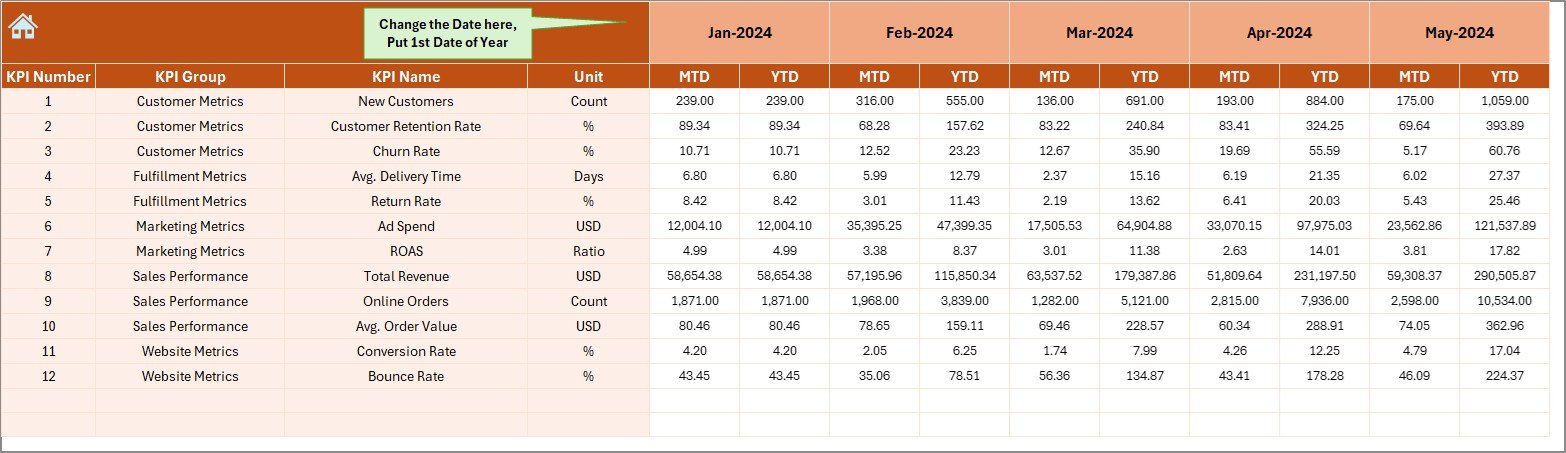
📥 Actual Numbers Input Sheet
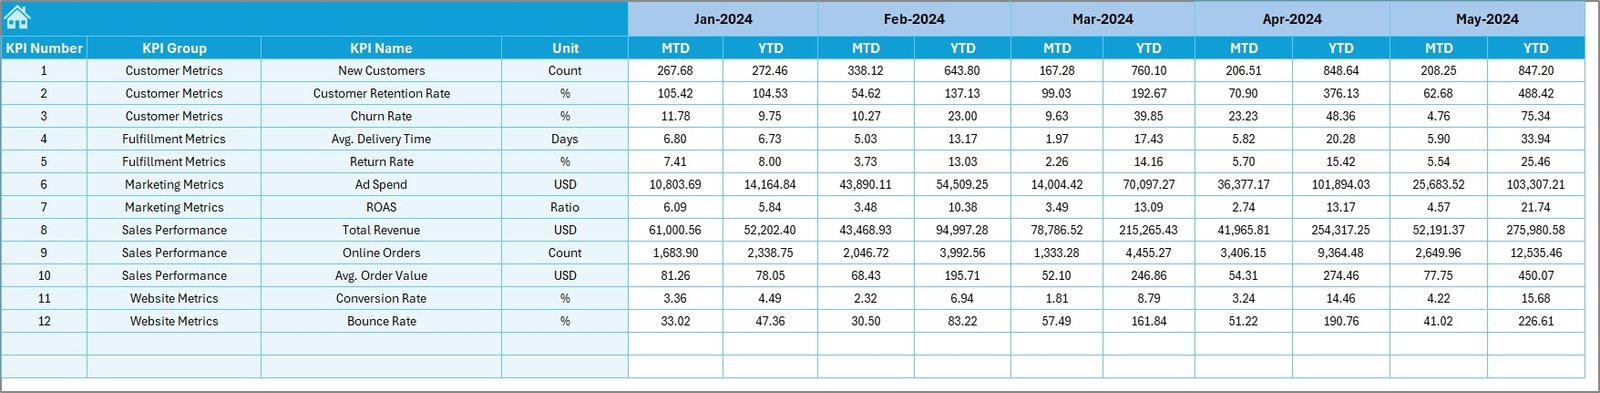
Enter monthly actual data for all KPIs
Set your fiscal year start month (cell E1)
Ensures up-to-date reporting
🎯 Target Sheet
Set your MTD and YTD goals
Adjust targets at any time with easy inputs
📆 Previous Year Numbers Sheet
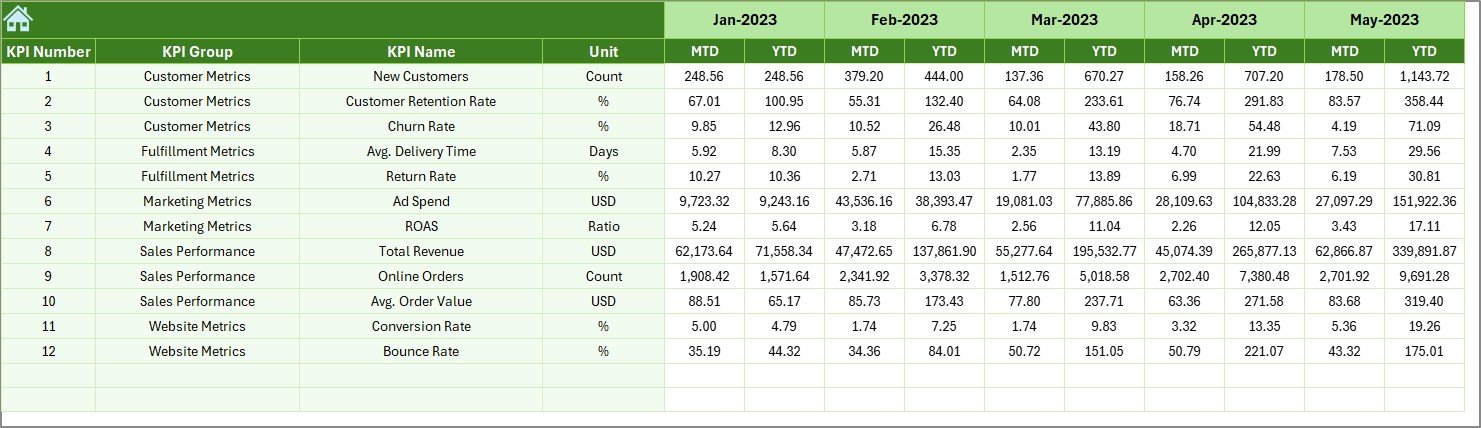
Add past MTD and YTD values for comparative analysis
Spot growth trends and seasonal dips
📚 KPI Definition Sheet
Reference for all KPI formulas, units, and descriptions
Ensures transparency and team alignment
📂 What’s Inside the Dashboard?
✅ Pre-built Excel file with 7 interlinked tabs
✅ Drop-down filters for KPI and Month selection
✅ Conditional formatting with performance arrows
✅ Dynamic charts for MTD & YTD comparisons
✅ Data input sheets for Actuals, Targets, and Previous Year
✅ Custom KPI documentation sheet
✅ Navigation-friendly design—no Excel expertise needed!
🛠️ How to Use the Dashboard (Step-by-Step)
1️⃣ Start from the Home Sheet – Use buttons to jump to key tabs
2️⃣ Input Monthly Data – Fill in Actuals, Targets, and PY values
3️⃣ View the Dashboard Sheet – Select a month and view performance metrics
4️⃣ Analyze Trends – Use the KPI Trend tab to identify performance shifts
5️⃣ Reference Definitions – Always stay aligned using the KPI Definition tab
6️⃣ Customize – Add or remove KPIs, change charts, or update formulas as needed
👥 Who Can Benefit from This Dashboard?
This tool is perfect for:
🛍️ Online Retailers – Monitor web conversions, AOV, and abandoned carts
🏬 Physical Stores – Track departmental sales and return rates
📦 Inventory Managers – Watch turnover and stock efficiency
📣 Marketing Teams – Evaluate CAC and retention performance
📊 Analysts & Business Owners – Make smart, data-driven decisions
✅ Click here to read the Detailed blog post
🔗 Visit our YouTube channel to learn step-by-step video tutorials
Watch the step-by-step video tutorial:
Compatibility and Requirements
- Works in Microsoft Excel desktop (Excel 2016 or later, or Microsoft 365).
- You pick the month and the KPI from dropdowns, and the charts update from your inputs. Microsoft explains dropdowns in Create a drop-down list.
Frequently Asked Questions
How many worksheets does the dashboard have?
Seven worksheets: Home, Dashboard, KPI Trend, Actual Numbers, Target, Previous Year Numbers and KPI Definition.
How do I update the dashboard each month?
Enter your monthly actuals on the Actual Numbers sheet and your goals on the Target sheet. Then choose the month in cell D3 of the Dashboard sheet and the MTD and YTD views update.
Can I compare this year with last year?
Yes. Add last year’s MTD and YTD values on the Previous Year Numbers sheet. The Dashboard shows them next to Actual and Target.
How do I see the trend for a single KPI?
Open the KPI Trend sheet and pick a KPI from the dropdown. It shows MTD and YTD charts and pulls the definition and formula from the KPI Definition sheet.
Can I start my fiscal year in a different month?
Yes. Set the fiscal year start month in cell E1 of the Actual Numbers sheet.
Is there a Google Sheets version?
Not of this exact dashboard. For a similar retail view in Google Sheets, see the E-commerce Dashboard in Google Sheets.
Related Retail and E-commerce Templates
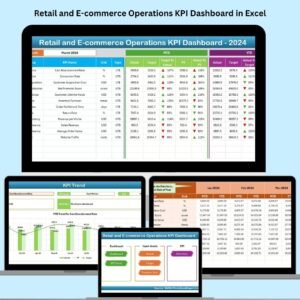
- Retail and E-commerce Operations KPI Dashboard in Excel: KPIs for day-to-day store operations
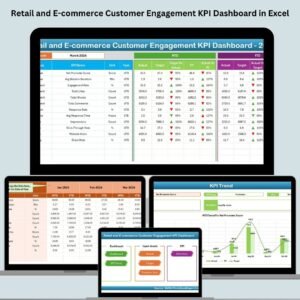
- Retail and E-commerce Customer Engagement KPI Dashboard in Excel: customer-side metrics
- Retail and E-commerce Stakeholder Reporting KPI Dashboard in Excel: reporting for owners and partners
- Sales and Marketing Growth Metrics KPI Dashboard in Excel: the same growth layout for sales and marketing
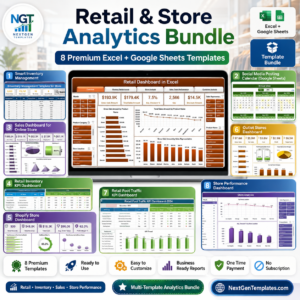
- Retail & Store Analytics Bundle: 8 templates for Excel and Google Sheets in one download
Browse all Excel KPI dashboards.













Reviews
There are no reviews yet.