

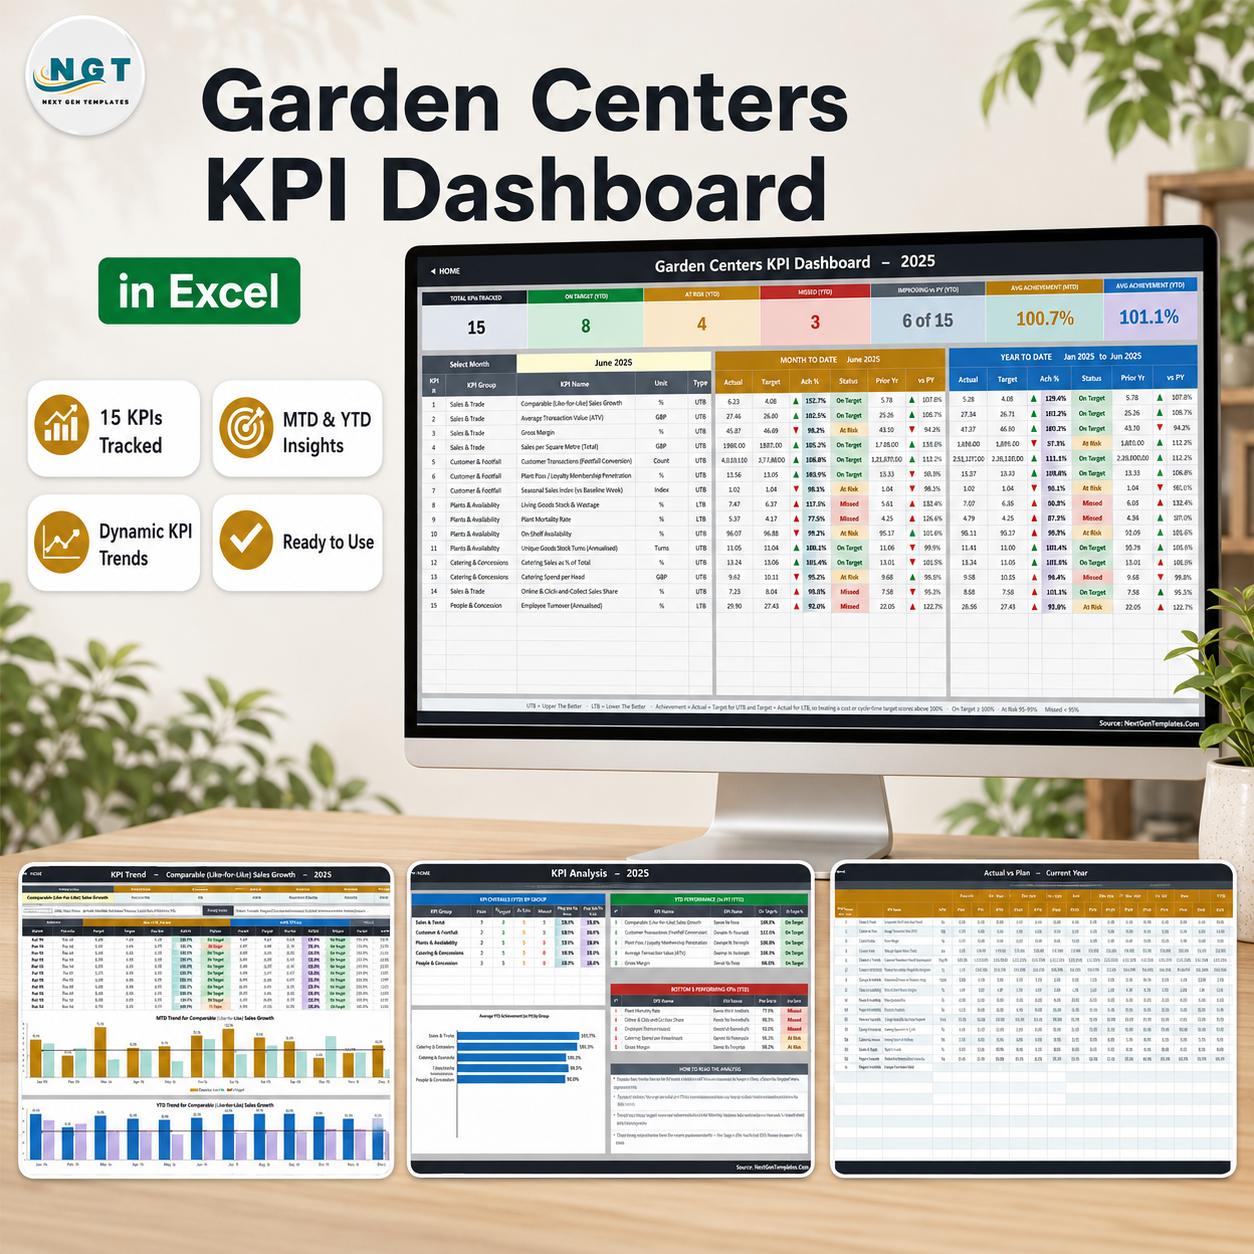
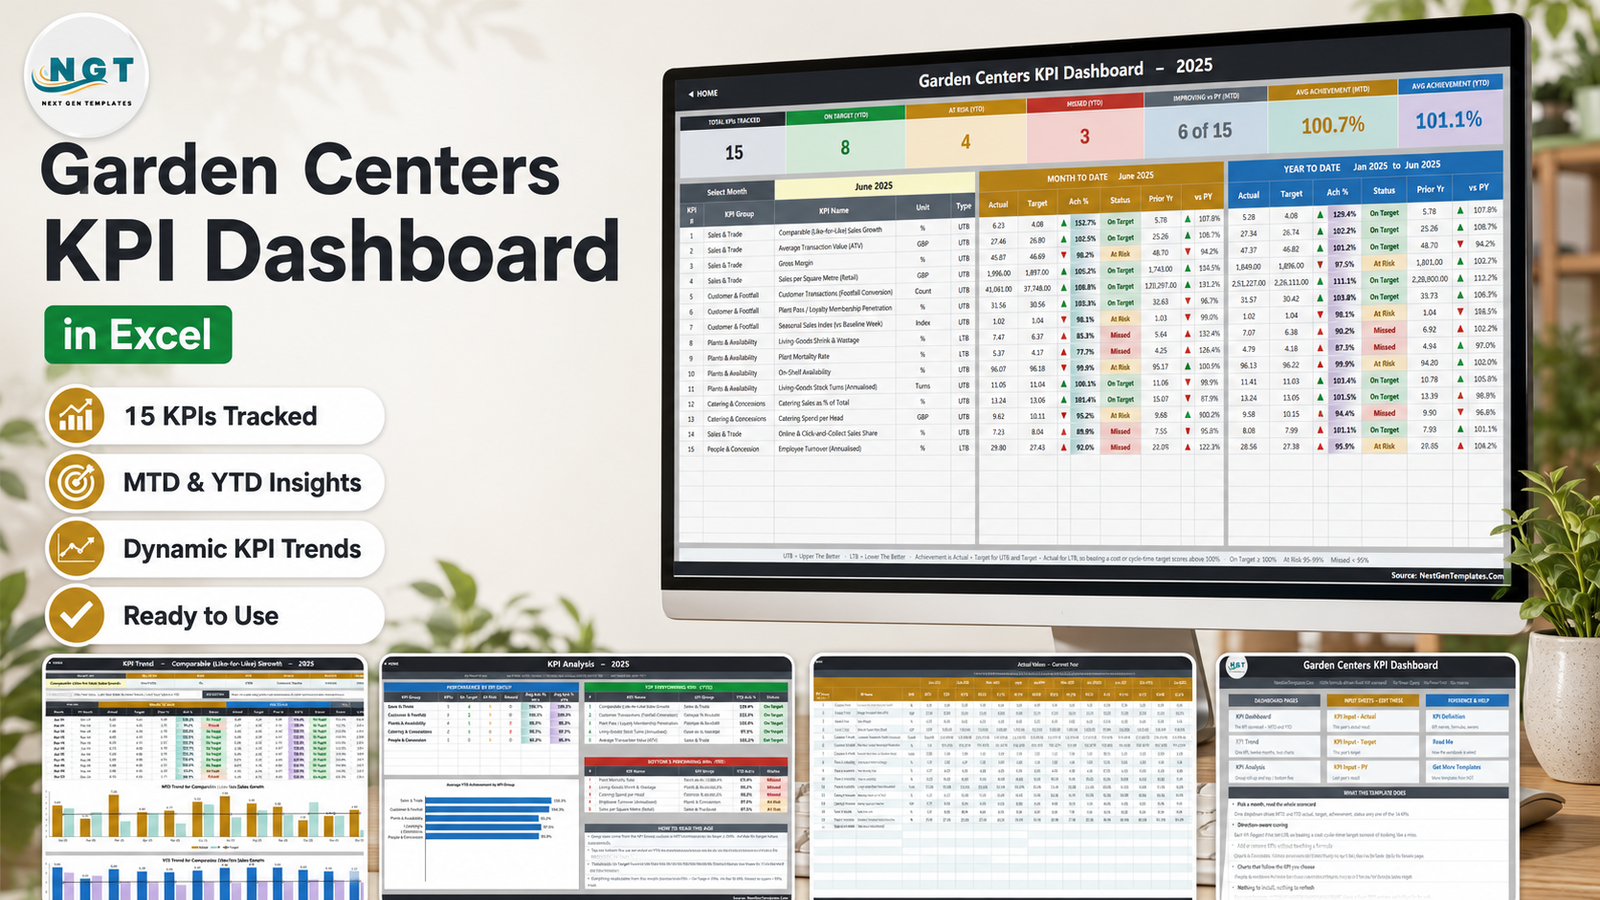

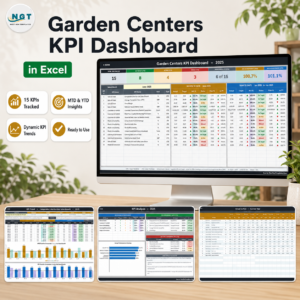
The Garden Centers KPI Dashboard in Excel is a month-picker KPI scorecard for garden centre operators: 15 KPIs across five groups, each with MTD and YTD actual, target, achievement, traffic-light status, prior year and year-on-year movement, all driven by one dropdown. Every number is a plain worksheet formula – VLOOKUP, MATCH, INDEX and COUNTIF. There is no Power Query, no data model, no macro and no add-in, so it opens in Excel 2013 and later and in Excel for the web without a single trust prompt. The download ships the workbook with twelve months of sample data already in it plus a PDF user manual, so you can see the whole scorecard working before you type anything of your own. Instant download, lifetime access to the file you buy.
Key Features of the Garden Centers KPI Dashboard in Excel
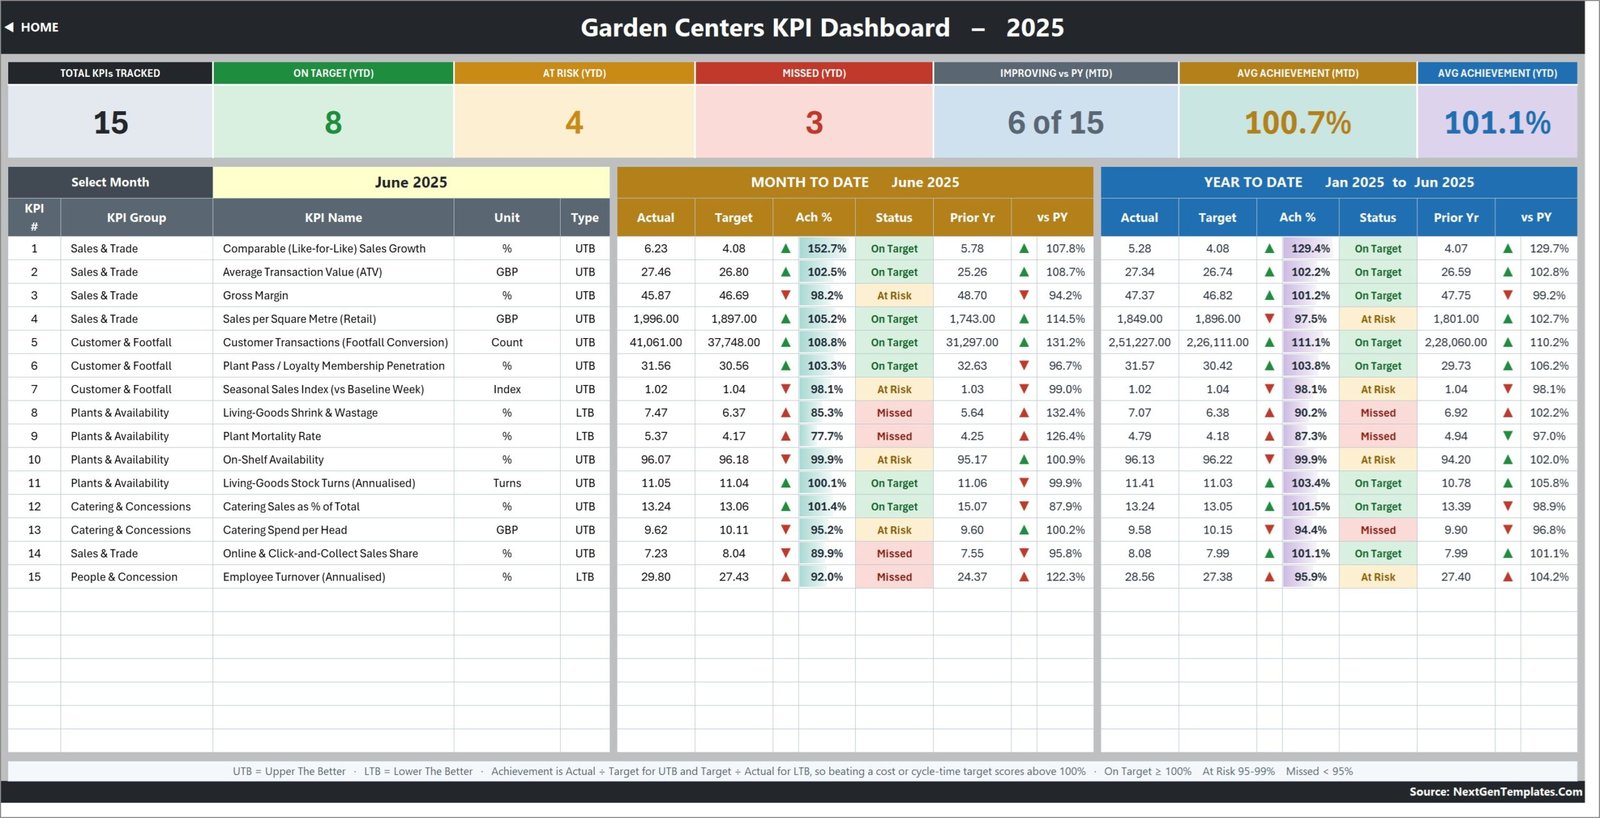
- One dropdown drives the whole scorecard. Cell D6 on KPI Dashboard lists the twelve months of your reporting year. Pick June and every MTD column, every YTD column, all seven summary cards and the entire KPI Analysis page follow it.
- 15 garden-centre KPIs, grouped the way the business is run. Sales & Trade (5), Customer & Footfall (3), Plants & Availability (4), Catering & Concessions (2) and People & Concession (1).
- Direction-aware scoring. Each KPI is flagged UTB (upper the better) or LTB (lower the better). Achievement is Actual / Target for a UTB KPI and Target / Actual for an LTB one, so beating a shrink or mortality target scores above 100% instead of looking like a miss.
- Traffic lights you control. On Target from 100%, At Risk 95-99%, Missed below 95%. The thresholds sit in the formulas in columns L and U on KPI Dashboard – change them to match your own governance.
- Seven summary cards. Total KPIs Tracked, On Target (YTD), At Risk (YTD), Missed (YTD), Improving vs PY (MTD), Avg Achievement (MTD) and Avg Achievement (YTD). In the sample month they read 15, 8, 4, 3, 6 of 15, 100.7% and 101.1%.
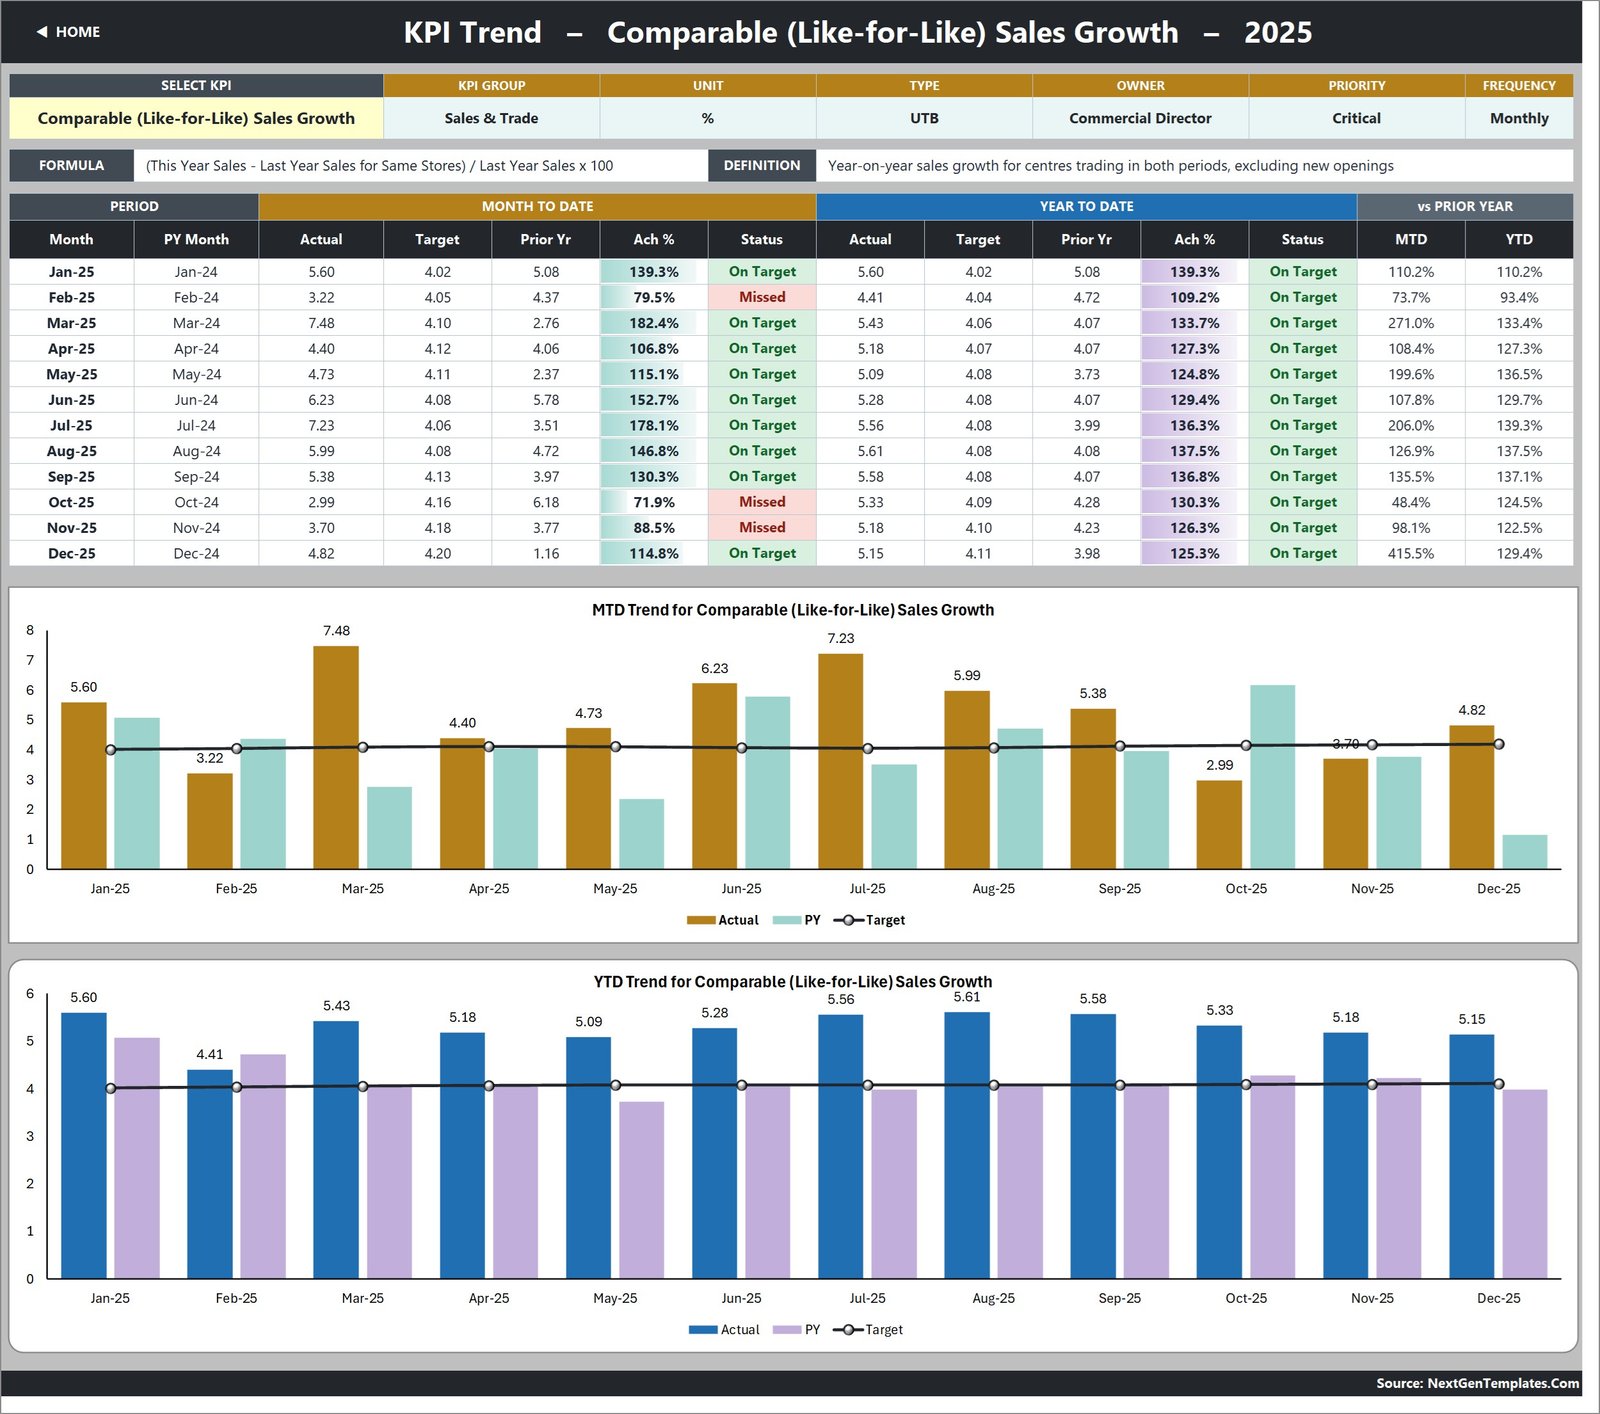
- A trend page per KPI. Cell B4 on KPI Trend lists every KPI name. Its attribute strip, its formula and definition, its twelve-month table and both combo charts – actual and prior-year columns with a target line – all redraw from that one cell.
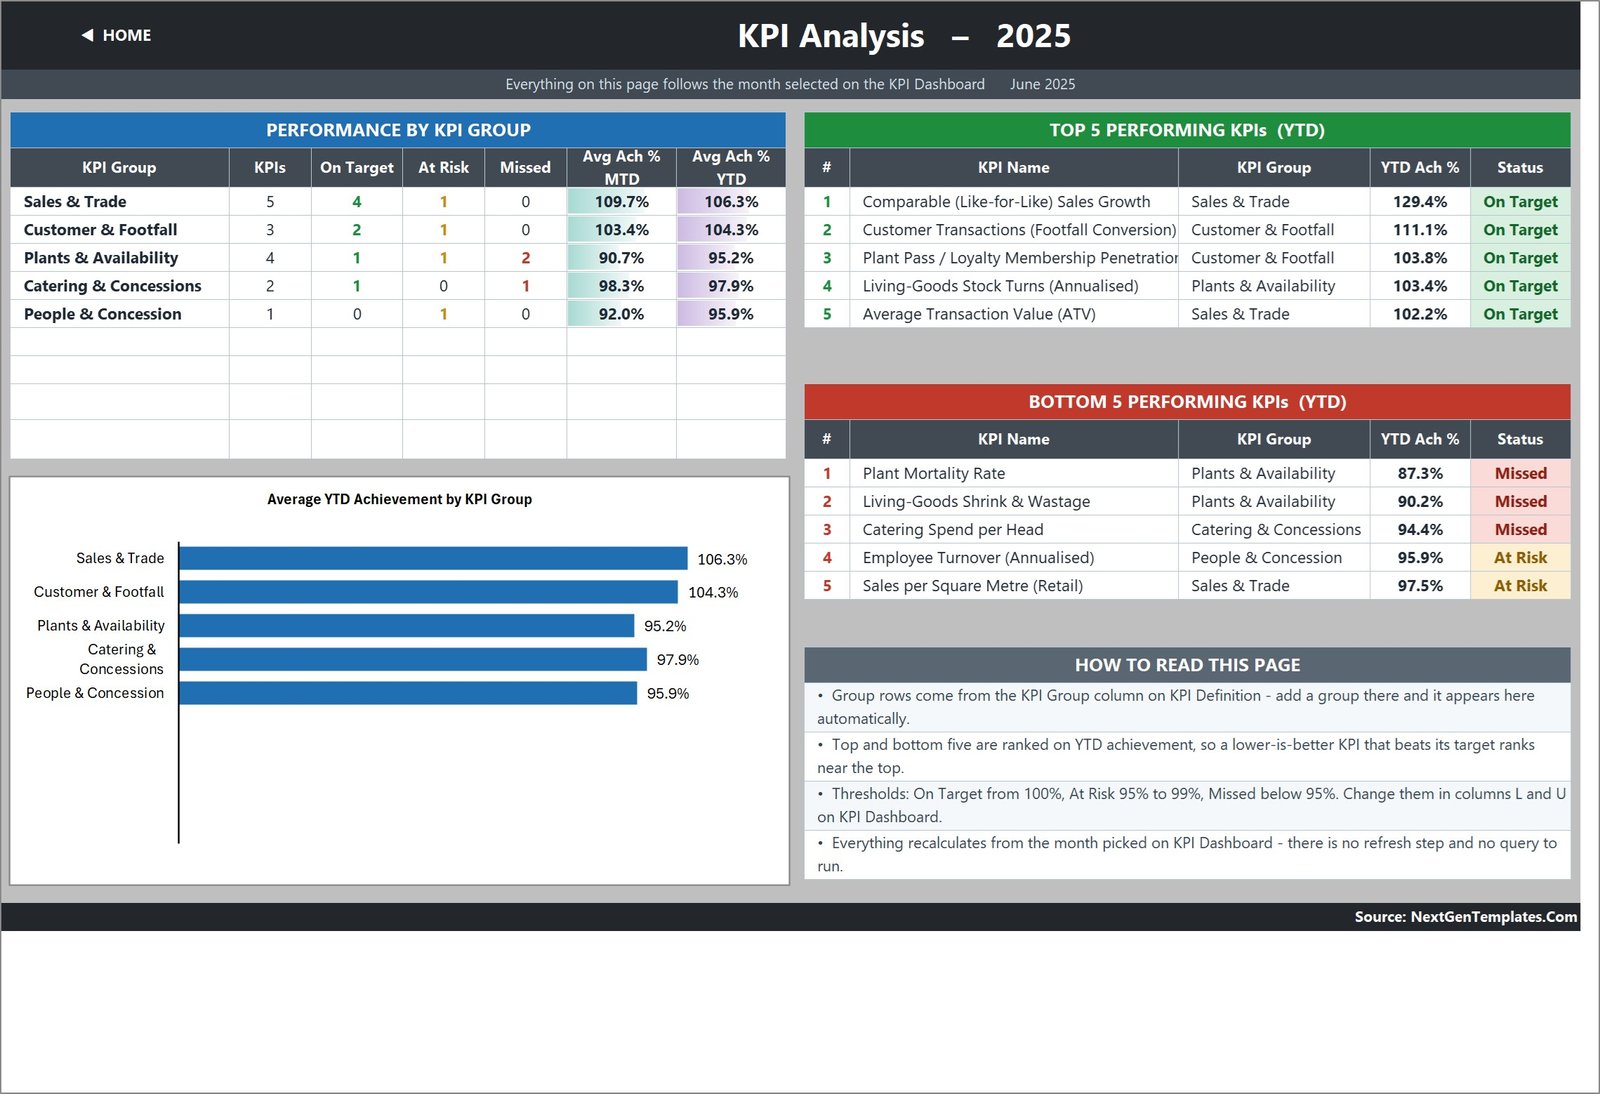
- A group roll-up and a ranking page. KPI Analysis rolls achievement up by KPI group with a bar chart and ranks the top five and bottom five KPIs for the year to date.
- Add or rename KPIs without touching a formula. The sheets are wired for 22 KPI rows. Type a new KPI on KPI Definition and it flows straight through the three input sheets, the scorecard, the trend page and the analysis page.
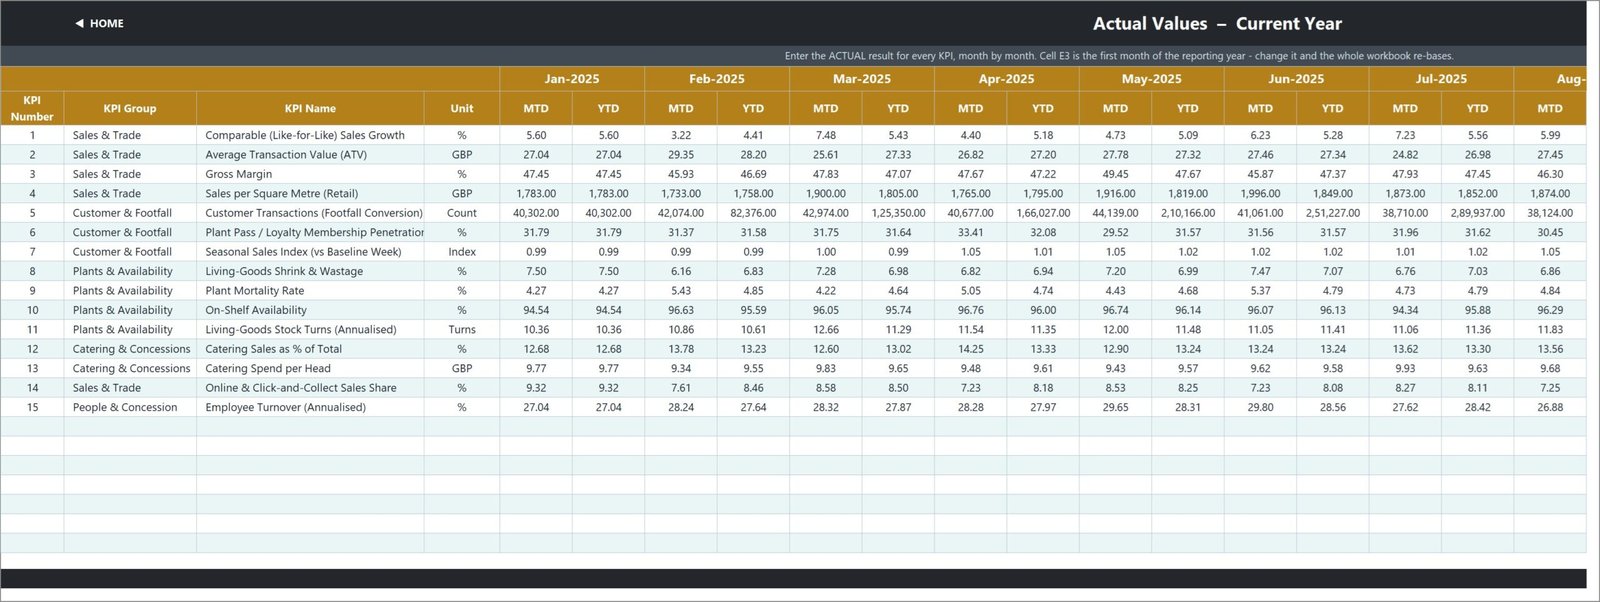
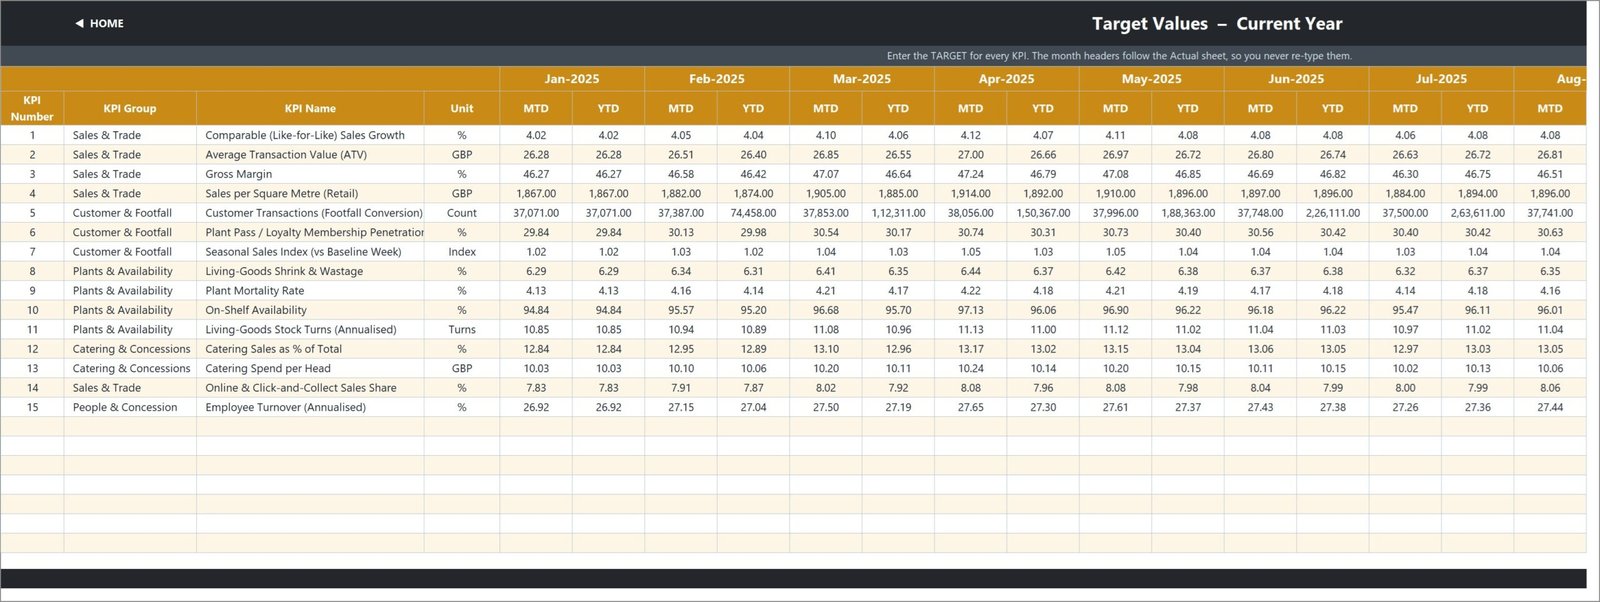
- Re-base the year in one cell. Cell E3 on KPI Input – Actual is the first month of the reporting year. Change it and the Target sheet, the Prior Year sheet, the month dropdown and every sheet title re-base themselves.
- Nothing is locked or hidden. Every formula is readable, traceable and yours to extend.
What’s Inside the Garden Centers KPI Dashboard in Excel
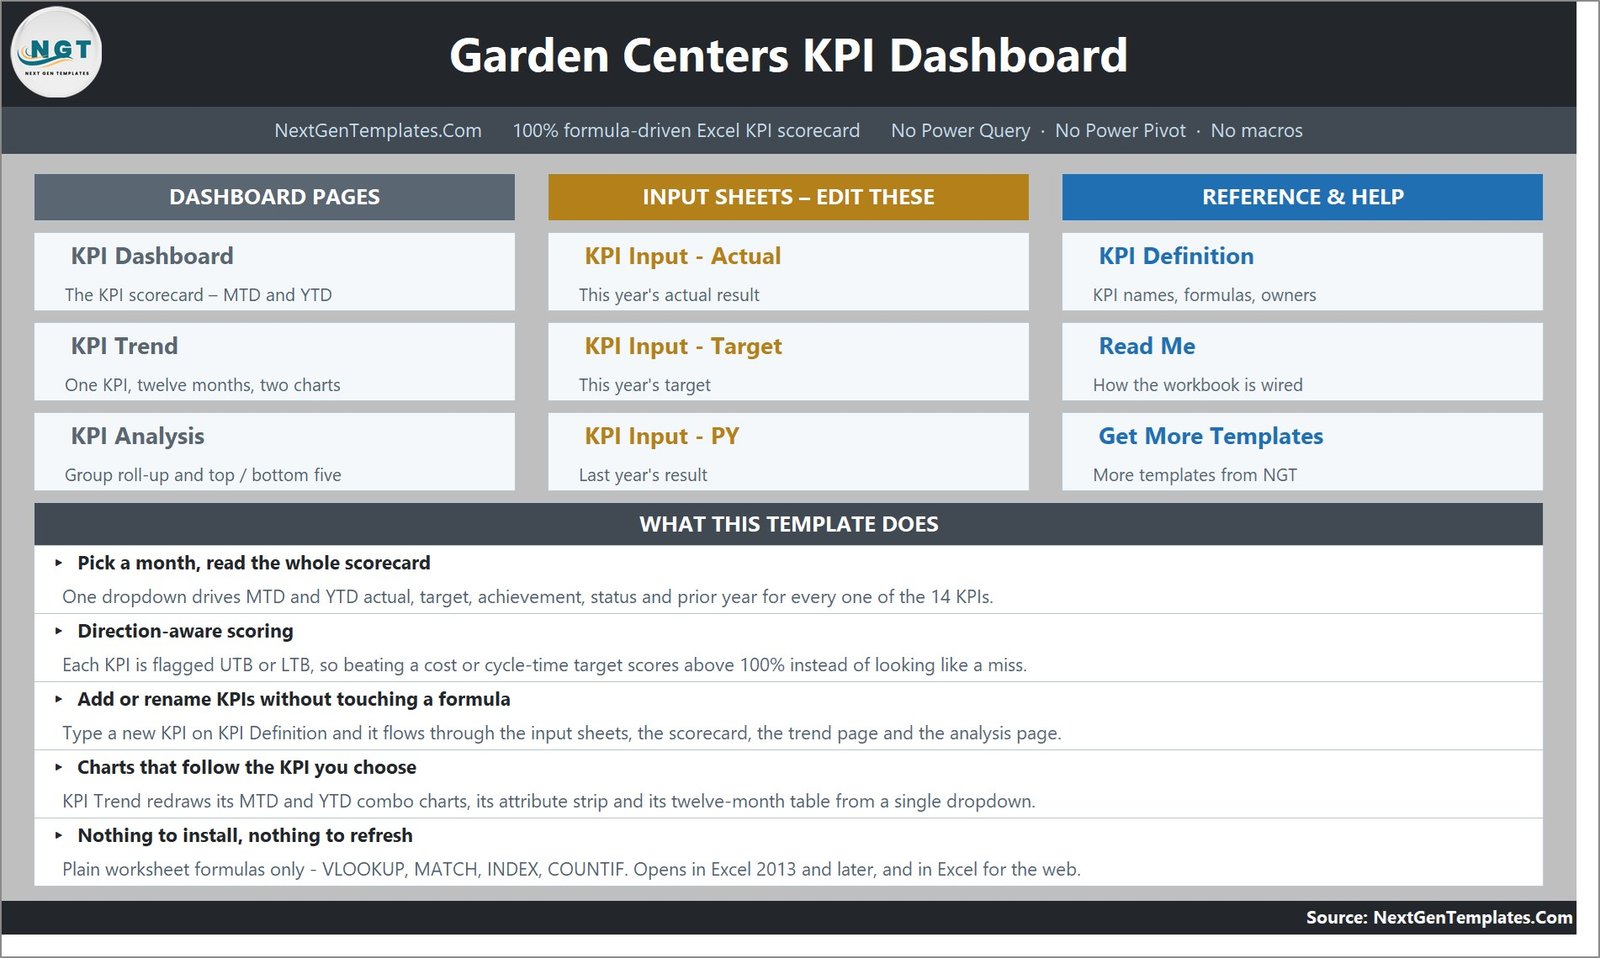
Ten pages you work in, plus a Support sheet holding the helper calculations that nothing else needs you to touch.
- Home – a navigation page with tiles for the dashboard pages, the input sheets and the reference sheets.
- KPI Dashboard – the scorecard. Month dropdown, seven summary cards and one row per KPI with MTD and YTD actual, target, achievement, status, prior year and vs PY.
- KPI Trend – one KPI at a time, twelve months, an MTD combo chart and a YTD combo chart.
- KPI Analysis – performance by KPI group, an Average YTD Achievement by KPI Group bar chart, and Top 5 / Bottom 5 Performing KPIs for the year to date.
- KPI Input – Actual – this year’s result, MTD and YTD, for every KPI and every month.
- KPI Input – Target – this year’s target, on the same grid, with month headers that follow the Actual sheet.
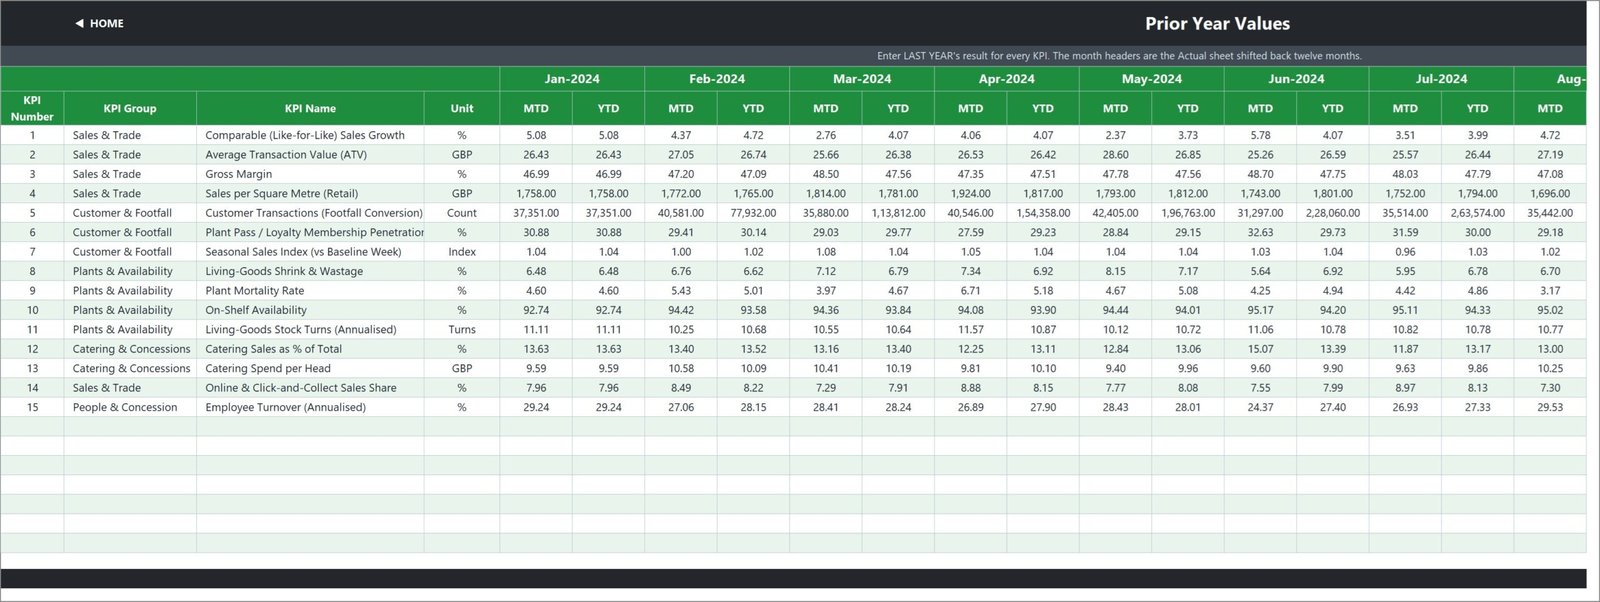
- KPI Input – PY – last year’s result, on the same grid, shifted back twelve months.
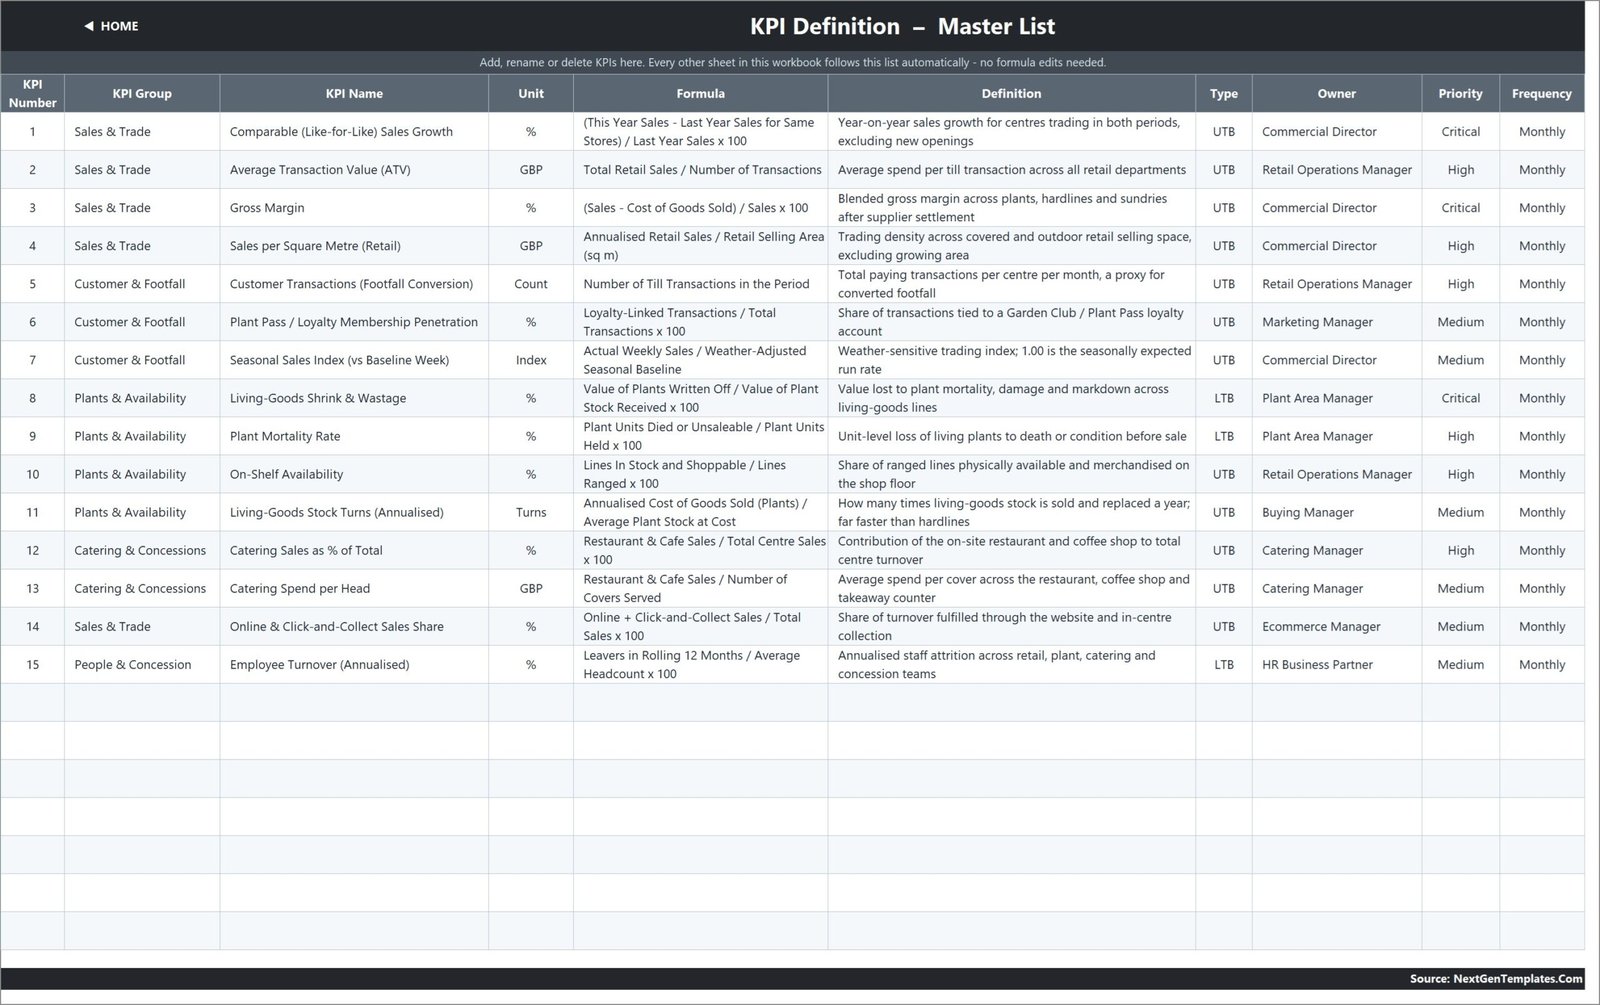
- KPI Definition – the master list: number, group, name, unit, formula, definition, type, owner, priority and frequency. Every other sheet follows it.
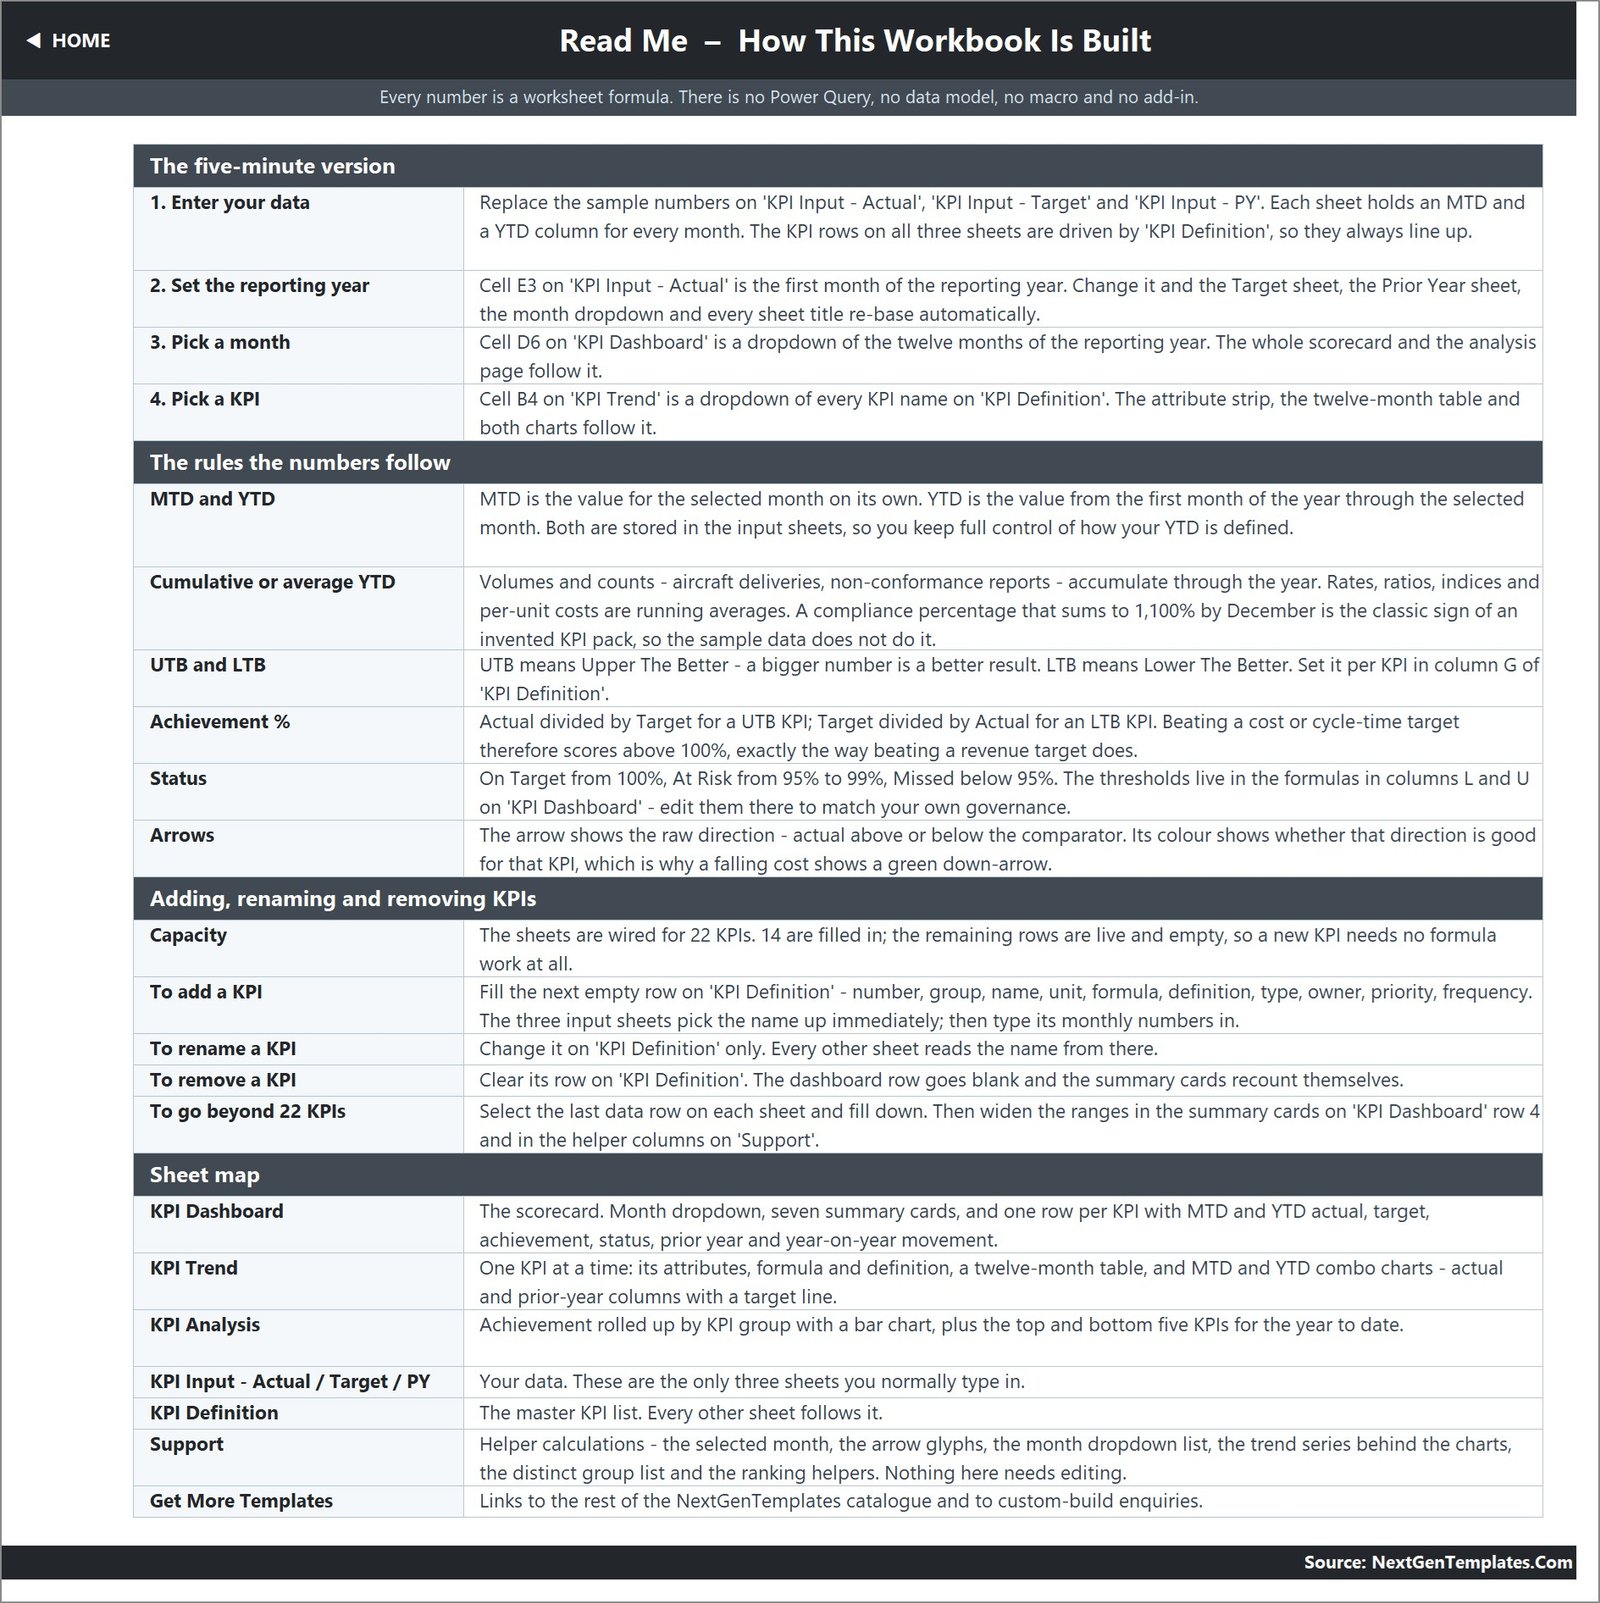
- Read Me – how the workbook is wired, in one page.
- Get More Templates – links to the rest of the NextGenTemplates catalogue.
The 15 KPIs, as shipped: Comparable (Like-for-Like) Sales Growth, Average Transaction Value (ATV), Gross Margin, Sales per Square Metre (Retail), Customer Transactions (Footfall Conversion), Plant Pass / Loyalty Membership Penetration, Seasonal Sales Index (vs Baseline Week), Living-Goods Shrink & Wastage, Plant Mortality Rate, On-Shelf Availability, Living-Goods Stock Turns (Annualised), Catering Sales as % of Total, Catering Spend per Head, Online & Click-and-Collect Sales Share, and Employee Turnover (Annualised). Each one carries its own formula, plain-English definition and named owner on KPI Definition.
Two things to know before you buy. First, this is a scorecard: you type the MTD and the YTD figure for each KPI on the three input sheets, and the workbook does the comparison, the scoring, the ranking and the charting. It does not read your till system and it does not derive YTD from MTD – that is deliberate, because a garden centre’s YTD for a rate is an average and its YTD for a count is a running total, and you keep control of which. Second, the sample data is a British garden-centre chain: currency shows as GBP, and the KPI names use British spelling (Metre, Annualised). Both are ordinary cell formats and labels you can change in a minute.
Garden Centers KPI Dashboard vs. Google Sheets vs. Retail BI Software – Where This Fits
| This Excel KPI Dashboard | A Google Sheets KPI build | Retail BI / ERP analytics (NetSuite, Zoho Analytics) | |
|---|---|---|---|
| Cost | 19.99 one-off (12.99 on offer) | Free tool, your build time | From roughly 80-200 per user per month |
| Platform | Excel 2013+ desktop and Excel for the web | Browser | Vendor cloud |
| Setup time | Minutes – replace the sample numbers | Days to build the same logic | Weeks, usually with an implementation partner |
| Real-time team collaboration | Via OneDrive / SharePoint co-authoring | Yes, natively | Yes |
| Mobile access | Excel mobile app | Browser and app | Vendor app |
| Customisable KPIs and fields | Fully – 22 KPI rows wired, 15 filled | Fully, if you build it | Within the vendor’s data model |
| Share with a link | Via OneDrive share | Yes | Yes, per licensed user |
| Year-1 cost at 5 users | 19.99 total | Your build time | Roughly 4,800-12,000 |
| Direction-aware (UTB / LTB) scoring | Built in per KPI | You write it yourself | Usually configurable |
| You own the file offline | Yes – nothing is locked or hidden | Lives in the account | No, access ends with the licence |
Who This Template Is For – and Who It’s Not For
It is for independent garden centres and small multi-site chains that already pull numbers out of a till system, a stock system and a payroll report each month and need one page that scores them. It suits a commercial director who wants like-for-like growth, gross margin and trading density beside plant mortality and on-shelf availability; a plant area manager who is judged on shrink and wastage; a catering manager who reports spend per head; and an owner-operator who wants a board page that takes ten minutes to update.
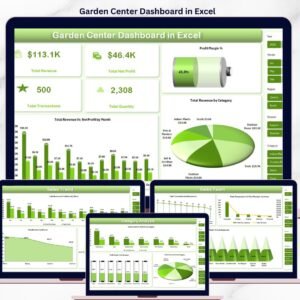
It is not for you if you want the numbers to arrive on their own. There is no till or EPOS connector, no Power Query refresh and no macro – you type or paste the monthly figures. It is also not a transaction database: there is no product-level, customer-level or SKU-level table anywhere in the workbook, so if you need basket analysis or line-item stock reporting you want an analytics dashboard instead of a scorecard. And if you would rather chart sales by category, region and month than score KPIs against target, the analytical Garden Center Dashboard in Excel is the better fit – it is a different template, not a newer version of this one.
How to Use the Garden Centers KPI Dashboard in Excel
- Open the workbook and look at Home. The tiles show which sheets you edit (the three KPI Input sheets) and which are read-only output.
- Set your reporting year. Type the first month of your year in cell E3 on KPI Input – Actual. Every other sheet re-bases itself.
- Edit the KPI list. On KPI Definition, rename what you do not measure, clear what you do not want and add your own in the empty rows. Set each one’s unit and its UTB / LTB type.
- Type your numbers. Replace the sample MTD and YTD values on KPI Input – Actual, KPI Input – Target and KPI Input – PY. The KPI rows on all three sheets already follow KPI Definition, so they stay in step.
- Pick a month. Back on KPI Dashboard, choose the month in D6. The scorecard, the cards and KPI Analysis all update instantly.
- Work the exceptions. Read the Bottom 5 on KPI Analysis, then open KPI Trend, pick that KPI in B4 and see whether it is a bad month or a bad year.
- Adjust the thresholds if you need to. On Target, At Risk and Missed are set in the formulas in columns L and U on KPI Dashboard.
Real-World Use Cases
Ruth, commercial director of a four-site garden centre group. Month end lands on the third working day. She pastes till and stock figures into the three input sheets, sets D6 to the closed month, and the board pack page is done: like-for-like growth at 152.7% of target for the month, gross margin at 98.2% and flagged At Risk, and Sales per Square Metre slipping to 97.5% for the year. She takes a screenshot of the scorecard and one KPI Trend chart, and that is the meeting.
Marcus, plant area manager. He owns two of the workbook’s KPIs – Living-Goods Shrink & Wastage and Plant Mortality Rate – and both are LTB. Because achievement is Target / Actual for an LTB KPI, a mortality rate of 5.37% against a 4.17% target scores 77.7% and shows Missed rather than a misleading 129%. He uses KPI Trend to prove that the summer spike is seasonal and not a handling problem.
Priya, owner of a single independent centre with a coffee shop. She deletes the KPIs she does not measure, keeps eleven, and adds two of her own on KPI Definition – covers served and average dwell time – without writing a formula. Catering Sales as % of Total and Catering Spend per Head tell her whether the coffee shop is earning its floor space.
Frequently Asked Questions
Does it connect to my EPOS or stock system?
No. This is a typed scorecard by design. You enter the monthly MTD and YTD figures for each KPI on the three input sheets and the workbook handles the comparison, the scoring, the ranking and the charts. There is no query, no connector and no refresh step – which is also why it opens on any machine with Excel and never asks to enable anything.
Does it work out YTD for me?
No, and that is deliberate. Both MTD and YTD are stored on the input sheets so you keep control of the definition: counts and volumes accumulate through the year, while rates, ratios, indices and per-unit values are running averages. A percentage that sums to 1,100% by December is the classic sign of a KPI pack that got this wrong.
How many KPIs does it really ship with?
Fifteen. Everything that calculates – the scorecard, the summary cards, KPI Definition, the analysis page – carries 15. The caption on the Home page and one line in Read Me still say 14 from an earlier revision of this template family; it is a label, not a formula, and nothing in the workbook depends on it. The sheets are wired for 22 KPI rows in total, so there are seven live empty rows waiting for yours.
Why do some large numbers group as 2,51,227.00?
The sample workbook was saved with an Indian digit-grouping number format on the larger figures. It is cosmetic – select the cells, apply your own number format, and the values and every formula are unaffected.
Can I change the currency and the British spellings?
Yes. The sample chain trades in GBP, so currency KPIs are formatted in pounds and names read Sales per Square Metre and Annualised. Re-format the cells for your currency and rename anything you like on KPI Definition – every other sheet reads the name from there.
Which Excel versions does it open in?
Excel 2013 and later on Windows and Mac, and Excel for the web. It uses VLOOKUP, MATCH, INDEX and COUNTIF only – no dynamic arrays, no LET, no add-ins – so nothing breaks on an older build.
What exactly do I download?
A ZIP containing the .xlsx workbook, complete with twelve months of sample data, and the Excel KPI Dashboard user manual as a PDF. Instant download after checkout, and the file is yours to keep and modify.
About the Author
Built by PK – Microsoft Certified Professional with 15+ years of Excel, Google Sheets, and Power BI experience. Founder of NextGenTemplates, reaching 300K+ subscribers across YouTube channels. Every template is hand-built and tested before release.
Explore Related Templates
- Garden Center Dashboard in Excel – the analytical companion: sales by category, region and month rather than KPI scoring.
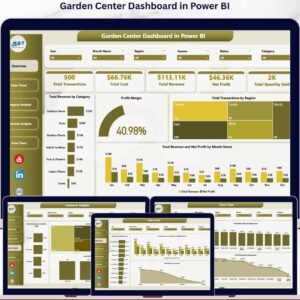
- Garden Center Dashboard in Power BI – the same analysis as a .pbix report.
- Plant Nurseries Dashboard in Excel – for the growing side of the business.
- Harvest Record Data Entry System in Excel – a VBA form for capturing the underlying records.
- DIY Home Improvement Stores KPI Dashboard in Excel – the same scorecard engine for an adjacent retail sector.
- Browse every KPI Dashboard or the full MS Excel catalogue.
Get the Garden Centers KPI Dashboard in Excel for 12.99 (regular 19.99). Instant download, sample data included, nothing locked, lifetime access to the file. Need a different KPI set, your own branding or a Google Sheets version? Email [email protected] and we will build the scorecard around the KPIs that matter to you.
Last updated: 26 August 2026.































Reviews
There are no reviews yet.