



Running a home décor store is about much more than selling stylish furniture, lighting, and accessories. Home Decor Stores KPI Dashboard in Excel Behind every successful store lies strong control over sales, margins, inventory movement, customer behavior, and operational efficiency. However, when performance data is scattered across multiple Excel files, decision-making becomes slow, confusing, and error prone.
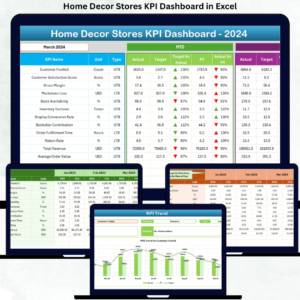
The Home Decor Stores KPI Dashboard in Excel is designed to solve this challenge completely. Home Decor Stores KPI Dashboard in Excel It brings all critical retail KPIs into one structured, interactive, and easy-to-use Excel dashboard. With automated calculations, dynamic month selection, trend analysis, and visual performance indicators, store owners and managers gain instant clarity on how their business is performing—without advanced tools or technical skills. 🚀
Built entirely in Microsoft Excel, this dashboard remains affordable, flexible, and powerful. Whether you manage a single home décor store or multiple locations, this dashboard becomes your central performance monitoring system.
Key Features of the Home Decor Stores KPI Dashboard in Excel ✨
This dashboard is carefully designed to support real-world retail decision-making:
✨ 7 Smartly Designed Worksheets – Home, Dashboard, KPI Trend, Actual Input, Target, Previous Year & KPI Definition
📊 Dynamic Dashboard Page – Track MTD & YTD performance with visual indicators
📅 Month Selection Drop-Down – Change reporting month instantly
📈 Trend Analysis Charts – Identify growth, decline, and seasonality
🔄 Target vs Actual Comparison – Spot gaps using up/down arrows (▲ ▼)
📉 Previous Year Benchmarking – Measure real year-over-year improvement
📘 Clear KPI Definitions & Formulas – Avoid confusion across teams
🧮 Excel-Based Data Entry – No external software or subscriptions needed
This dashboard transforms raw retail data into actionable insights.
What’s Inside the Home Decor Stores KPI Dashboard in Excel 📂
You receive a complete KPI tracking framework with the following worksheets:
📌 Home Sheet

Acts as the index page with 6 navigation buttons for one-click access to all major sheets.
📌 Dashboard Sheet
The main performance page showing:
Month selection (cell D3)
MTD Actual, Target & Previous Year
YTD Actual, Target & Previous Year
Target vs Actual and CY vs PY percentages
Conditional formatting arrows for quick insights
📌 KPI Trend Sheet
Provides deeper analysis with:
KPI selection dropdown
KPI Group, Unit, Formula & Definition
MTD Trend chart (Actual, Target, PY)
YTD Trend chart (Actual, Target, PY)
📌 Actual Numbers Input Sheet
Used to enter monthly MTD and YTD actual values in a structured format.
📌 Target Sheet
Stores KPI-wise MTD and YTD targets for performance comparison.
📌 Previous Year Number Sheet
Keeps last year’s MTD and YTD data for accurate growth analysis.
📌 KPI Definition Sheet
Acts as the master reference with KPI Name, Group, Unit, Formula, and Definition.
Together, these sheets create a complete retail performance system.
How to Use the Home Decor Stores KPI Dashboard in Excel 🛠️
The dashboard is extremely easy to use:
1️⃣ Define or update KPIs in the KPI Definition sheet
2️⃣ Enter actual values in the Actual Numbers Input sheet
3️⃣ Update targets in the Target sheet
4️⃣ Maintain last year’s data in the Previous Year sheet
5️⃣ Select the month from the Dashboard drop-down
6️⃣ Review MTD & YTD performance instantly
7️⃣ Use trend charts to plan future actions
No macros. No coding. Just clean Excel analytics. ⚡
Who Can Benefit from This Home Decor Stores KPI Dashboard? 👥
This dashboard is ideal for anyone involved in home décor retail operations:
🏡 Home Décor Store Owners – Monitor overall business health
📊 Store Managers – Track sales, inventory & customer KPIs
📈 Retail Analysts – Analyze trends and performance gaps
🧮 Sales & Operations Teams – Align actions with targets
🏢 Franchise Managers – Maintain consistency across stores
If you want clarity, control, and better retail decisions—this dashboard is a must-have.
Click here to read the Detailed blog post
Visit our YouTube channel to learn step-by-step video tutorials
Watch the step-by-step video tutorial:
Compatibility and Requirements
- Works in Microsoft Excel desktop (Excel 2016 or later, or Microsoft 365).
- You pick the reporting month and the KPI from dropdown lists, and the trend charts follow your selection. Microsoft explains this in Create a drop-down list.
Frequently Asked Questions
Which worksheets are included?
Seven worksheets: Home, Dashboard, KPI Trend, Actual Numbers Input, Target, Previous Year Number and KPI Definition.
How do I change the reporting month?
Select the month from the dropdown in cell D3 on the Dashboard sheet. The MTD and YTD figures update for that month.
Where do I enter my numbers?
Enter monthly MTD and YTD actuals in the Actual Numbers Input sheet, targets in the Target sheet and last year’s figures in the Previous Year Number sheet.
Can I see the trend for a single KPI?
Yes. Open the KPI Trend sheet and choose a KPI from the dropdown. It shows the KPI group, unit, formula and definition, with MTD and YTD charts for Actual, Target and Previous Year.
Is there a Power BI version?
Yes. See the Home Decor Stores KPI Dashboard in Power BI.
Related Retail Dashboard Templates
- Home Decor Stores KPI Dashboard in Power BI: the same KPIs as a Power BI report
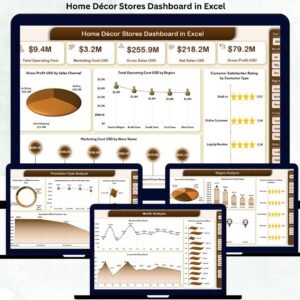
- Home Décor Stores Dashboard in Excel: another dashboard for home décor stores in Excel
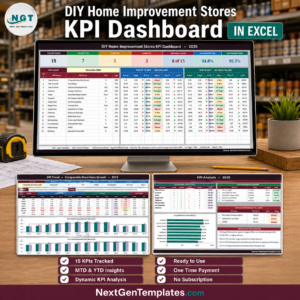
- DIY Home Improvement Stores KPI Dashboard in Excel: a KPI dashboard for a related store type
- Inventory Management Template for Store: track stock levels for your store
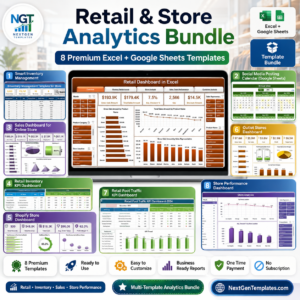
- Retail & Store Analytics Bundle: 8 retail templates in one download
Browse all Excel KPI dashboards.





















Reviews
There are no reviews yet.