

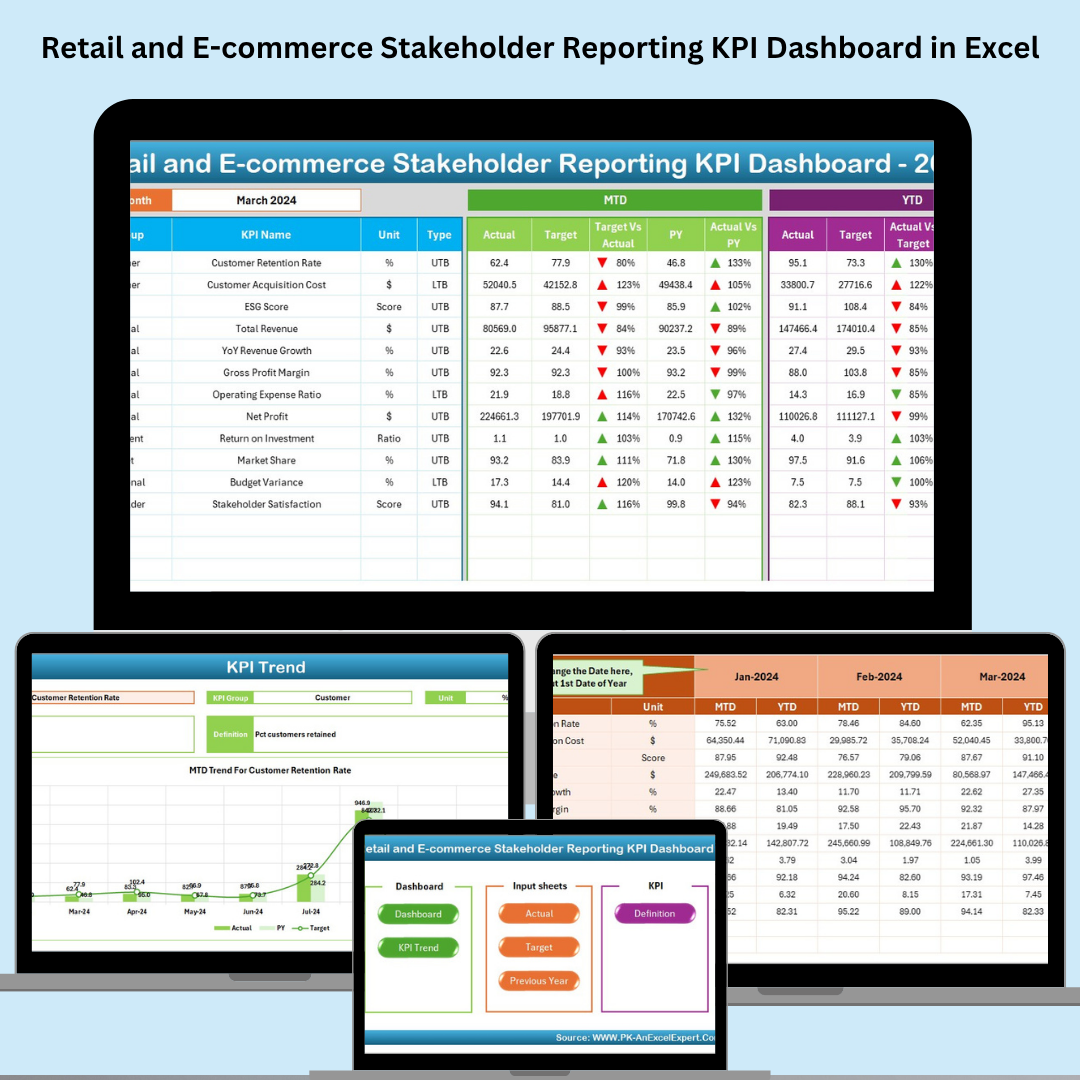
In today’s competitive landscape, retail and e-commerce businesses need to deliver fast, accurate, and insightful reporting to internal and external stakeholders. The Retail and E-commerce Stakeholder Reporting KPI Dashboard in Excel is a fully dynamic, ready-to-use reporting system that empowers decision-makers with real-time visibility into key performance indicators across sales, marketing, inventory, and customer engagement.
This Excel-based dashboard template simplifies complex data into easy-to-understand visuals, enabling faster decision-making and better strategic alignment across departments.
🧭 What’s Inside the Dashboard?
This dashboard is structured into 7 well-organized Excel worksheet tabs that deliver clarity and depth without the complexity of enterprise BI platforms.
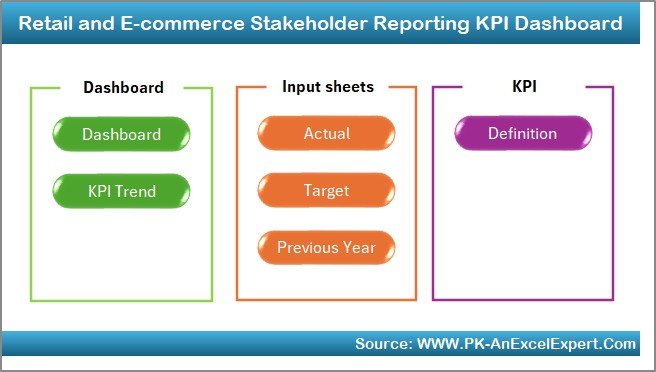
1. Home Sheet
Acts as a navigation hub with 6 clickable buttons
Includes branding space and usage instructions
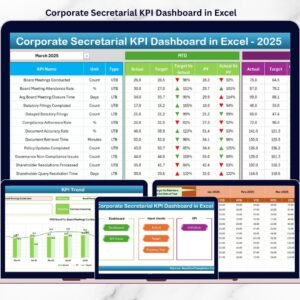
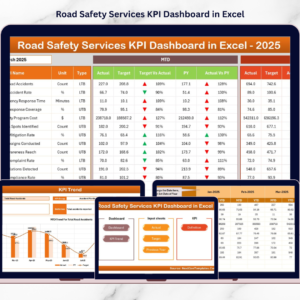
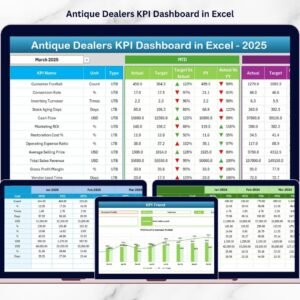
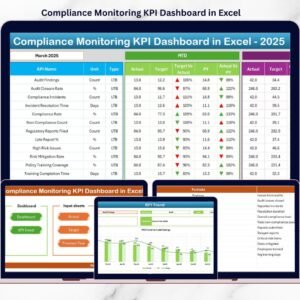
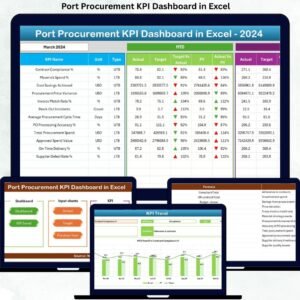
2. Dashboard Sheet
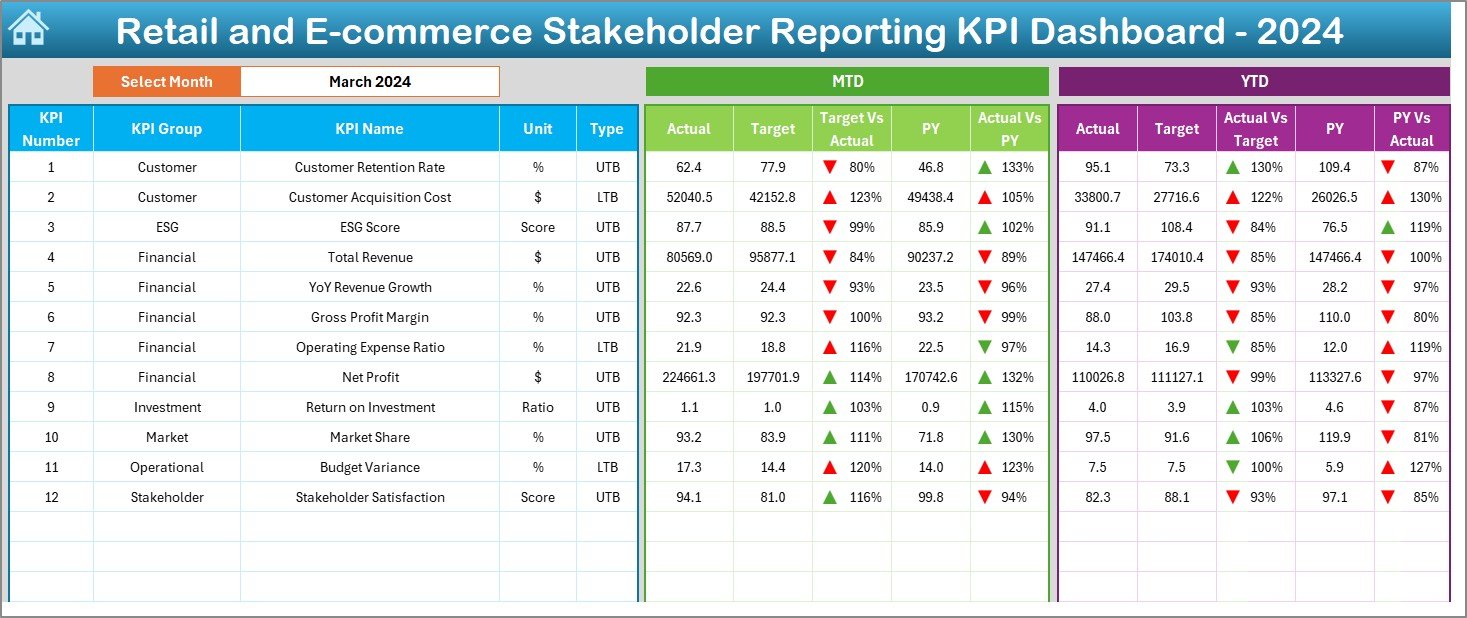
Select any month from a dropdown in cell D3
Automatically updates MTD/YTD KPIs and compares against target and previous year
Includes:
MTD & YTD actual vs. target charts
Conditional formatting with arrows for trend insights
Color-coded comparisons for quick review
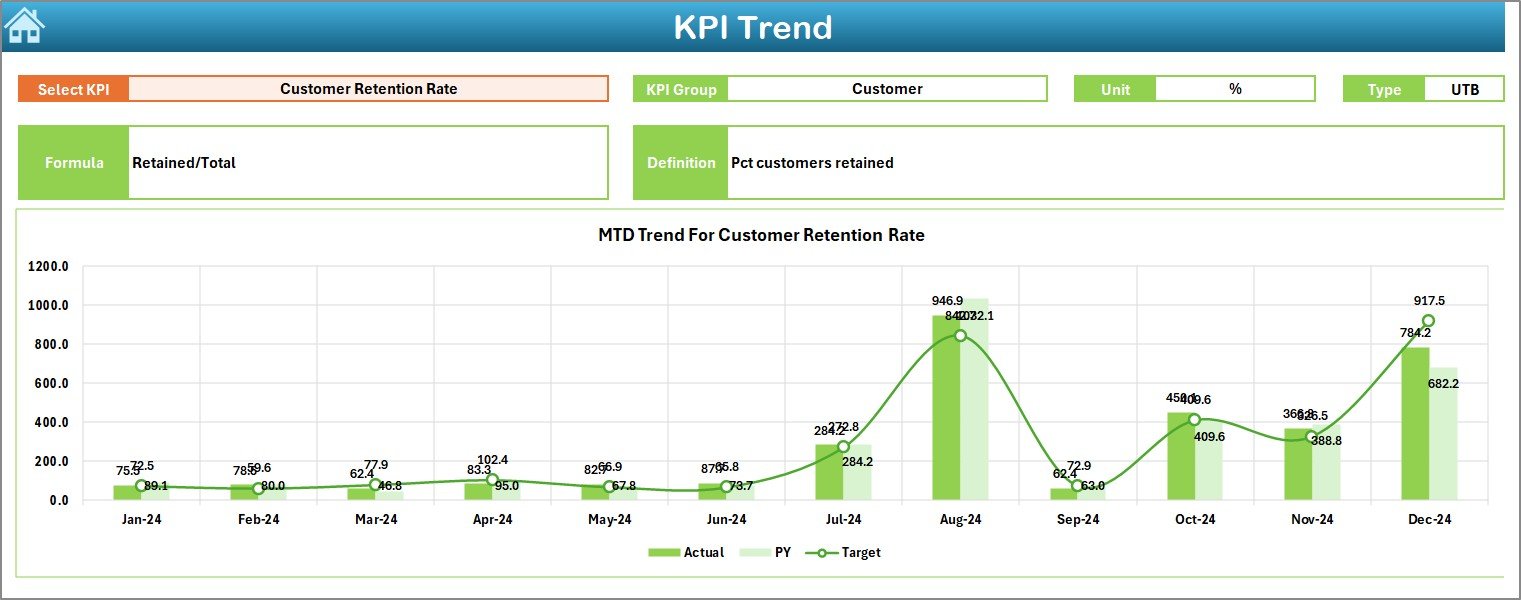
3. KPI Trend Sheet
Select a KPI from the dropdown (cell C3)
Displays:
KPI Group, Unit, Type (UTB or LTB)
Formula and clear definition
Two trend charts: MTD and YTD performance vs target & previous year
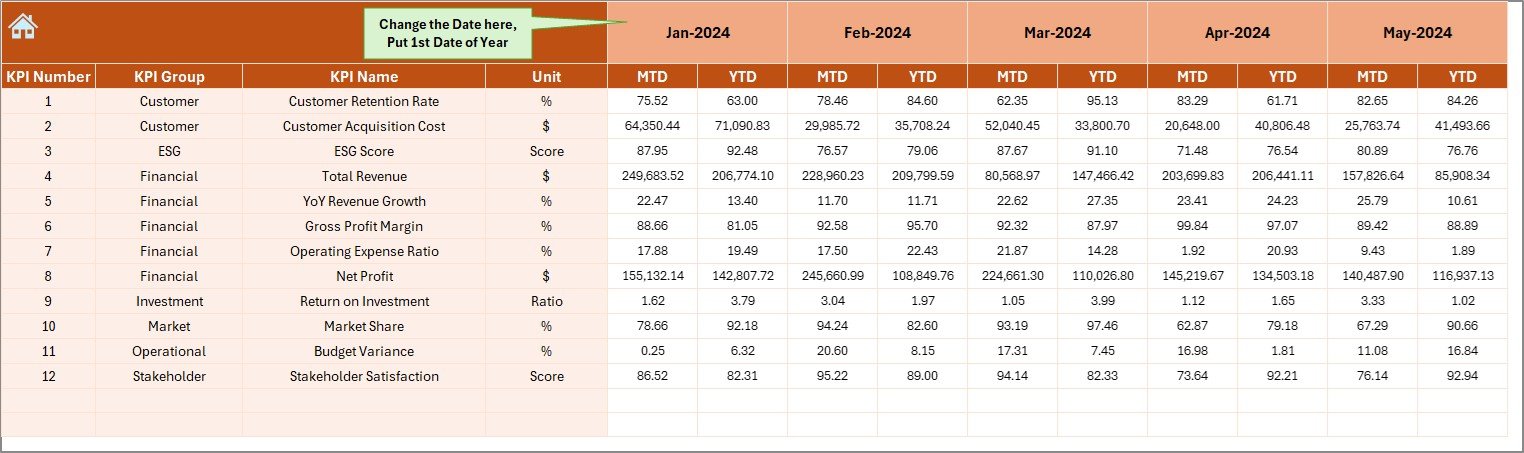
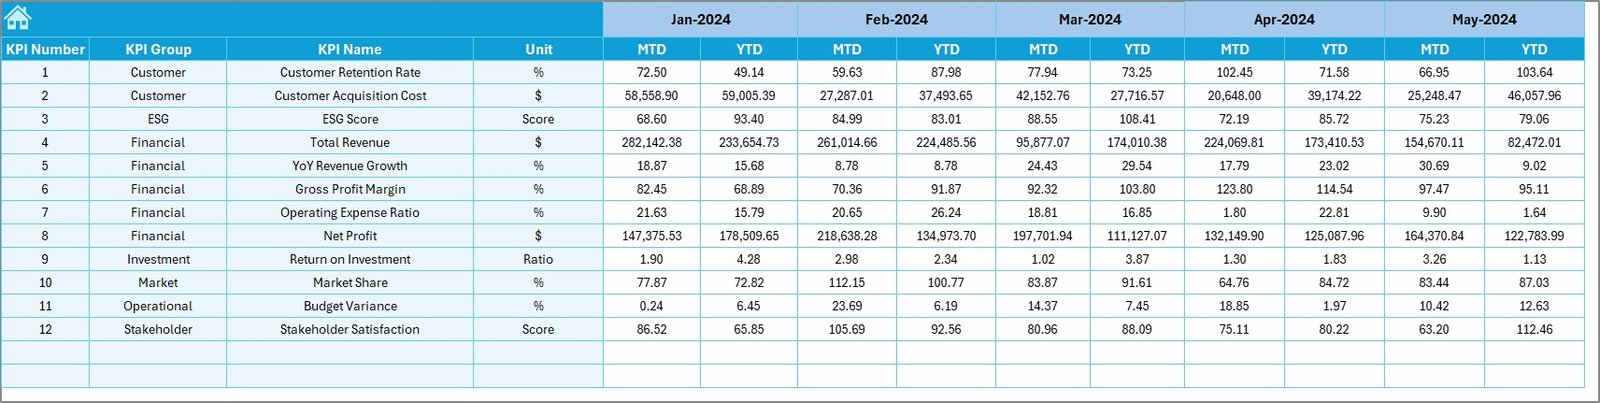
4. Actual Numbers Input Sheet
Fiscal year start is defined in cell E1
Input monthly actuals for MTD/YTD across all KPIs
Error-proof with structured tables and validations
5. Target Sheet
Set monthly targets for each KPI
Used for real-time variance reporting
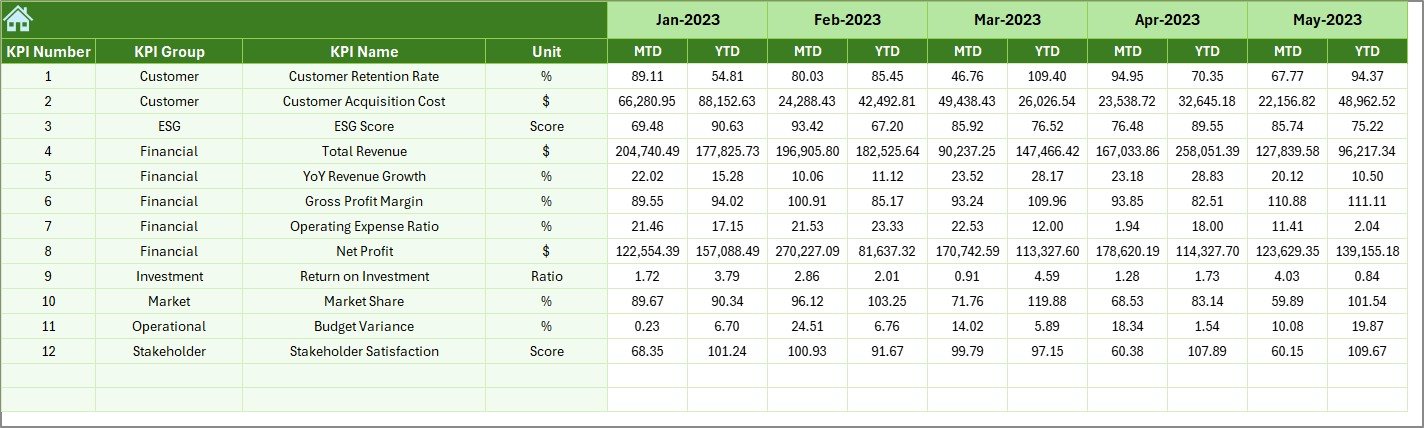
6. Previous Year Number Sheet
Enter prior year values for MTD and YTD comparison
Enables automatic historical benchmarking
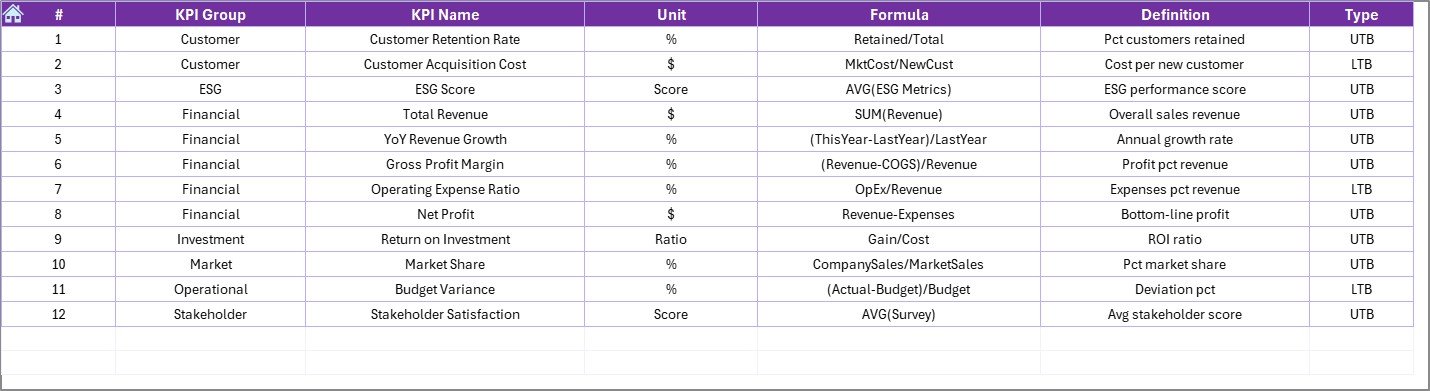
7. KPI Definition Sheet
Document all KPI Names, Groups, Units, Formulas, and Definitions
Ensures alignment across teams and reduces misinterpretation
💡 Key Benefits
✅ Interactive Data Exploration
Slice and dice data using pivot charts and filters — no coding required.
✅ Cost-Effective BI Alternative
No need for expensive software — it runs entirely in Excel.
✅ Quick Setup
Fully structured — simply enter your data, and the visuals are ready.
✅ Customizable
Add or remove KPIs, change visuals, or rebrand with your company colors.
✅ Stakeholder Friendly
Offers clarity, real-time visibility, and confidence in decision-making.
🚀 Use Cases
Executive performance reporting
Weekly retail team check-ins
E-commerce marketing ROI tracking
Inventory and logistics reviews
Board-level strategic updates
🛠️ Best Practices
Automate data connections via Power Query or macros
Lock non-editable sheets to preserve integrity
Review KPIs quarterly to ensure relevance
Use clear naming conventions (e.g., tblActual, tblTargets)
Enable version control and changelog documentation
🎓 Who Can Use This?
👨💼 Business Analysts – to deliver stakeholder-ready insights
🧑💻 Retail Managers – to track daily/weekly store or channel metrics
📈 Marketing Teams – to analyze campaign conversions and engagement
💼 Executives – to make data-backed strategic decisions
📦 Inventory Controllers – to monitor stock movement and fulfillment
Whether you’re a startup scaling your store or a mid-size retail chain optimizing performance, this Excel-based dashboard provides everything you need — all without leaving your spreadsheet environment.







Reviews
There are no reviews yet.