


The duty-free retail business runs in a highly dynamic and location-driven environment. Sales depend heavily on passenger traffic, seasonal demand, promotions, and product mix. Duty-Free Retail KPI Dashboard in Excel When sales and performance data are scattered across multiple spreadsheets, retailers struggle to track targets, identify gaps, and react quickly. As a result, opportunities are missed and profitability suffers.
Duty-Free Retail KPI Dashboard in Excel That is exactly why the Duty-Free Retail KPI Dashboard in Excel is designed—to give duty-free retailers a single, powerful, and easy-to-use performance control system.
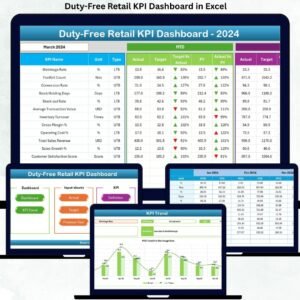
Duty-Free Retail KPI Dashboard in Excel This ready-to-use Excel dashboard transforms complex retail data into clear, visual, and actionable insights. Instead of manually preparing reports every month, users can instantly track MTD and YTD performance, compare Actual vs Target, analyze Previous Year trends, and identify underperforming KPIs with visual indicators. Best of all, everything runs entirely in Excel—no expensive BI tools or technical setup required.
Duty-Free Retail KPI Dashboard in Excel Whether you manage one duty-free store or oversee multiple airport locations, this dashboard helps you move from guesswork to data-driven retail decision-making.
🚀 Key Features of Duty-Free Retail KPI Dashboard in Excel
📊 Centralized Retail KPI Tracking – Monitor all key duty-free KPIs from one Excel dashboard
📅 Dynamic Month Selector – Change the month and update the entire dashboard instantly
🎯 MTD & YTD Performance View – Track short-term results and long-term progress together
📈 Target vs Actual Analysis – Instantly spot gaps and achievements
📉 Previous Year Comparison – Understand growth and decline trends clearly
🔼 Visual Performance Indicators – Green ▲ and Red ▼ arrows for quick insights
📊 Dedicated KPI Trend Analysis – Analyze performance movement over time
📘 Clear KPI Definitions – View KPI formula, unit, and logic in one place
⚙️ 100% Excel-Based Solution – Easy to maintain, customize, and share
📦 What’s Inside the Duty-Free Retail KPI Dashboard in Excel

📁 Excel Dashboard File with 7 structured worksheets
🏠 Home Sheet with navigation buttons for easy movement
📊 Main Dashboard Sheet showing complete MTD & YTD performance
📈 KPI Trend Sheet with dynamic trend charts and KPI details
🧾 Actual Numbers Input Sheet for entering real performance data
🎯 Target Sheet for defining monthly and yearly benchmarks
📆 Previous Year Data Sheet for year-over-year comparison
📘 KPI Definition Sheet with KPI group, unit, formula, and definition
Everything is pre-designed and ready to use—just enter your data.
🛠️ How to Use the Duty-Free Retail KPI Dashboard in Excel
1️⃣ Enter Actual performance data in the Actual Numbers Input Sheet
2️⃣ Enter Target values in the Target Sheet
3️⃣ Enter Previous Year data in the Previous Year Sheet
4️⃣ Maintain KPI logic in the KPI Definition Sheet
5️⃣ Select the Month from the drop-down
6️⃣ Analyze performance instantly on the Dashboard and Trend sheets
No advanced Excel knowledge is required—basic Excel skills are enough.
👥 Who Can Benefit from This Duty-Free Retail KPI Dashboard in Excel
🏬 Duty-Free Store Managers – Track sales and performance with clarity
📊 Retail Operations Teams – Monitor KPIs and operational efficiency
🛍️ Sales & Category Managers – Identify underperforming products early
💼 Finance & Performance Analysts – Reduce manual reporting effort
✈️ Airport Retail Management – Gain structured performance visibility
🏢 Business Owners – Make confident, data-driven retail decisions
🔗 Click here to read the Detailed Blog Post
🎥 Visit our YouTube Channel to learn step-by-step video tutorials


Reviews
There are no reviews yet.