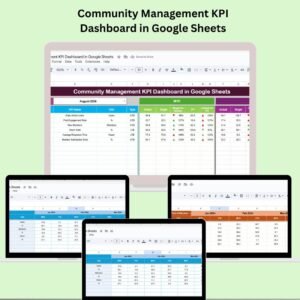
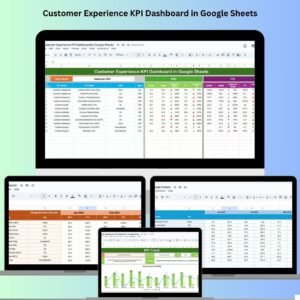
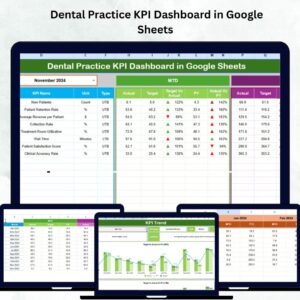
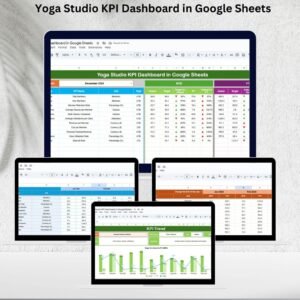
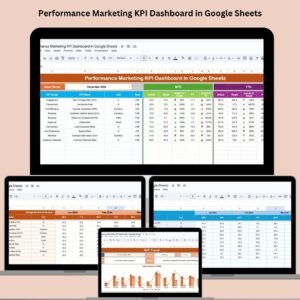
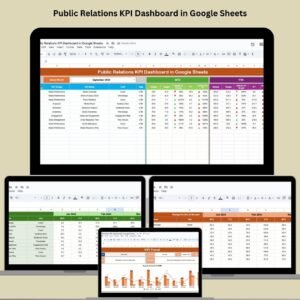
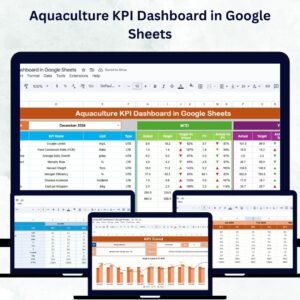
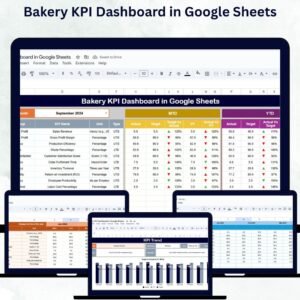
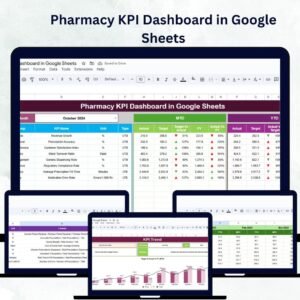
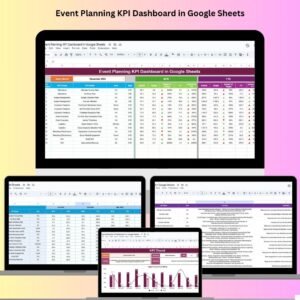
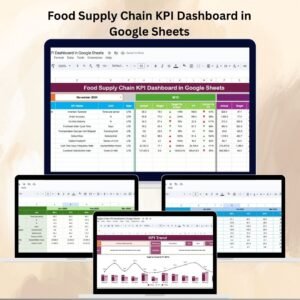
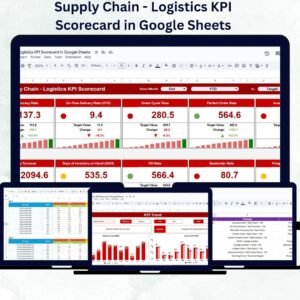
In the world of microfinance, every number tells a story—of impact, growth, and sustainability. The Microfinance KPI Dashboard in Google Sheets is a powerful, ready-to-use tool that empowers Microfinance Institutions (MFIs) to monitor critical performance metrics with ease. Whether you are tracking client growth, loan performance, or financial sustainability, this dashboard brings clarity to your operations through real-time data insights.
Built in Google Sheets for simplicity and accessibility, this dashboard enables finance leaders and teams to make smart, data-driven decisions that promote operational efficiency and financial health.

⚙️ Key Features of the Microfinance KPI Dashboard
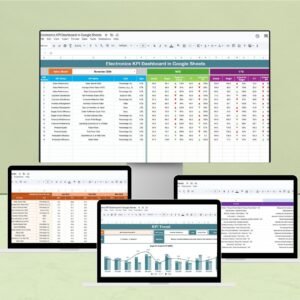
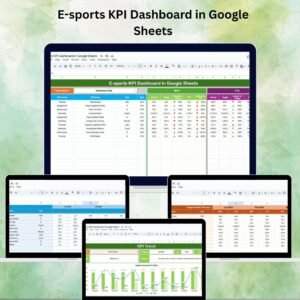
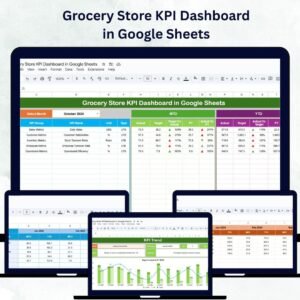
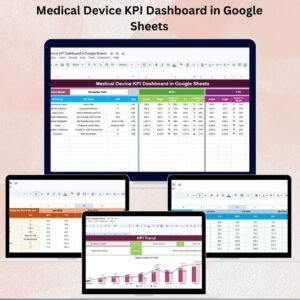
🖥️ Dashboard Sheet – Instant KPI Overview
Displays Month-to-Date (MTD) and Year-to-Date (YTD) actuals, targets, and prior year comparisons
Uses conditional formatting with 🔼🔽 arrows for visual performance tracking
Highlights deviations from targets and historical trends
📈 KPI Trend Sheet – Visualize Long-Term Progress
Dropdown to select any KPI and analyze it over time
Displays KPI Group, Unit, Formula, Type (Lower/Upper the Better), and Definition
Enables clear trend analysis and forecasting
📝 Actual Number Sheet – Central Data Entry Hub
Enter current month’s performance values
Sheet automatically updates all visuals and metrics across the dashboard
Ensures real-time performance reflection
🎯 Target Sheet – Set and Measure Performance Goals
Input both MTD and YTD target values
Enables side-by-side comparison of Actual vs Target for strategic evaluation
🕒 Previous Year Number Sheet – Year-Over-Year Comparison
Store last year’s values for each KPI
Assess growth, setbacks, and trends by comparing current performance to historical data
📘 KPI Definition Sheet – Clarity for Every Stakeholder
Clearly defines each KPI with its group, formula, unit, and strategic importance
Helps teams align on what’s being measured and why
📦 What You Get with This Dashboard
✅ 6 Fully Functional Sheets
📊 Real-time synced data across all tabs
🔄 Instant KPI comparison with dynamic visuals
🔧 Customizable structure for your institution’s needs
📥 No coding or scripting required—just use Google Sheets
🌐 Cloud-based collaboration for distributed teams
👥 Who Is This Dashboard For?
💼 Microfinance Managers – Track loan performance, client metrics, and repayment
🧮 Finance Officers – Monitor sustainability, costs, and profitability
📈 Operations Teams – Optimize workflow, outreach, and resource allocation
🧑💼 Donors & Investors – Use insights to report on impact and ROI
🏢 NGOs & Cooperatives – Ensure transparency and efficiency in financial programs
🧠 How to Use the Dashboard
Go to the Actual Number Sheet and input this month’s data
Enter monthly and yearly Targets in the Target Sheet
Add previous year’s numbers for comparison and trends
Switch to Dashboard Sheet for real-time MTD & YTD visuals
Use the KPI Trend Sheet to analyze performance over time
Refer to the KPI Definition Sheet for clarity and collaboration
💡 Best Practices for Effective KPI Monitoring
✅ Update data regularly to reflect timely progress
📉 Focus on mission-critical KPIs like Portfolio at Risk, Loan Recovery, and Client Retention
📊 Leverage the Trend Sheet to forecast and plan
🔄 Use PY comparisons to track institutional growth
🔧 Customize KPIs and groups to match your internal framework
Read the detailed blog post
Watch the step-by-step video Demo: