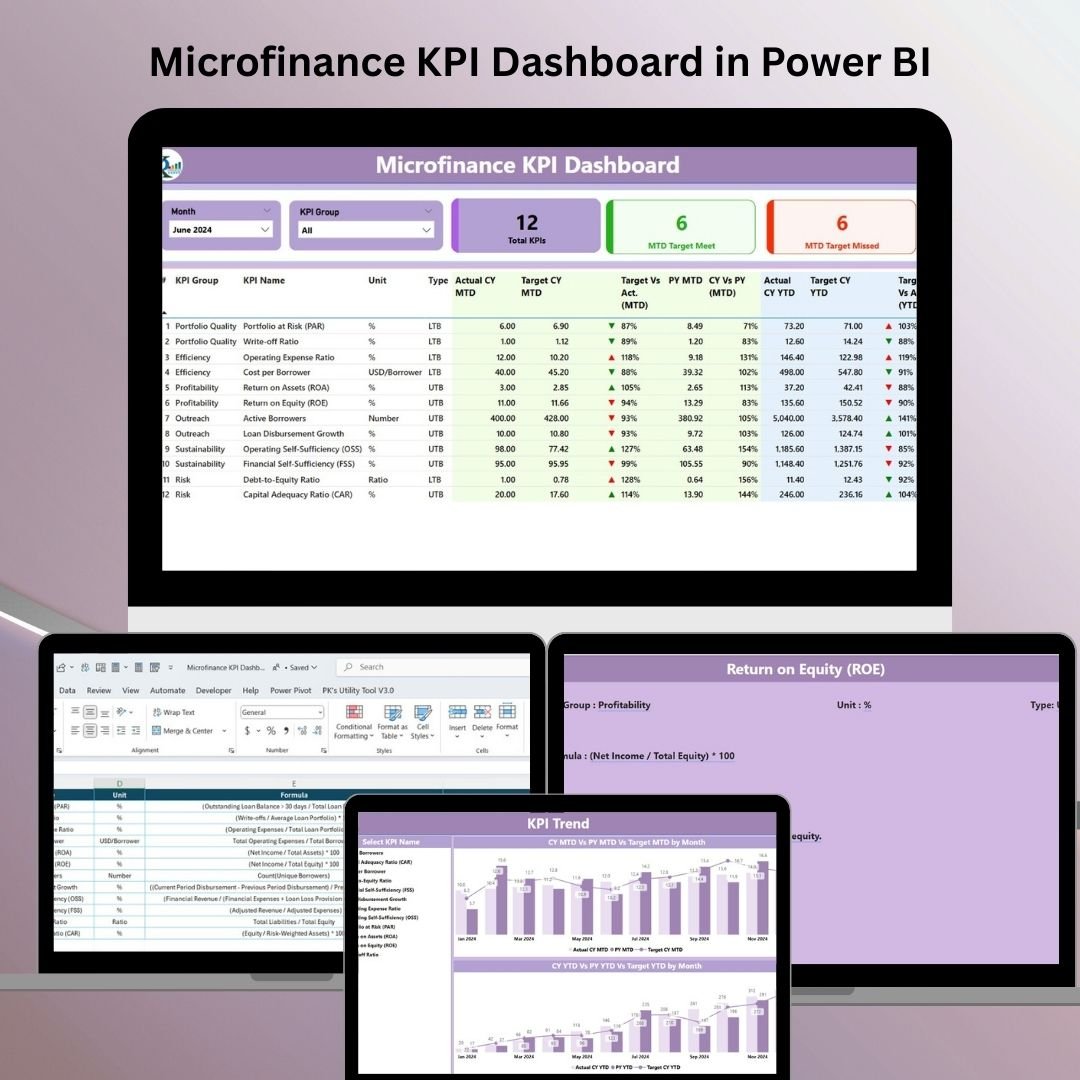
In today’s data-driven financial world, microfinance institutions (MFIs) must make every decision count. Whether you’re managing portfolio health, tracking repayment rates, or evaluating risk exposure, you need actionable data at your fingertips. That’s why we created the Microfinance KPI Dashboard in Power BI—a powerful, ready-to-use solution for performance tracking and strategic execution. 💡📈
Built for microfinance professionals—from credit officers to CXOs—this dashboard delivers clarity, accuracy, and control, using dynamic visuals and Excel-driven data updates. It empowers your team to make faster decisions and monitor what matters most—without writing a single line of code.
✨ Key Features of the Microfinance KPI Dashboard
📍 Summary Page – Your Central Command
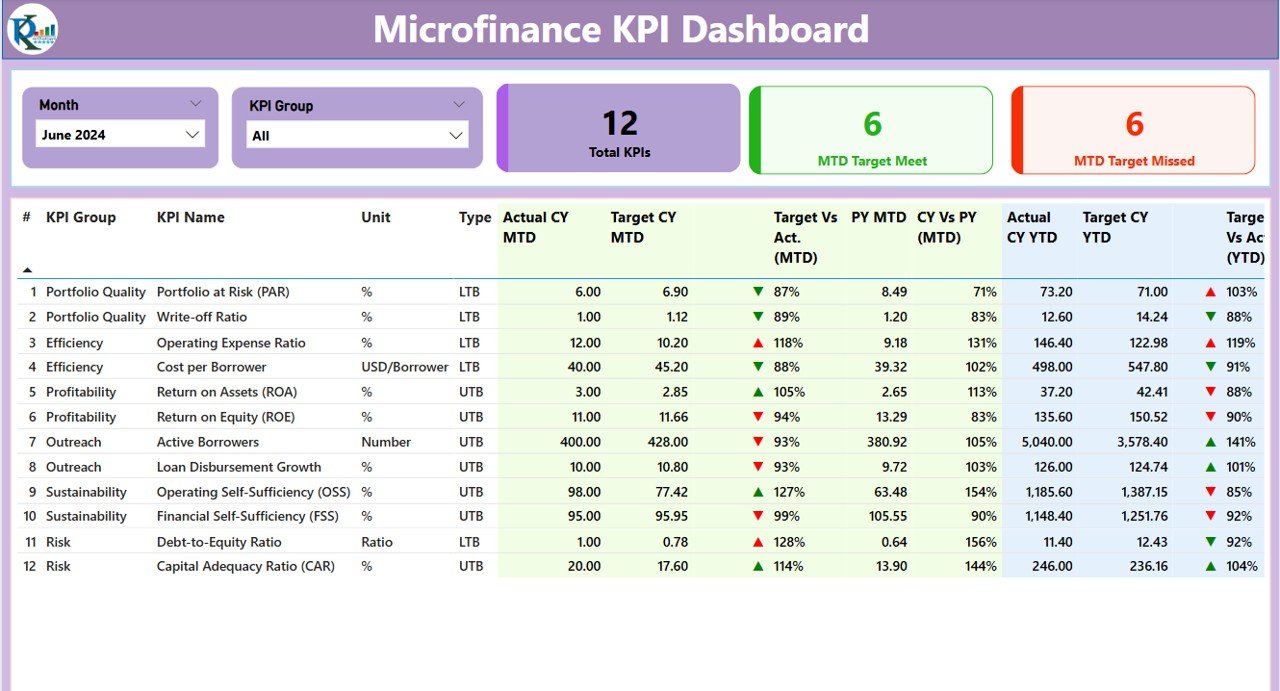
Everything you need at a glance:
-
🔽 Slicers for Month and KPI Group
-
📊 KPI Summary Cards:
-
Total KPIs Tracked
-
KPIs Meeting Targets
-
KPIs Missing Targets
-
-
🧾 Interactive Table with:
-
KPI Name, Group, Type (UTB/LTB)
-
MTD & YTD Actuals vs Target
-
Previous Year Comparison
-
Visual Arrows (⬆️⬇️) showing performance at a glance
-
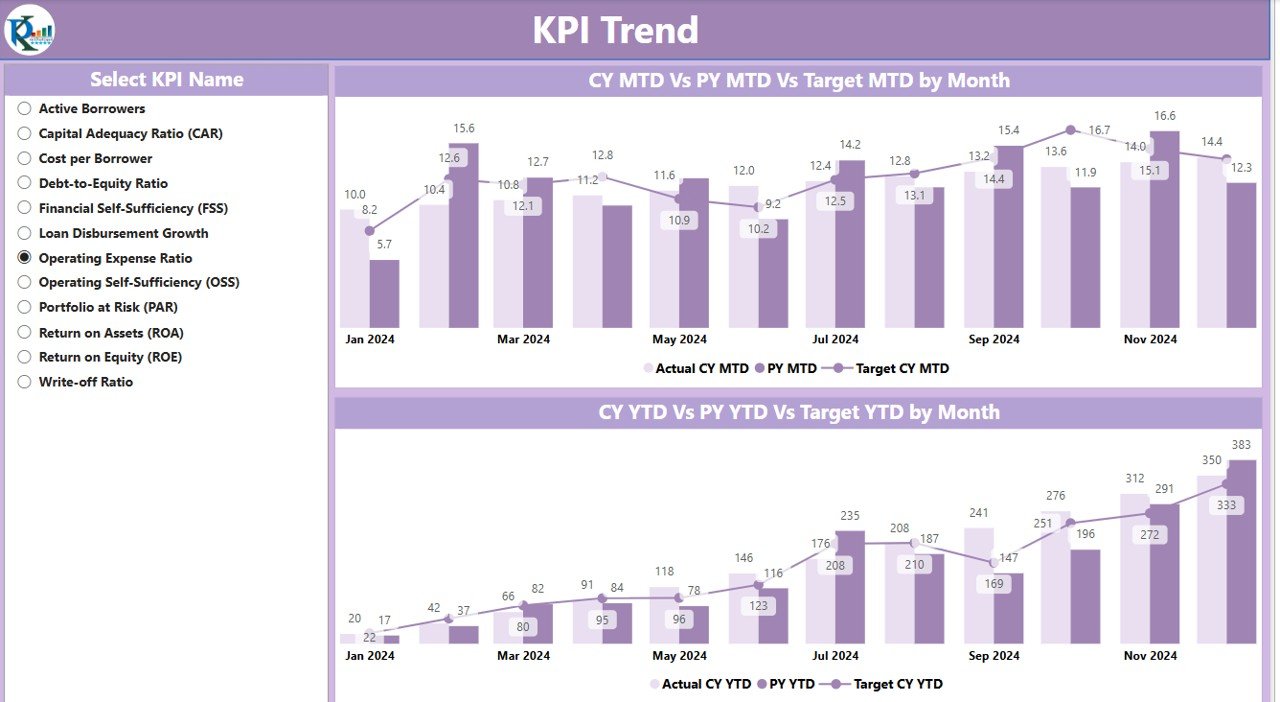
📈 KPI Trend Page – Track the Journey Over Time
Dive deeper with visual trend tracking:
-
📉 Combo Charts for MTD and YTD
-
🔄 Compare Current Year vs Previous Year vs Target
-
🎯 Filter by individual KPI using the slicer
This page is ideal for identifying consistent performers or red-flag trends.
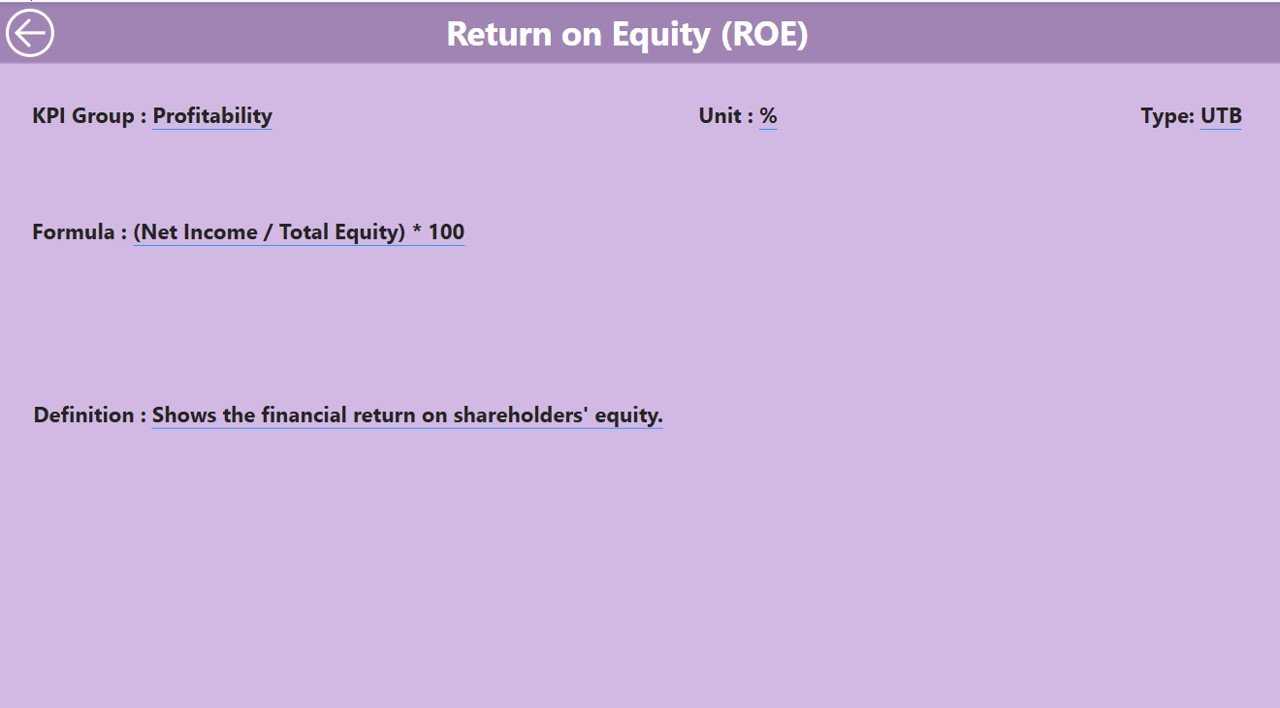
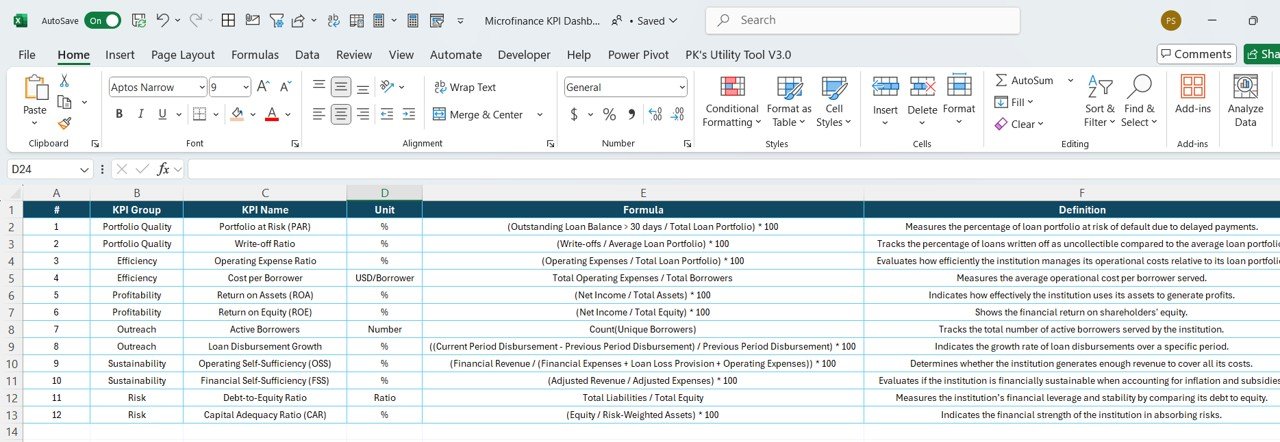
📘 KPI Definition Page – Understand Every Metric
Right-click any KPI in the summary table to drill through:
-
📌 View Formula, Unit, Full Definition, and Performance Type
-
🔙 Click back to return instantly
No guesswork—everyone on your team knows exactly what’s being measured and why.
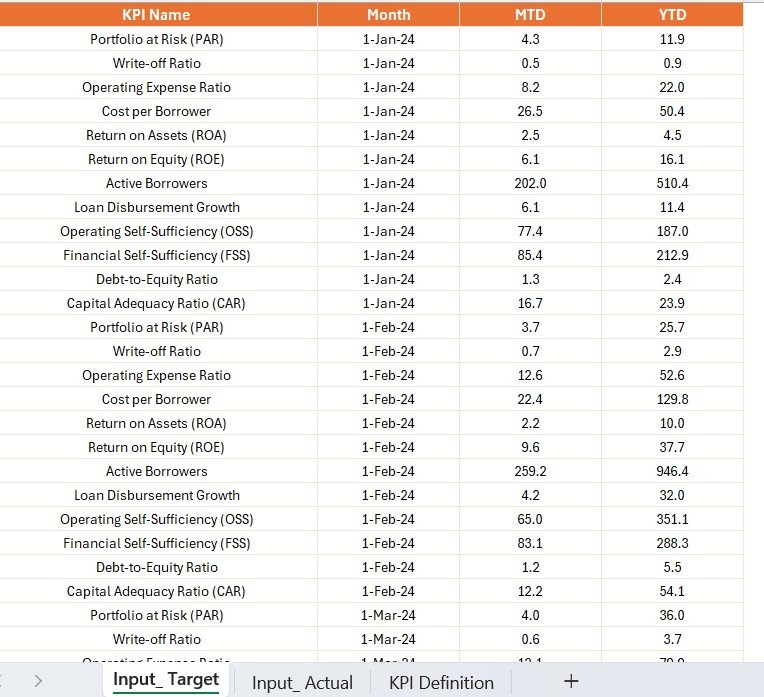
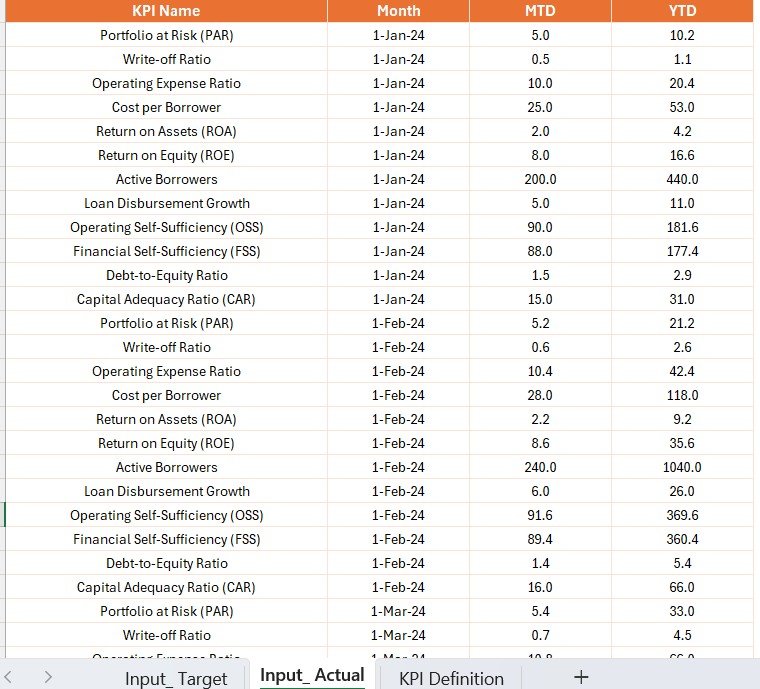
📂 Excel-Powered Data Source for Seamless Updates
No need for complicated integrations. Just update 3 Excel sheets monthly:
-
Input_Actual Sheet – Add MTD/YTD actuals for each KPI
-
Input_Target Sheet – Define monthly goals by KPI
-
KPI Definition Sheet – Maintain KPI metadata: name, unit, formula, type (UTB/LTB)
🔁 One refresh in Power BI updates the entire dashboard—instantly.
🧠 How to Use the Product
-
📥 Download the Power BI and Excel files
-
📊 Open Power BI Desktop and load the dashboard
-
🧾 Update the Excel sheets monthly with Actuals, Targets, and Definitions
-
🔄 Click “Refresh” in Power BI
-
📈 Use slicers to filter views by Month or KPI Group
-
🔍 Analyze insights, identify gaps, and adjust your strategy accordingly
No technical background required—just basic Excel and Power BI knowledge.
👥 Who Can Benefit from This Dashboard?
-
🧑💼 Microfinance Managers – Monitor overall institutional performance
-
📞 Credit Officers – Track disbursements, collections, and repayment KPIs
-
📊 Data Analysts – Analyze monthly trends and risk indicators
-
📋 Field Coordinators – Monitor outreach metrics in real-time
-
💼 Executives & Board Members – Gain quick insight into institutional health
Whether you’re managing 10 KPIs or 100, this dashboard scales to meet your needs.
🔗 Click here to read the Detailed blog post
📺 Visit our YouTube channel to learn step-by-step video tutorials


Reviews
There are no reviews yet.