

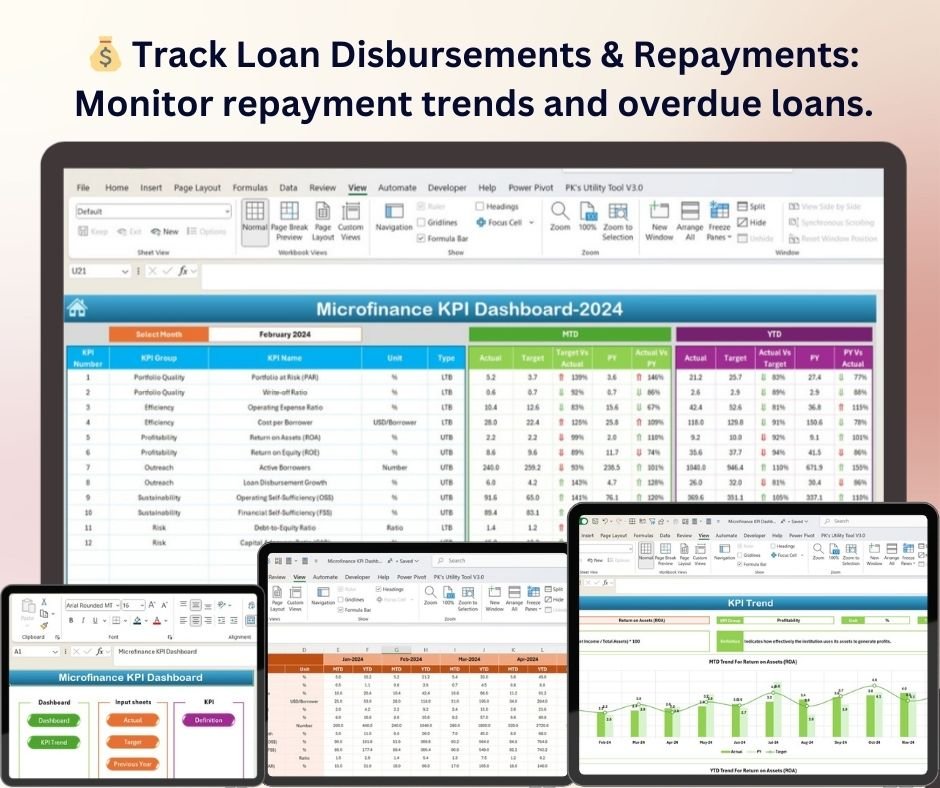
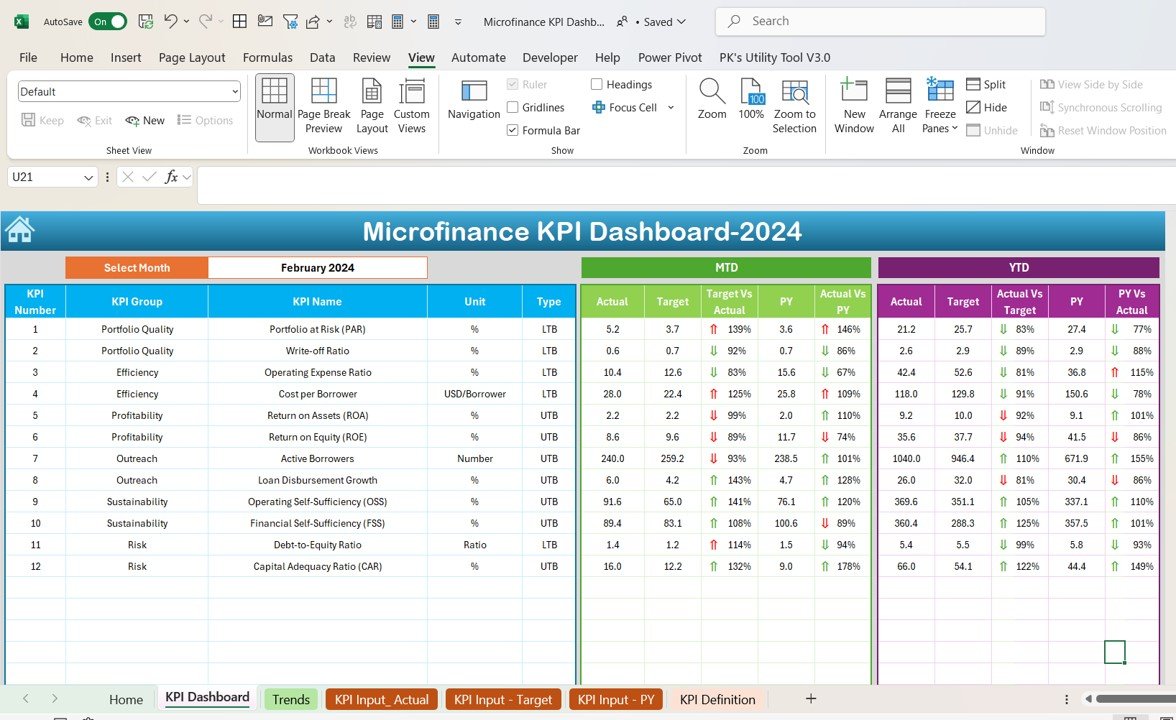
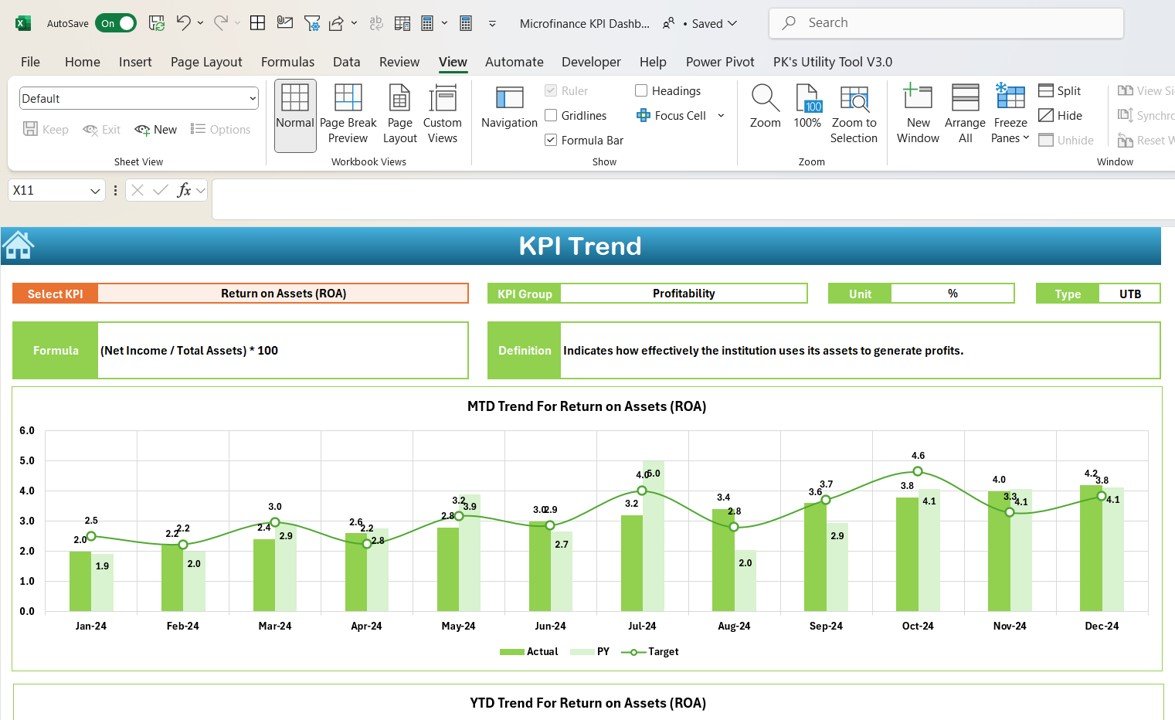
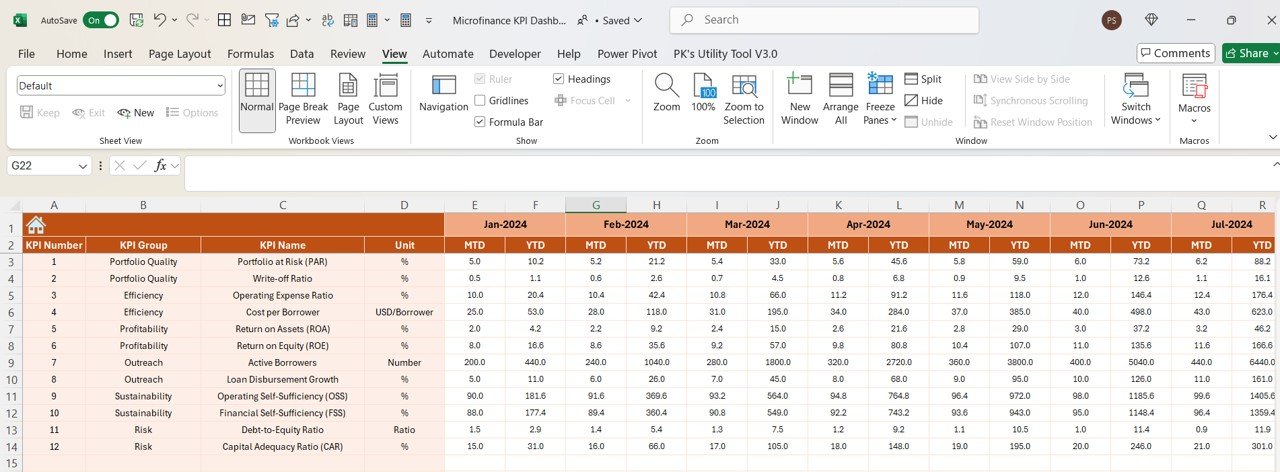
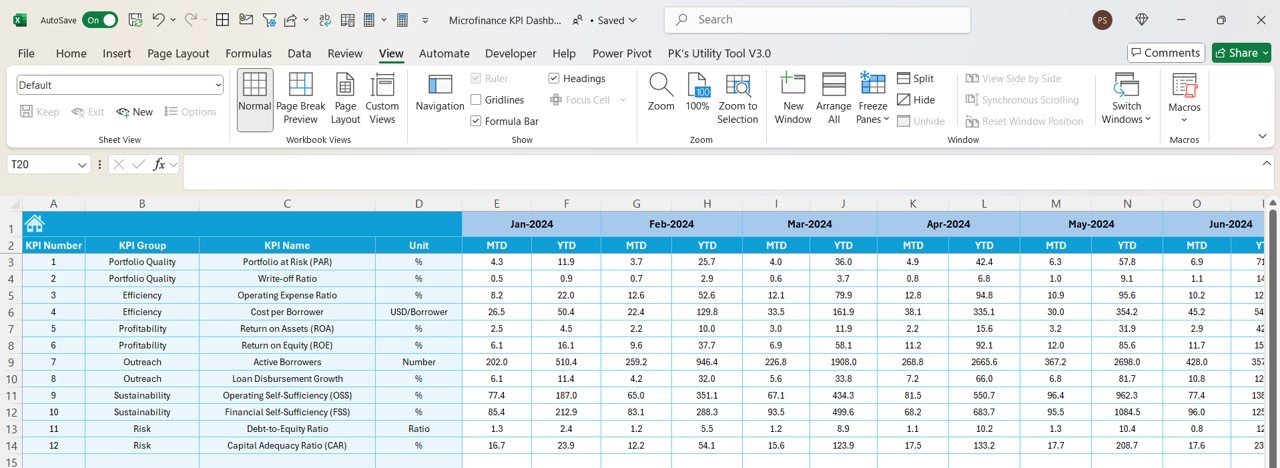
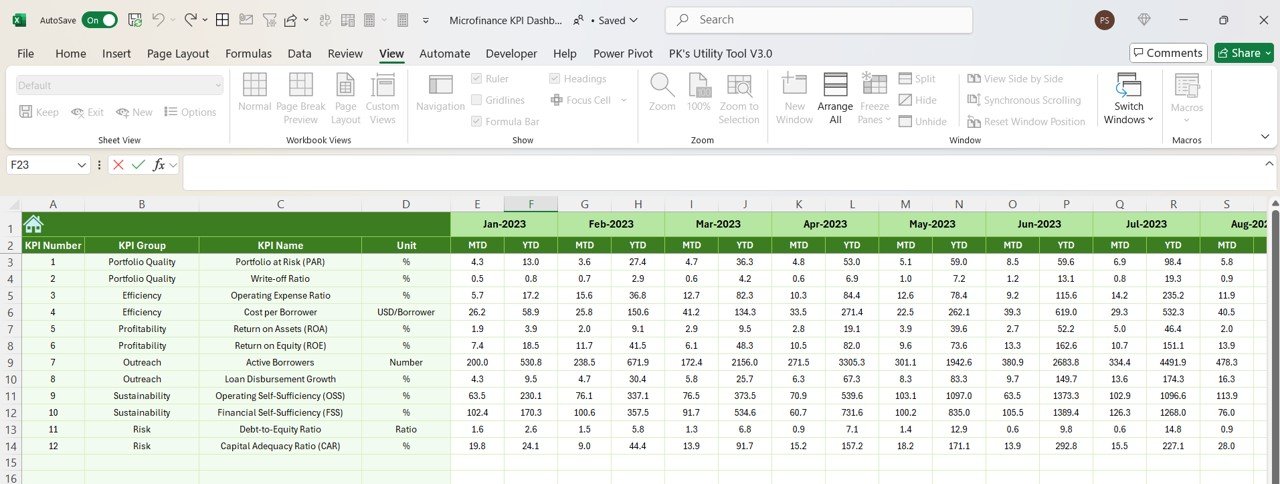
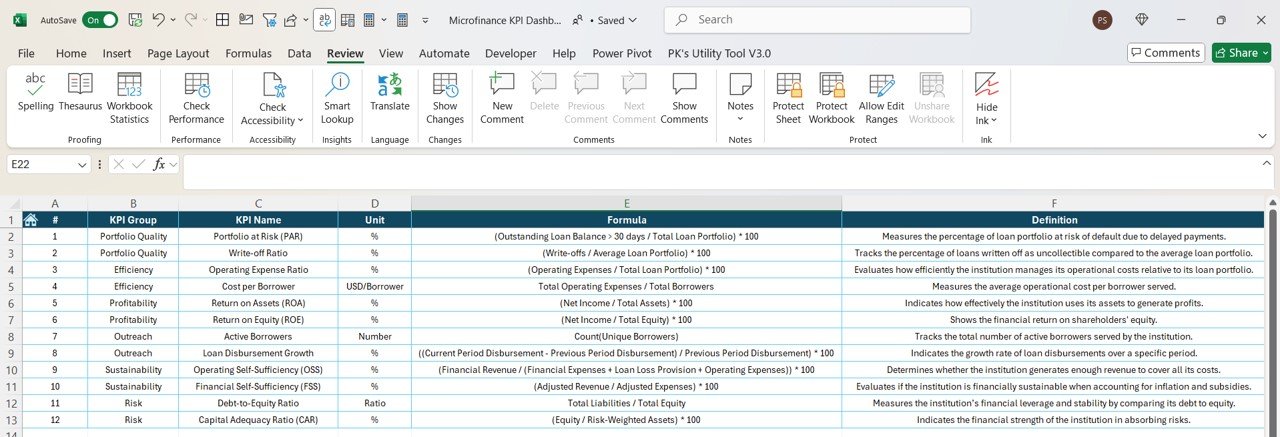

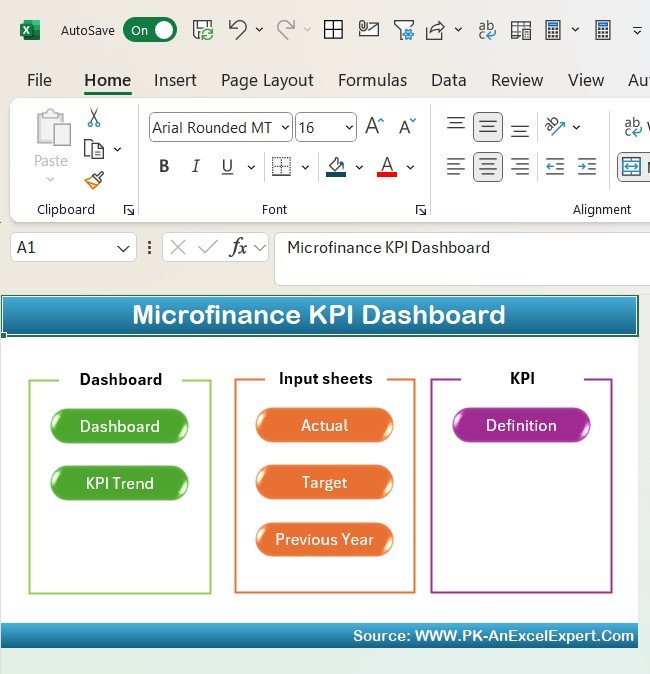
The Microfinance KPI Dashboard in Excel is a powerful tool designed to help microfinance institutions (MFIs), financial analysts, and managers track and optimize key performance indicators (KPIs) related to their operations. This Excel-based dashboard provides real-time insights into metrics such as loan disbursements, repayment rates, portfolio performance, and customer outreach. It is an essential tool for evaluating the financial health and impact of microfinance operations, enabling data-driven decisions that support growth and sustainability.
Whether you’re managing a microfinance institution, working in a development finance organization, or overseeing a community-based lending program, the Microfinance KPI Dashboard in Excel helps you track your financial performance and ensure effective loan portfolio management. By visualizing key metrics and trends, this dashboard provides valuable insights for improving operational efficiency, reducing risks, and increasing social impact.
Key Features of the Microfinance KPI Dashboard in Excel
💰 Track Loan Disbursements & Repayments
Monitor the amount of loans disbursed and track repayments to evaluate the financial performance of your lending activities. Stay on top of repayment rates and identify overdue loans for better portfolio management.
📊 Portfolio Performance Tracking
Evaluate the health of your loan portfolio by tracking KPIs like non-performing loans (NPLs), outstanding balances, and loan recovery rates. Use this data to assess the risk level and performance of your lending programs.
📉 Delinquency & Risk Management
Monitor delinquency rates and track at-risk loans to ensure that your institution’s portfolio remains healthy. This feature helps you proactively manage loan repayment issues and minimize defaults.
📈 Client Outreach & Growth Metrics
Track the number of new clients, active clients, and customer retention rates. Measure the impact of your microfinance services on financial inclusion and assess the effectiveness of your outreach strategies.
🖥️ Interactive & Real-Time Insights
The Excel dashboard includes interactive charts, slicers, and filters that allow you to explore different data points and gain actionable insights in real-time.
Why You’ll Love the Microfinance KPI Dashboard in Excel
✅ Monitor Loan Disbursements & Repayments
Track loan disbursements and repayments to monitor cash flow and portfolio performance. Keep an eye on repayment trends and reduce the risk of loan defaults.
✅ Assess Portfolio Health & Performance
Evaluate your loan portfolio by tracking key KPIs like non-performing loans, loan recovery, and outstanding balances. Use this data to maintain a healthy and profitable portfolio.
✅ Mitigate Risk with Delinquency Tracking
Monitor delinquency rates and identify loans at risk of default. Take proactive measures to reduce the likelihood of non-performing loans and safeguard your microfinance institution’s financial health.
✅ Track Client Outreach & Retention
Monitor the growth of your client base and measure customer satisfaction. Use the data to optimize client outreach and retention strategies, contributing to the long-term success of your programs.
✅ Make Data-Driven Decisions
Leverage real-time data to make informed decisions about loan portfolio management, risk mitigation, and client outreach. Optimize your operations and maximize impact with actionable insights.
What’s Inside the Microfinance KPI Dashboard Template?
- Loan Disbursement & Repayment Tracking: Monitor loan amounts, repayment rates, and overdue loans.
- Portfolio Performance Metrics: Track NPLs, loan recovery rates, and outstanding balances.
- Delinquency & Risk Management: Monitor delinquency rates and identify loans at risk of default.
- Client Outreach & Growth Metrics: Track the number of new and active clients, and measure retention.
- Real-Time Data Insights: Access live data to track performance, make adjustments, and optimize strategies.
- Customizable KPIs: Tailor the dashboard to track the KPIs that matter most to your microfinance operations.
How to Use the Microfinance KPI Dashboard in Excel
1️⃣ Download the Template: Get instant access to your Microfinance KPI Dashboard in Excel.
2️⃣ Input Your Data: Enter loan disbursement, repayment, portfolio performance, and client data into the dashboard.
3️⃣ Track & Monitor KPIs: Use the dashboard to track loan repayment, portfolio health, delinquency rates, and client growth in real-time.
4️⃣ Analyze & Optimize: Use insights to optimize portfolio management, improve client outreach, and reduce risk.
Who Can Benefit from the Microfinance KPI Dashboard in Excel?
🔹 Microfinance Institutions (MFIs)
🔹 Financial Analysts & Managers
🔹 Non-Governmental Organizations (NGOs)
🔹 Community Lending Programs
🔹 Development Finance Organizations
🔹 Anyone Working to Promote Financial Inclusion & Manage Microfinance Operations
Ensure your microfinance operations are on track with the Microfinance KPI Dashboard in Excel. Track performance, manage risks, and optimize your lending strategies to achieve greater financial inclusion and social impact.
Click here to read the Detailed blog post
Visit our YouTube channel to learn step-by-step video tutorials
Youtube.com/@PKAnExcelExpert






















Reviews
There are no reviews yet.