


The robotics industry is all about precision, uptime, and innovation—and your data tracking should be no different. With our Robotics Industry KPI Dashboard in Google Sheets, you’ll get a powerful, ready-to-use template designed to monitor your key performance indicators (KPIs) without the need for expensive software or technical skills.
Whether you’re managing robotic production lines, monitoring downtime, or tracking cost-per-unit, this Google Sheets dashboard puts all your essential metrics in one visual, interactive, and customizable format.

⚙️ Key Features of Robotics Industry KPI Dashboard
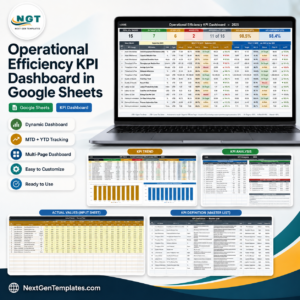
🖥️ Dashboard Sheet – Real-Time Performance at a Glance
Instantly view MTD (Month-to-Date) and YTD (Year-to-Date) metrics
Compare Actual vs Target and Actual vs Previous Year
Conditional formatting with 🔼🔽 arrows shows real-time progress
Perfect for quick reporting and performance reviews
📈 KPI Trend Sheet – Track Long-Term Performance
Select any KPI from the dropdown
View KPI Group, Unit, Type (LTB/UTB), Formula, and Definition
Identify monthly and yearly trends using interactive graphs
📝 Actual Number Sheet – Live Data Entry
Input real performance data for selected month (E1)
Updates all dashboard visuals automatically
Keeps your team aligned with the most current metrics
🎯 Target Sheet – Set Your Performance Benchmarks
Enter monthly and yearly goals for every KPI
Get immediate visibility into Target vs Actual performance
🕒 Previous Year Number Sheet – Track Year-Over-Year Progress
Store and compare previous year’s data
See how your robotics performance has evolved over time
📘 KPI Definition Sheet – Maintain KPI Clarity
Detailed KPI definitions with formula, unit, and purpose
Ensures all stakeholders are aligned and informed
📦 What’s Inside the Robotics KPI Dashboard?
✅ 6 Sheets: Dashboard, KPI Trend, Actuals, Targets, PY Numbers, Definitions
📊 Automated charts and tables with slicers and dropdowns
🔄 Real-time data sync across all sheets
📥 Easy-to-edit fields—no coding or macros required
🌐 Fully cloud-based—accessible from anywhere with Google Sheets
🧠 How to Use the Robotics Industry KPI Dashboard
Input your monthly performance data in the Actual Number Sheet
Define your goals in the Target Sheet
Compare current vs past performance using the PY Sheet
Select KPIs in the Trend Sheet for deeper analysis
Use the Dashboard Sheet for reporting, reviews, and action plans
No installations. No scripts. Just plug in your numbers and go!
👥 Who Can Benefit from This Dashboard?
🤖 Robotics Factory Managers – Monitor uptime, efficiency, and production
🛠️ Engineering Teams – Track energy usage, error rates, and output quality
📈 Operations Heads – Optimize costs and downtime across lines
📊 Data Analysts – Discover trends and generate actionable insights
🚀 Startups & Innovators – Benchmark growth and scale operations smoothly
This dashboard is perfect for any robotics-driven operation looking to increase transparency, drive productivity, and make better decisions.
🔧 Best Practices for Using This Template
✅ Update data regularly for real-time accuracy
📉 Focus on critical KPIs like robot uptime, defects, and efficiency
📊 Leverage trend insights for predictive maintenance and cost saving
🔄 Review year-over-year data to assess growth
🧩 Customize easily to fit your unique robotic systems or processes
🔗 Click here to read the Detailed blog post
Watch the step-by-step video Demo:




Reviews
There are no reviews yet.