

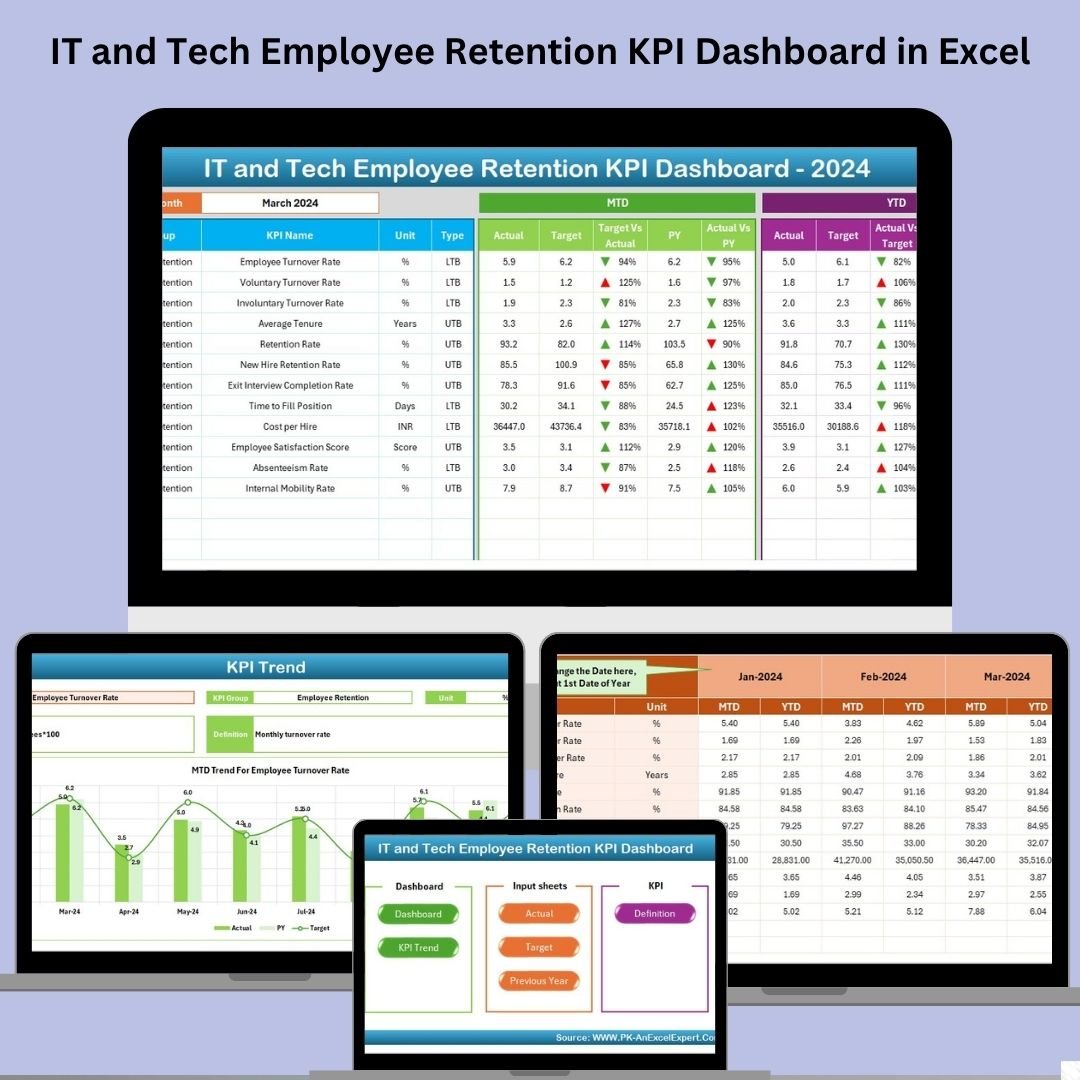

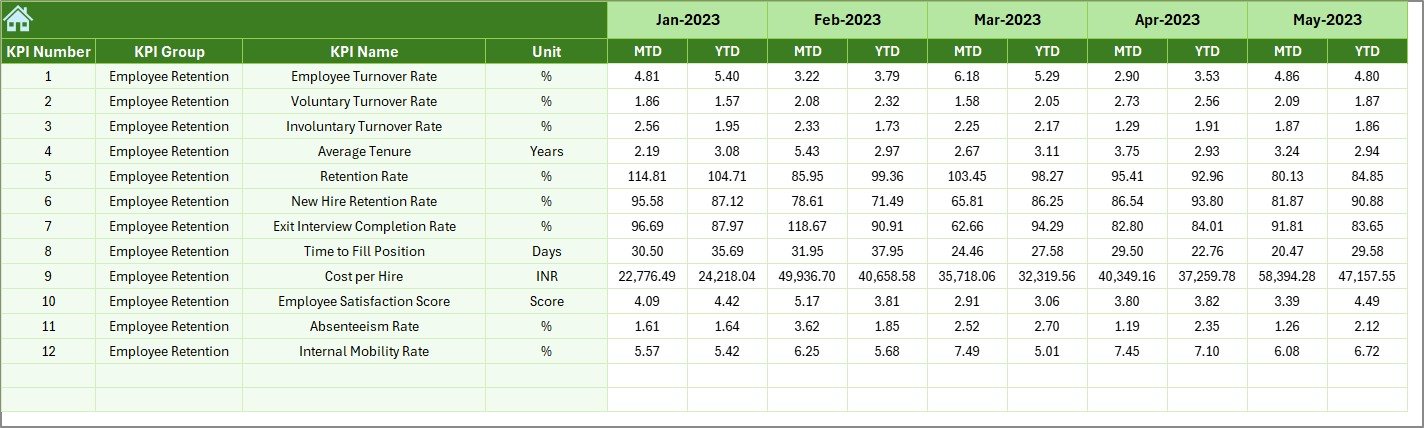


Retaining top tech talent is no longer just an HR function—it’s a business imperative. In today’s hyper-competitive IT environment, high turnover leads to missed project deadlines, inflated hiring costs, and a massive drain on team morale. That’s exactly why we created the IT and Tech Employee Retention KPI Dashboard in Excel—a smart, ready-to-use template designed to help you track and improve employee retention like never before. 💡📉
Whether you’re a startup, IT consultancy, or an enterprise tech firm, this dashboard gives you data-driven insights to prevent employee churn and build a stable workforce—all without the need for expensive HR software.
🔑 Key Features of the IT and Tech Employee Retention KPI Dashboard in Excel
🧭 Home Sheet Navigation
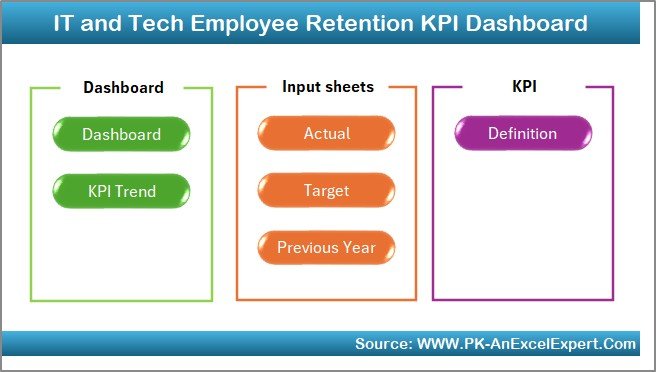
Acts as your command center with clickable buttons that instantly take you to key sheets like the Dashboard, Actual Data, Targets, Trends, and more. Even non-technical users can use it like a pro!
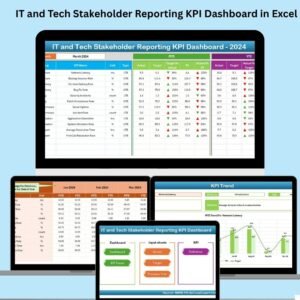
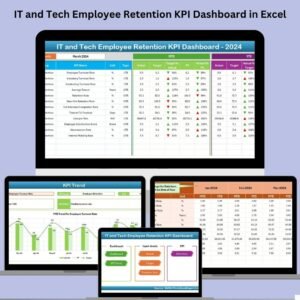
📈 Interactive Dashboard Page
Monitor all your key metrics at a glance. With the Month Selector, you can view real-time MTD (Month-to-Date) and YTD (Year-to-Date) comparisons against targets and previous years.
✅ Arrows indicate whether you’re trending upward or need improvement.
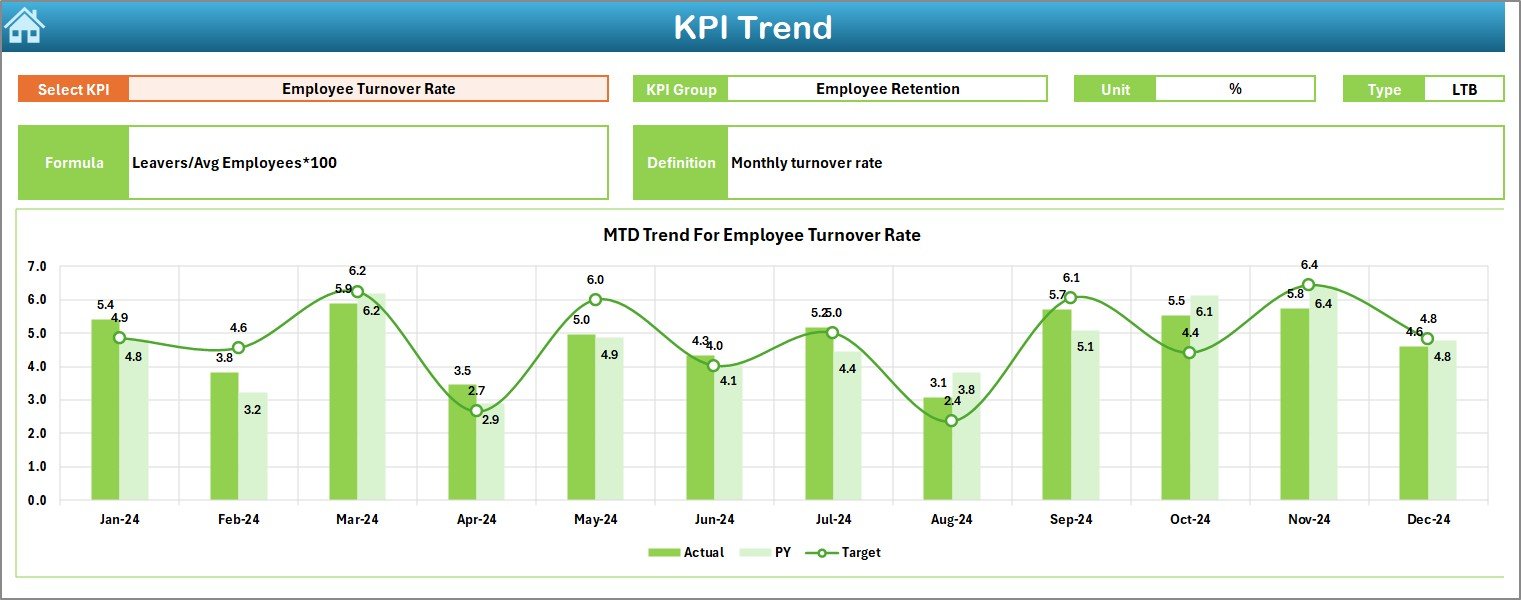
📊 KPI Trend Page
Pick any KPI from a drop-down menu and see dynamic charts for MTD, YTD, and historical data—all in one place. Plus, understand the KPI group, unit, and performance type (LTB or UTB).
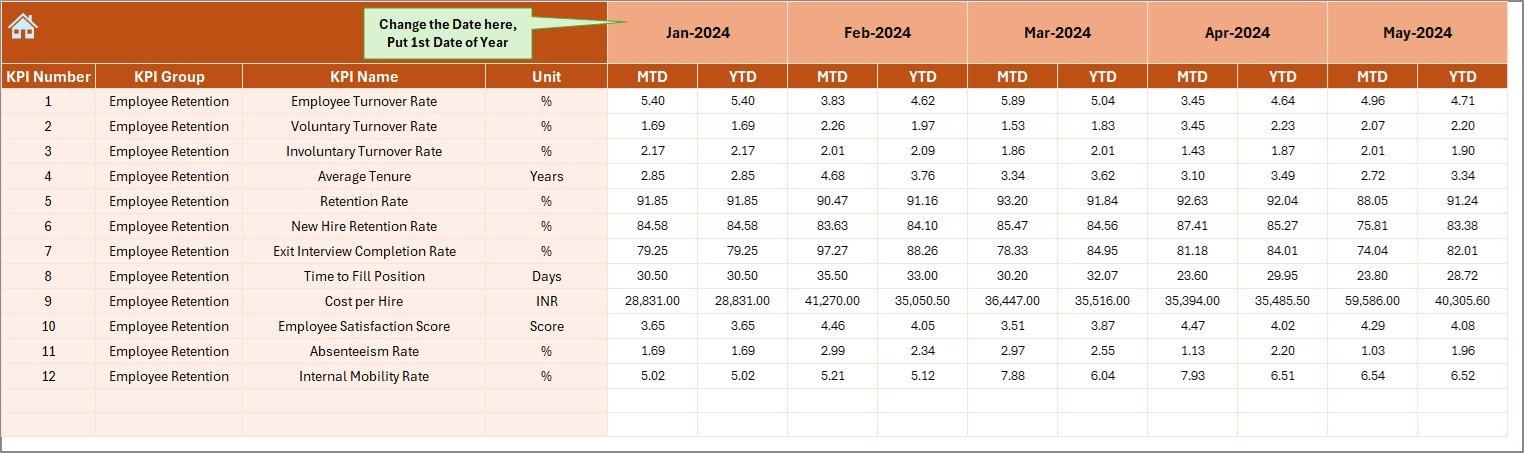
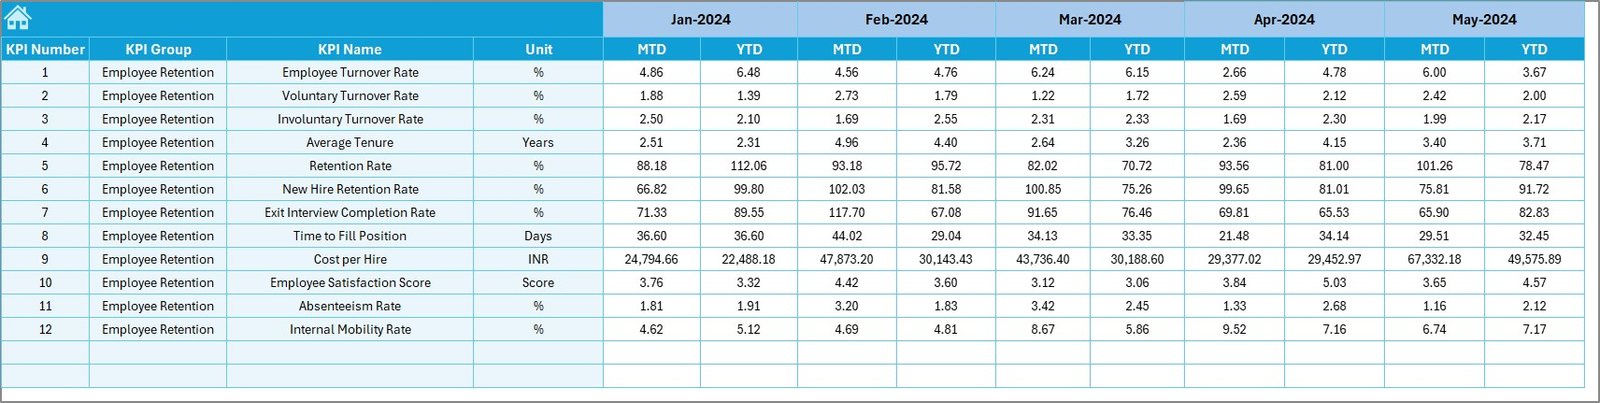
🗂 Actuals, Targets, and Historical Data
Three separate sheets to manage actuals, targets, and past-year numbers. Easily editable and built to support custom start months for any fiscal year.
📘 KPI Definition Sheet
Everything you need to understand your KPIs—definitions, formulas, measurement units, and classification (LTB or UTB)—ensuring full transparency and consistency across your organization.
📦 What’s Inside the Product
✅ Excel Dashboard File (.xlsx)
📊 7 Expertly Designed Worksheets
📅 Month Selector for dynamic performance views
📈 Conditional Formatting and Arrow Indicators
🔄 MTD/YTD Comparison with Previous Year Data
📘 KPI Library with Formula and Definitions
🧩 100% Customizable – Add new KPIs, visuals, branding
🔐 Easy to protect and share with stakeholders
📥 Download-and-go setup – No software or add-ins required
📌 How to Use the Product
✅ Open the Excel Dashboard file
🧾 Enter Actual KPIs in the ‘Actual Numbers’ sheet
🎯 Input monthly targets in the ‘Target’ sheet
🕰 Add Previous Year data in the respective tab
📅 Use the Month Selector to update visuals
📊 Track trends using the dynamic KPI Trend sheet
🧠 Refer to the KPI Definition tab for full understanding
👥 Who Can Benefit from This Dashboard?
🧑💼 HR Managers – Identify and fix retention gaps before they grow
📊 Business Analysts – Monitor turnover trends and visualize risks
👨💻 IT Team Leads – Keep track of role-specific attrition
🏢 Tech Startups – Manage retention without investing in HRMS software
🏗 Mid-Size & Enterprise IT Firms – Align workforce stability with project continuity
📣 Consultants – Deliver data-backed insights to clients
🎯 C-suite Executives – Make strategic, talent-focused decisions
🔗 Click here to read the Detailed blog post
🎥 Visit our YouTube channel to learn step-by-step video tutorials
Watch the step-by-step video tutorial:
Compatibility and Requirements
- Works in Microsoft Excel desktop (Excel 2016 or later, or Microsoft 365).
- You pick the month and the KPI from dropdown lists. Microsoft explains dropdowns in Create a drop-down list.
More Questions About This Template
Which sheets are included?
Seven worksheets: Home, Dashboard, KPI Trend, Actual Numbers, Target, Previous Year Number and KPI Definition.
How do I update the dashboard?
Enter your actual figures in the Actual Numbers sheet, your goals in the Target sheet and last year’s figures in the Previous Year Number sheet. Then choose a month with the Month Selector on the Dashboard sheet and the MTD and YTD views update.
How do I see the trend for one KPI?
Open the KPI Trend sheet and pick a KPI from the dropdown. It shows MTD, YTD and previous-year charts, plus the KPI group, unit and type (LTB or UTB).
Can I add my own KPIs?
Yes. The template is fully customizable, so you can add new KPIs, visuals and your own branding. The KPI Definition sheet lists the formula, unit and type for each KPI.
Is there a Google Sheets version?
There is an Employee Retention KPI Dashboard in Google Sheets. It is a general version, not specific to IT and tech teams.
Related Employee Retention Templates
- Employee Retention KPI Dashboard in Excel: the general retention dashboard
- Human Resources Employee Retention KPI Dashboard in Excel: a retention dashboard built for HR teams
- IT and Tech Employee Satisfaction KPI Dashboard in Excel: satisfaction KPIs for the same IT teams
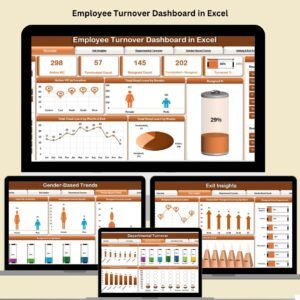
- Employee Turnover Dashboard in Excel: track turnover over time
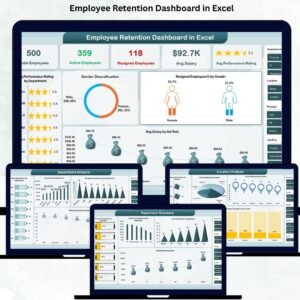
- Employee Retention Dashboard in Excel: another retention view in Excel
Browse all Excel KPI dashboards and IT templates.















Reviews
There are no reviews yet.