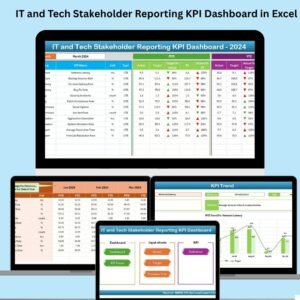
In a rapidly evolving digital landscape, guessing your IT team’s performance is no longer an option. You need data. You need clarity. And most importantly, you need a tool that delivers results. That’s where the IT and Tech Growth Metrics KPI Dashboard in Excel steps in—your all-in-one solution to track, measure, and improve your technology operations effortlessly. 📈🧠
This ready-to-use Excel dashboard provides a full 360° view of your performance, combining powerful visuals, automated calculations, and actionable insights—all without needing advanced Excel skills or coding knowledge.
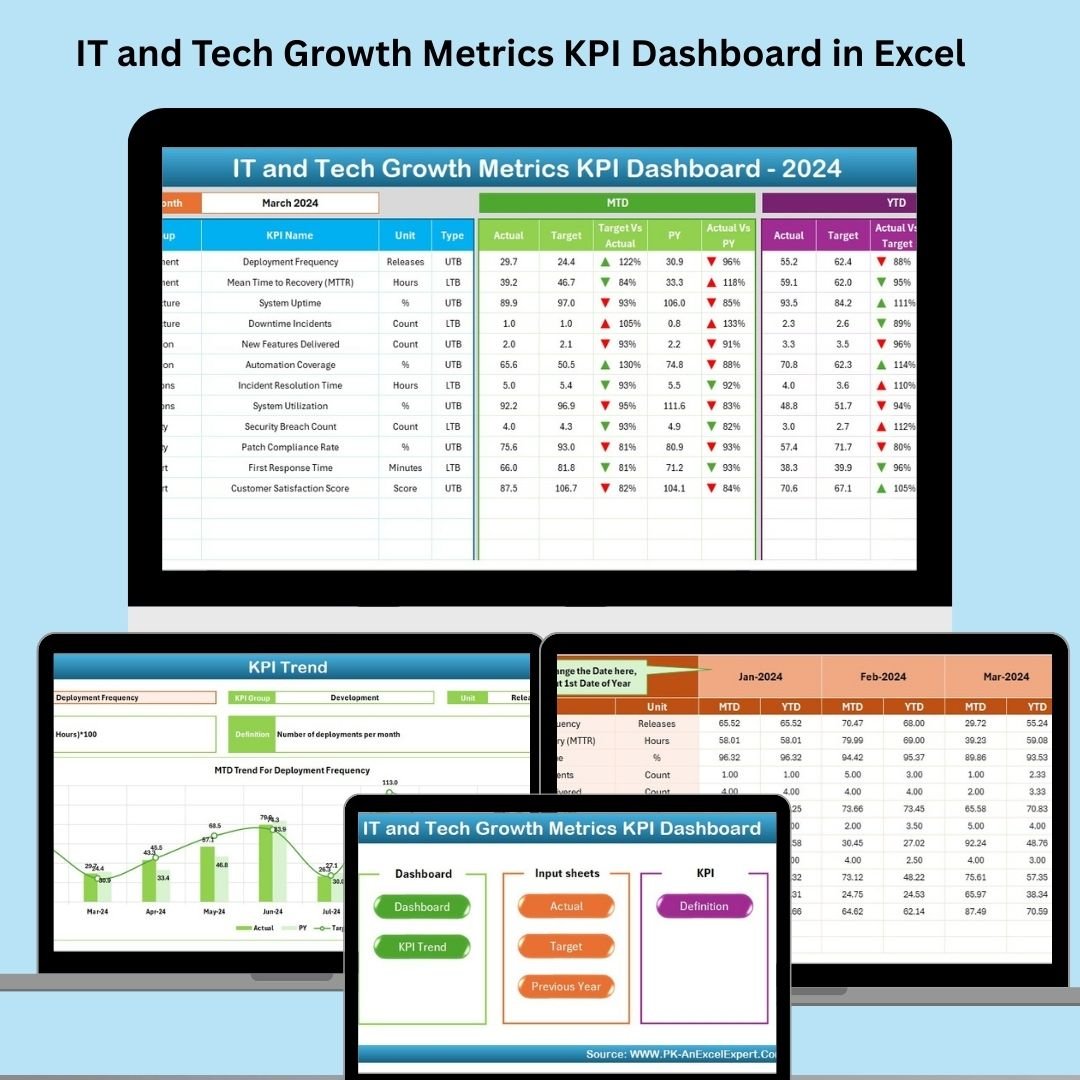
✨ Key Features of IT and Tech Growth Metrics KPI Dashboard
📊 Dynamic Dashboard Sheet
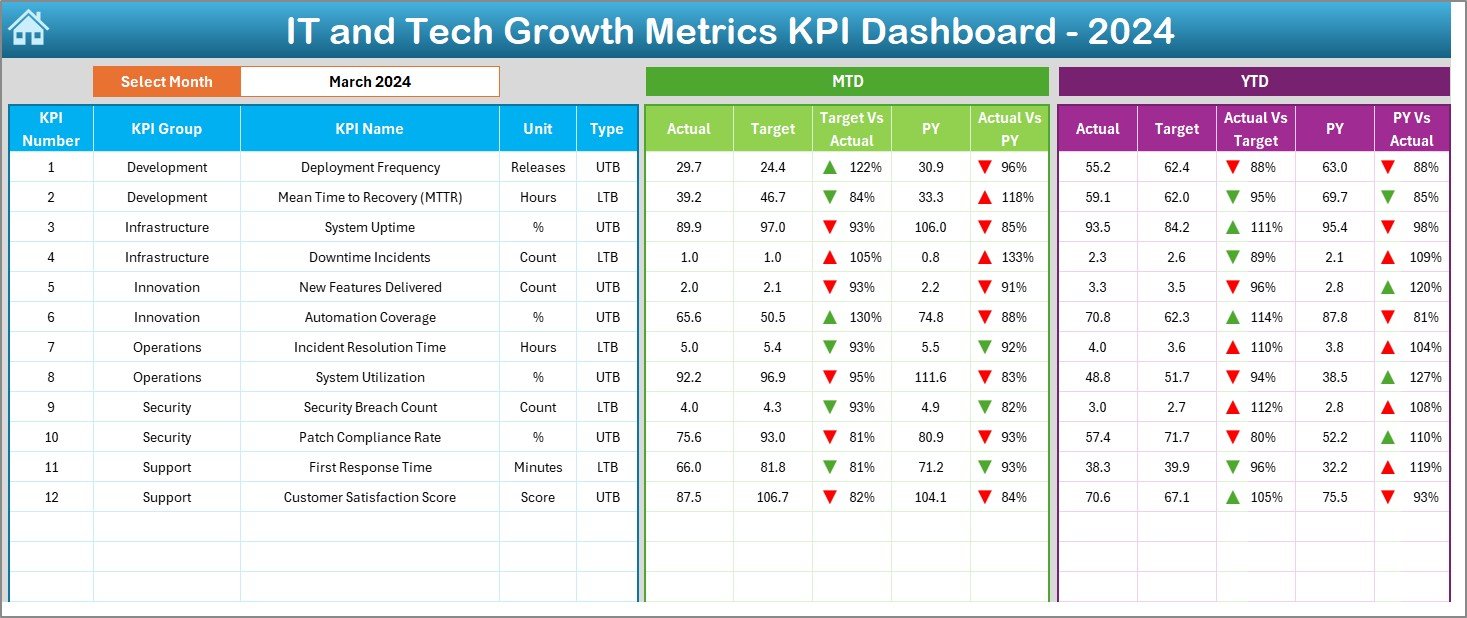
Track MTD and YTD metrics side-by-side with Targets and Previous Year data.
📌 Conditional formatting highlights trends with visual up/down arrows.
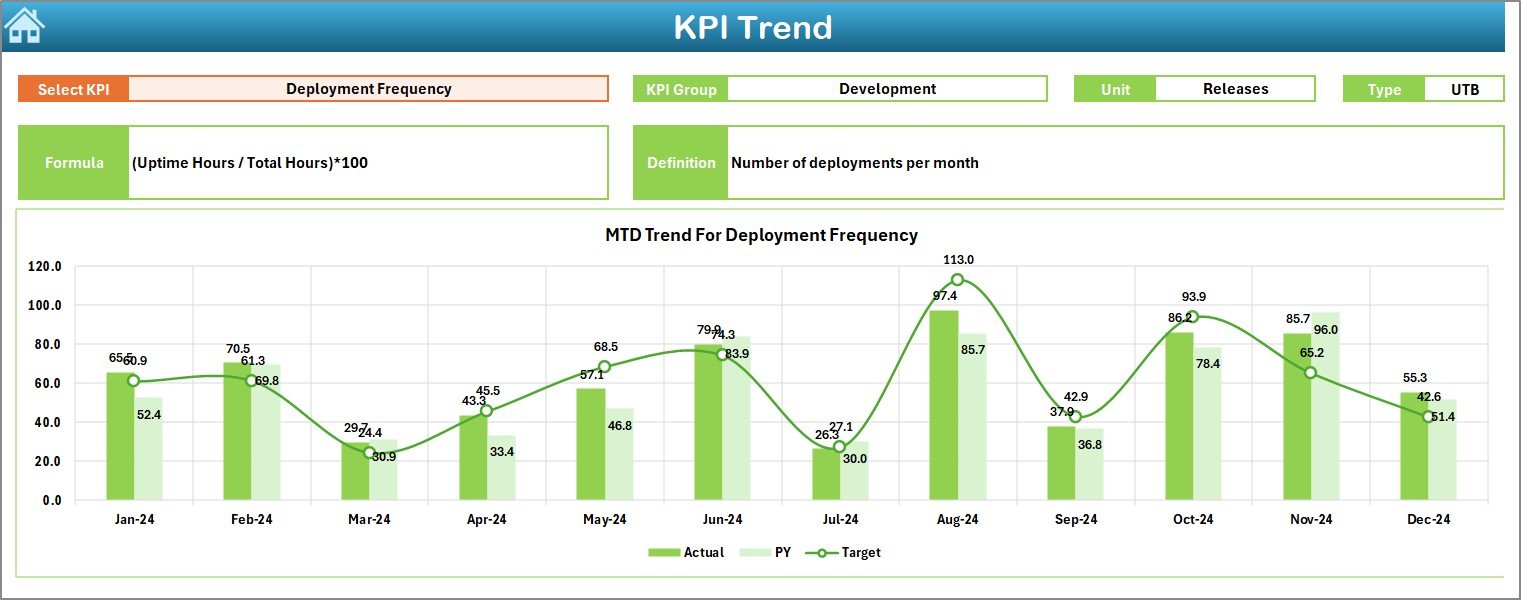
📍 KPI Trend Visualization
See performance progress over time through smart combo charts and slicers.
Analyze trends to make strategic decisions early.
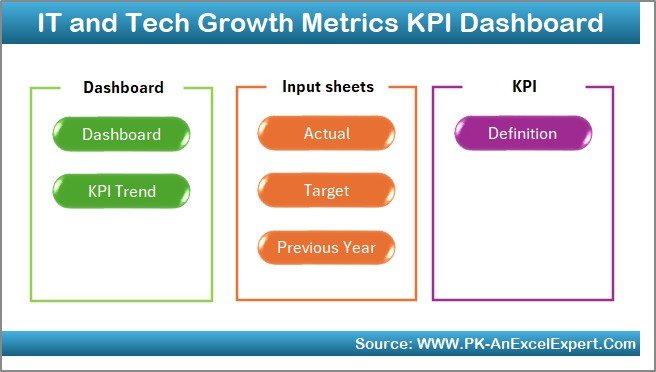
📁 Central Navigation from Home Sheet
Jump to any of the 6 sheets directly using clickable buttons.
Simplifies the user experience for everyone—from managers to analysts.
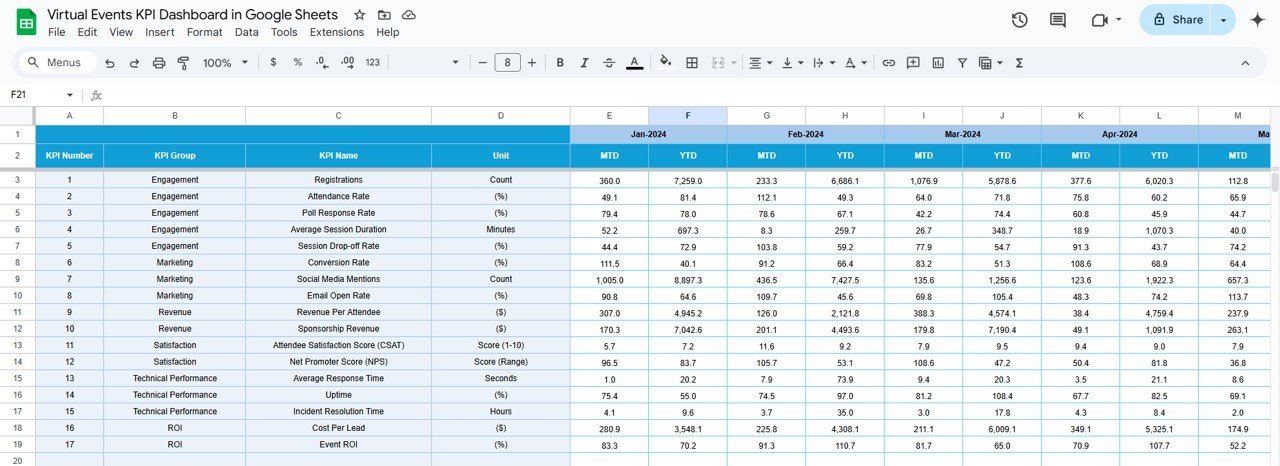
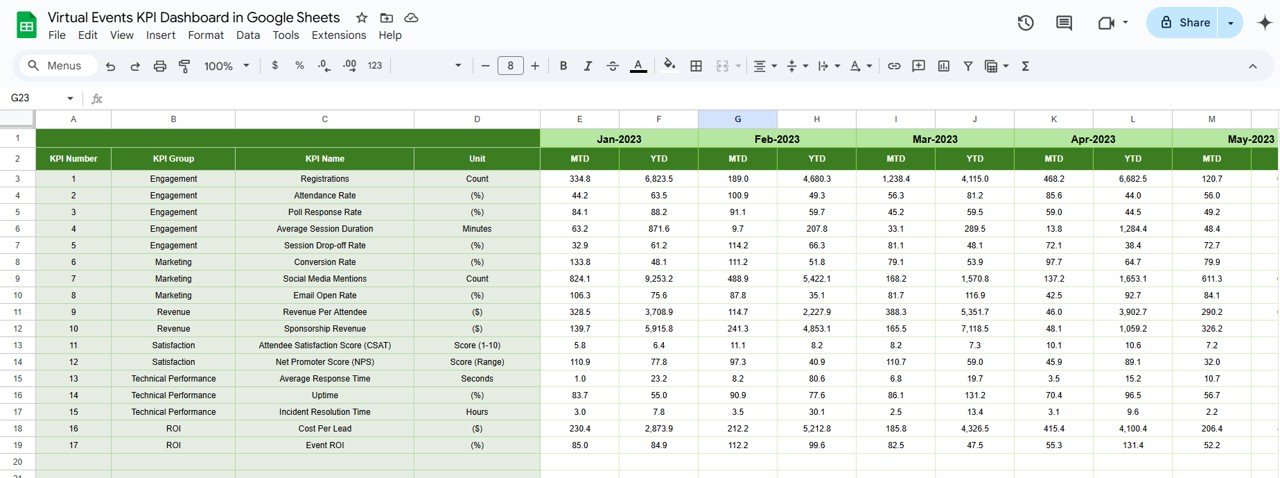
📥 Data Entry Sheets for Actual, Target, and Previous Year
Separate tabs to manage your actual numbers, goals, and past benchmarks.
Ensures accuracy and easy updates.
📘 KPI Definition Sheet
Quick reference for every KPI including its group, formula, and goal direction (UTB or LTB).
Keep your whole team on the same page.
🛠️ Fully Customizable Layout
Change KPI names, groups, and calculations as per your IT environment or startup model.
No locked cells—full freedom!
📂 What’s Inside the IT & Tech KPI Dashboard
This dashboard comes with 7 well-structured worksheets, each serving a specific purpose:
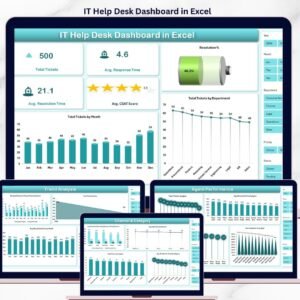
1️⃣ Home Sheet – Launchpad with shortcut buttons to each tab
2️⃣ Dashboard Sheet – The main visualization screen with month selectors
3️⃣ KPI Trend Sheet – View historical MTD/YTD charts for any KPI
4️⃣ Actual Numbers Sheet – Input your current performance metrics
5️⃣ Target Sheet – Record your monthly and yearly KPI goals
6️⃣ Previous Year Sheet – Compare growth with last year’s data
7️⃣ KPI Definition Sheet – Reference formulas and definitions
All sheets are interlinked for real-time data flow and automatic dashboard updates.
🚀 How to Use the IT KPI Dashboard Effectively
🔹 Step 1: Go to the Actual Numbers sheet and input your monthly MTD/YTD values
🔹 Step 2: Fill the Target Sheet with your defined KPI goals
🔹 Step 3: Add last year’s performance in the Previous Year Sheet
🔹 Step 4: Navigate to the Dashboard, select a month, and view instant visual updates
🔹 Step 5: Explore trends in the KPI Trend Sheet for strategic planning
No need for formulas—just plug in your numbers and let the dashboard do the rest!
👨💻 Who Can Benefit from This Product?
This dashboard is perfect for:
🧑💼 IT Managers – Monitor infrastructure uptime, SLA compliance, and incident rates
🚀 Tech Startups – Track user growth, deployment velocity, and bug resolution rates
🧠 Data Analysts – Build monthly reports without complex BI tools
📊 Project Leaders – Measure delivery KPIs and milestone achievements
🧑💻 CTOs and CIOs – Present high-level performance metrics in meetings
If you work in tech or manage digital operations—this dashboard is your command center.
🔗 Click here to read the Detailed blog post
🎥 Visit our YouTube channel to learn step-by-step video tutorials


Reviews
There are no reviews yet.