In today’s high-speed digital world, staying ahead in tech isn’t just about the tools—it’s about the talent. The IT and Tech Training and Development KPI Dashboard in Excel is the ultimate tool for HR managers, IT leaders, and training coordinators looking to measure the real impact of employee training. Say goodbye to manual tracking and hello to a seamless, data-driven performance dashboard.
Designed in Excel for flexibility, this ready-to-use dashboard allows you to visualize critical training KPIs, analyze trends, and drive continuous improvement—all without expensive software or a steep learning curve.
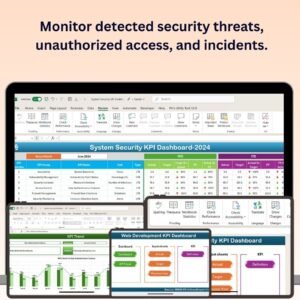
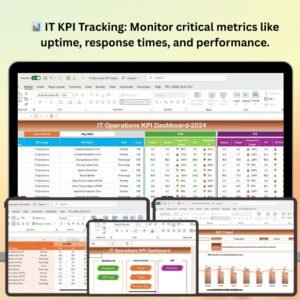
✨ Key Features of IT and Tech Training KPI Dashboard
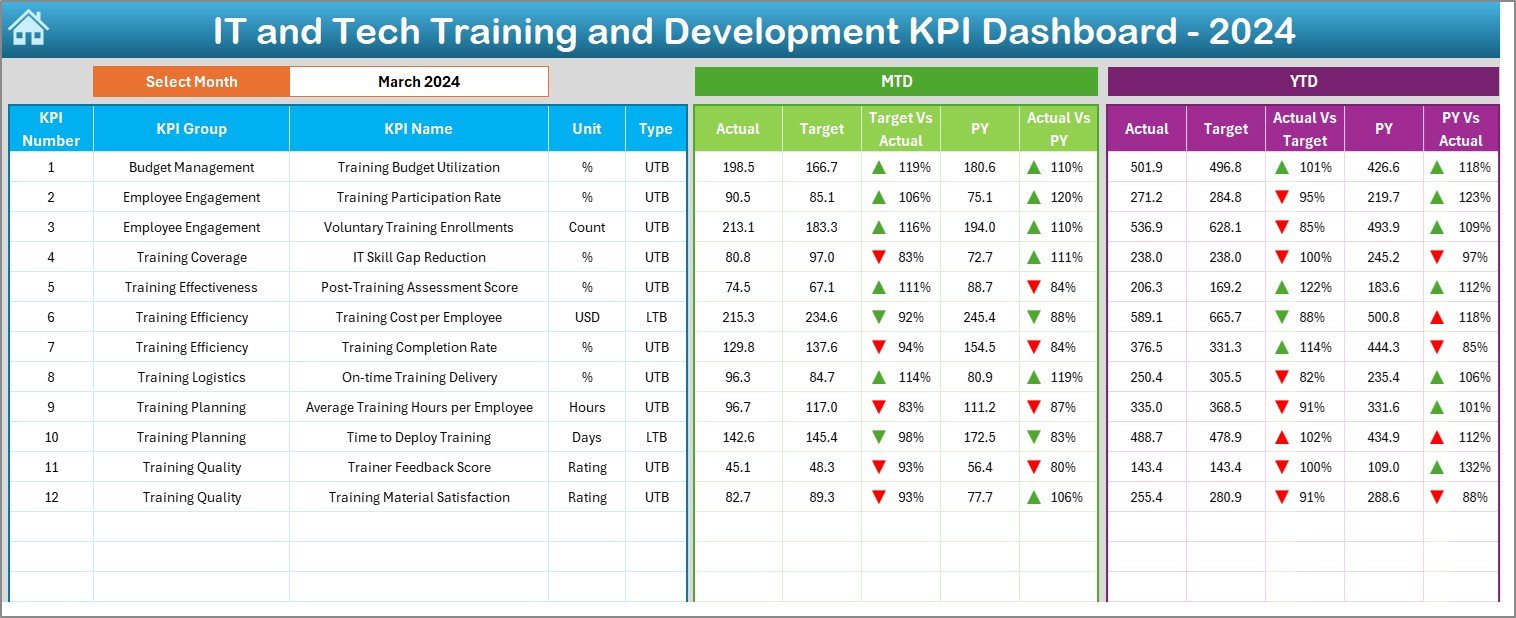
✅ Interactive Dashboard Sheet
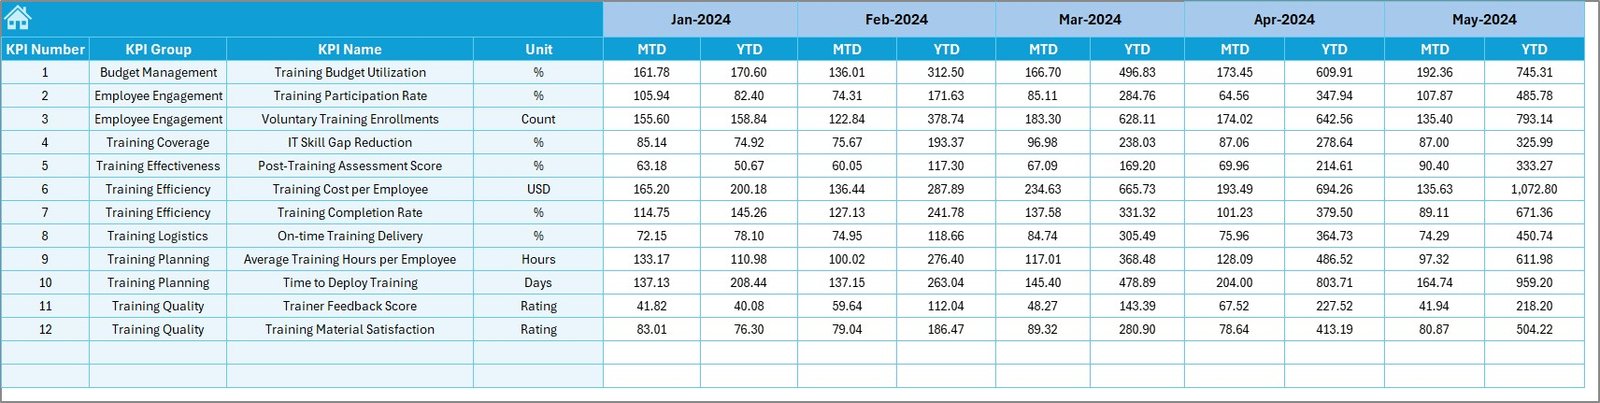
Choose any month from a drop-down and instantly view performance metrics with MTD (Month-to-Date) and YTD (Year-to-Date) comparisons.
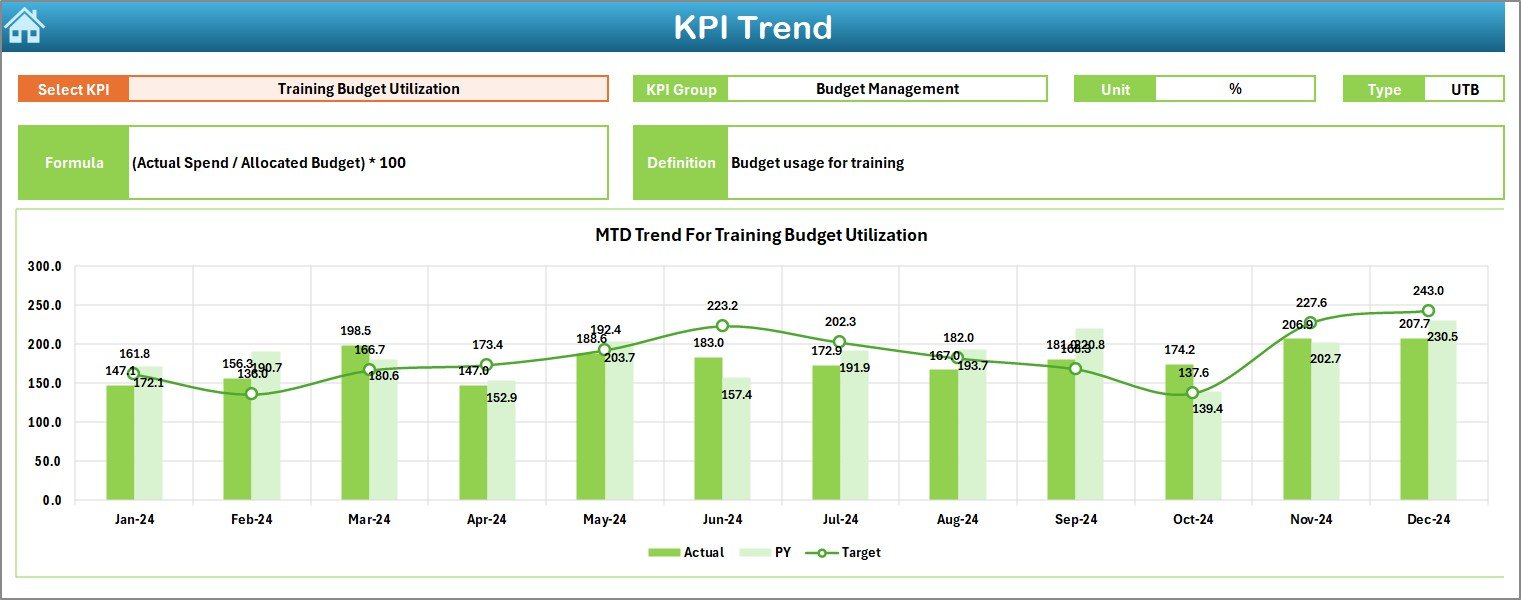
📈 KPI Trend Analysis
Dive deep into individual KPIs—track MTD vs. YTD trends, compare with targets and previous year, and see beautiful line charts.
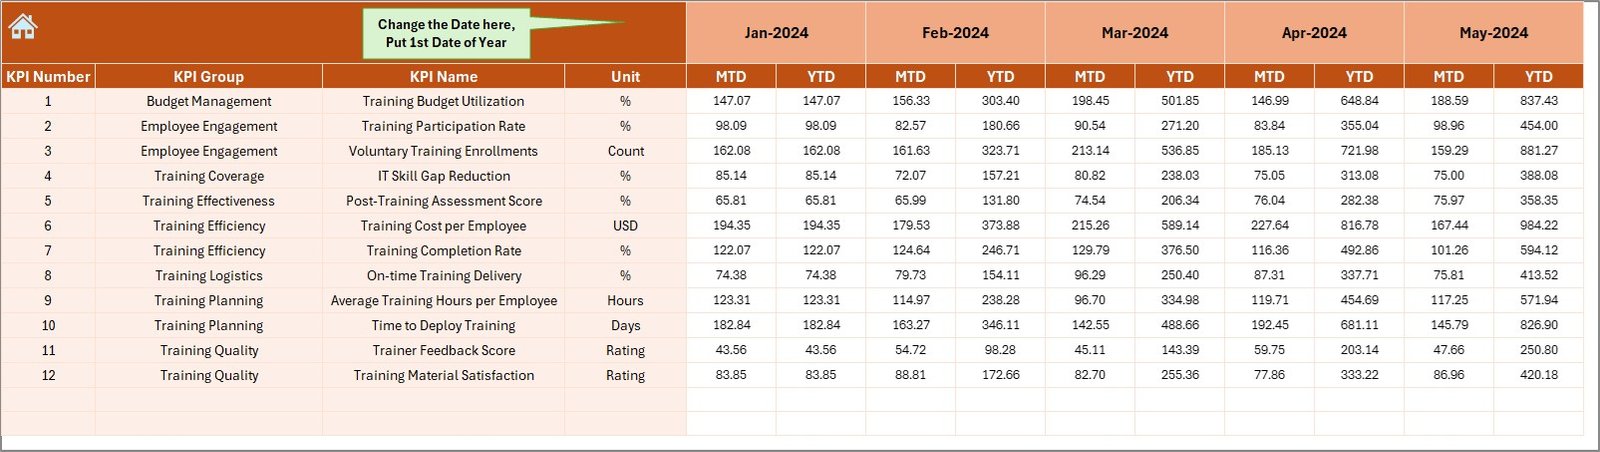
🧾 Actual, Target, and PY Sheets
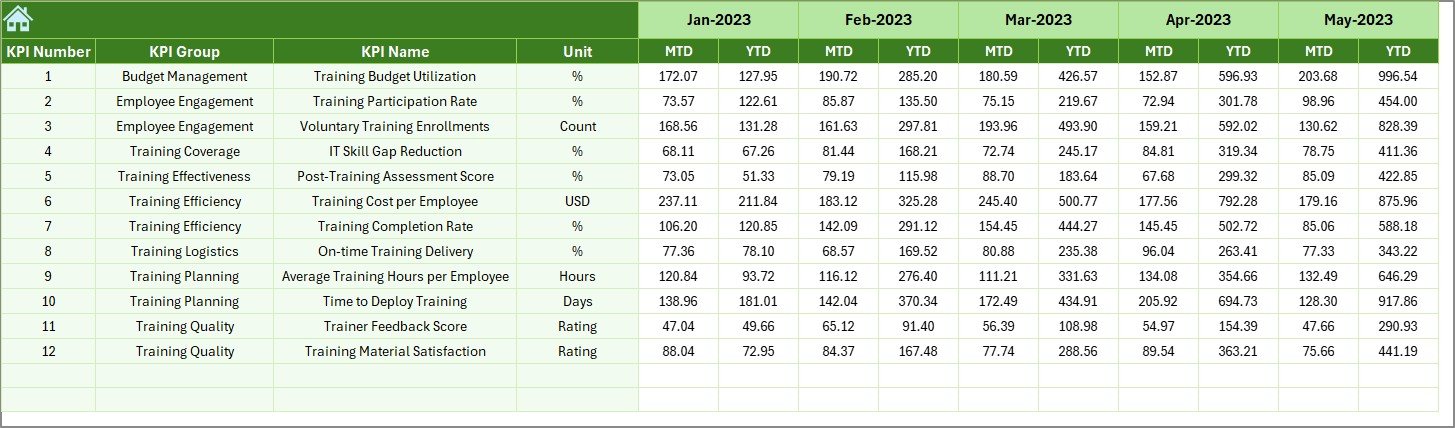
Input actual data, set training goals, and review last year’s results side-by-side.
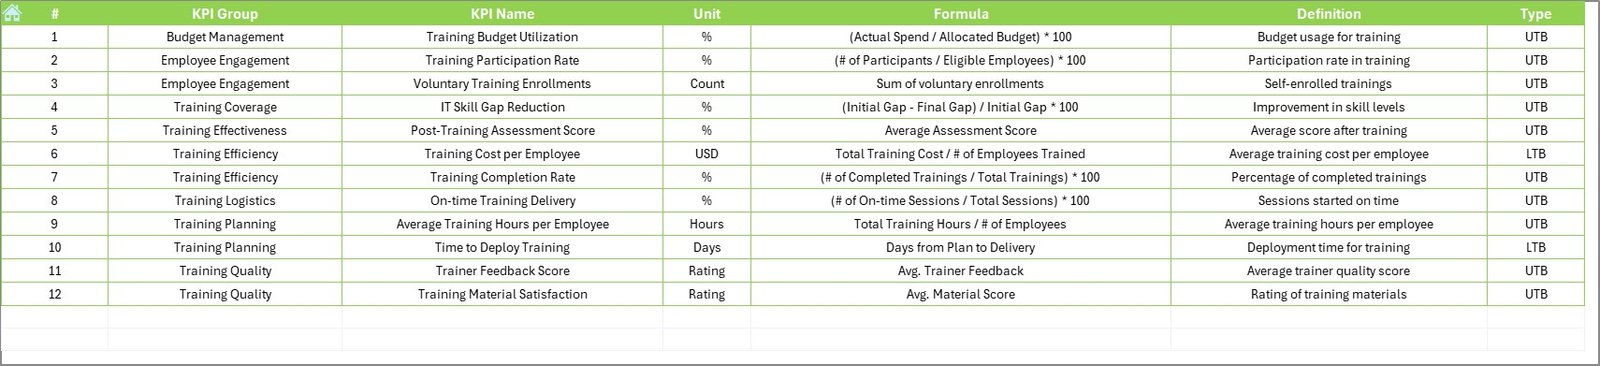
🎯 KPI Definition Sheet
Never get confused—every KPI comes with a unit, formula, and a short definition, including UTB/LTB tags.
🖥️ 100% Excel-Based
No need for special tools. Built entirely in Excel, so you can use it right away—customize it as you like.
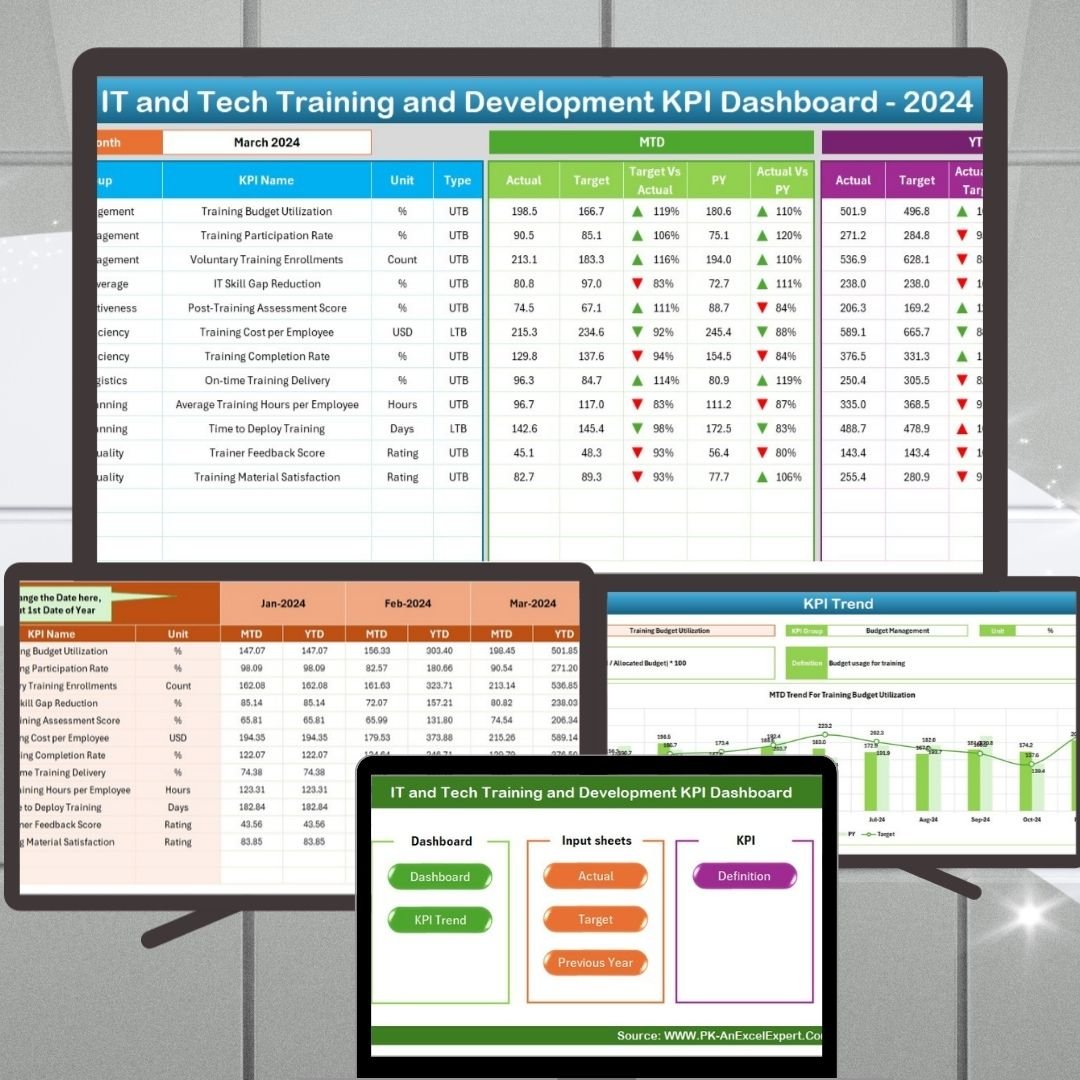
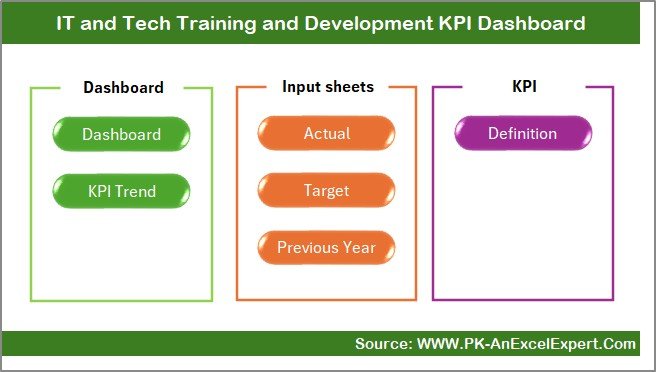
📦 What’s Inside the IT & Tech Training KPI Dashboard
-
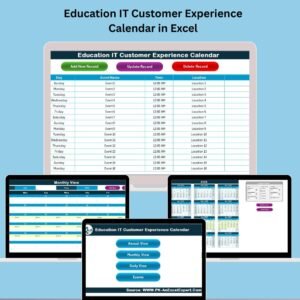
🏠 Home Sheet: Quick navigation buttons to access all dashboard components
-
📊 Dashboard Sheet: View KPIs with dropdown-based month filter
-
📉 KPI Trend Sheet: Deep-dive into one KPI at a time
-
📝 Actual Numbers Sheet: Enter MTD and YTD values monthly
-
🎯 Target Sheet: Define monthly goals for all training KPIs
-
🕰 Previous Year Sheet: Compare historical values to track progress
-
📚 KPI Definition Sheet: Know exactly what each metric means and how it’s calculated
🧑💻 How to Use the IT Training Dashboard
-
🔽 Select the Month from the dropdown on the Dashboard tab
-
✍️ Fill in actual values in the “Actual Numbers Input” sheet
-
🎯 Set monthly targets in the “Target Sheet”
-
🔍 Choose a KPI in the “KPI Trend” tab to analyze its trend
-
📊 Use conditional formatting cues (arrows, colors) to identify performance
-
🔧 Customize KPIs, formulas, or months as needed—100% editable!
👥 Who Can Benefit from This Dashboard?
-
👨💼 HR Managers – Track training ROI and employee development metrics
-
💼 IT Team Leads – Measure certification progress and training efficiency
-
📅 L&D Coordinators – Stay aligned with training schedules and completion rates
-
🧑🎓 Corporate Trainers – See what’s working and what needs fixing
-
🏢 SMEs & Startups – Affordable yet powerful solution without extra software costs
🔗 Click here to read the Detailed blog post
📺 Visit our YouTube channel to learn step-by-step video tutorials


Reviews
There are no reviews yet.