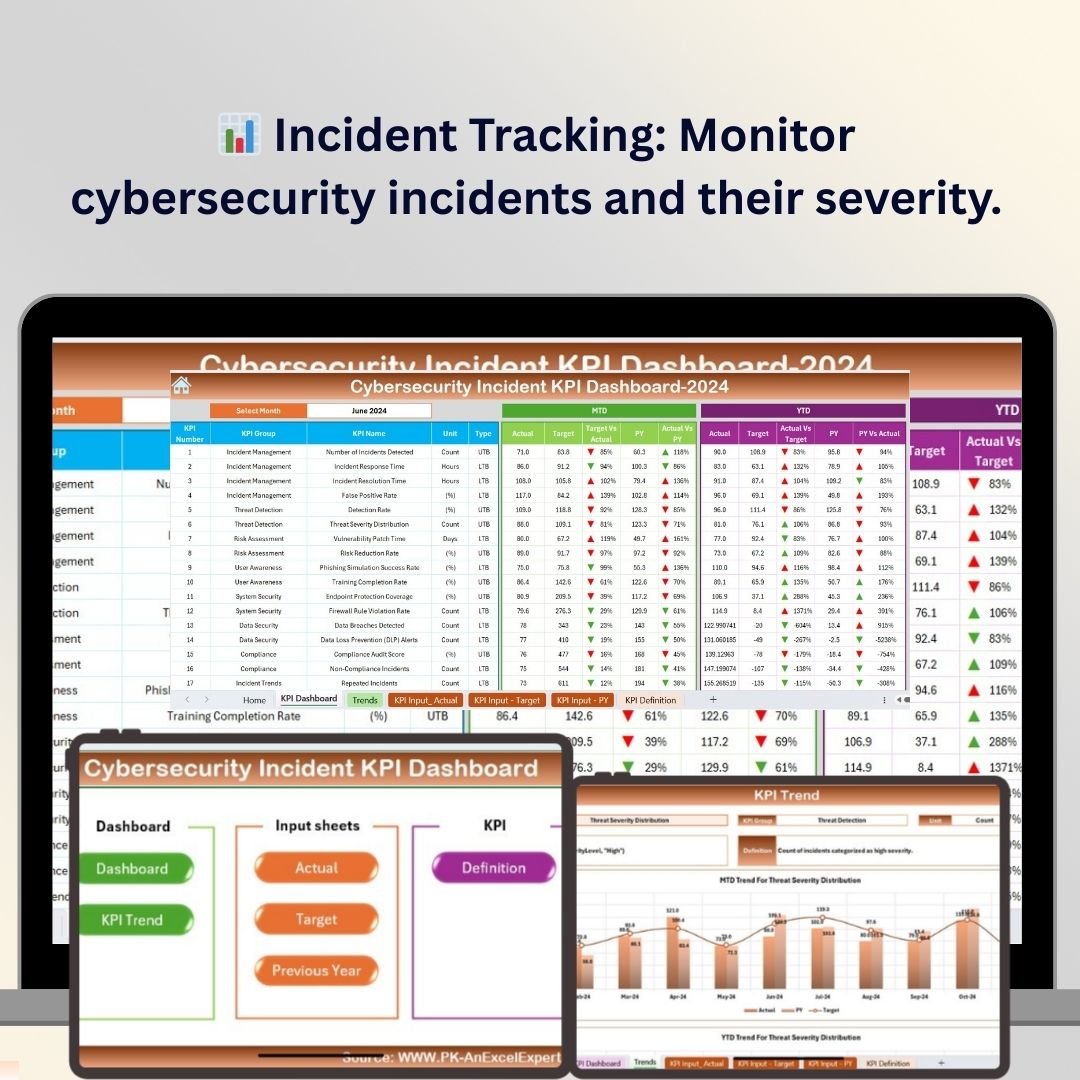
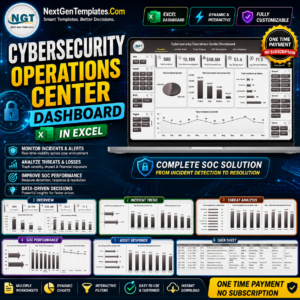
The Cybersecurity Incident KPI Dashboard in Excel is an essential tool for IT security teams and organizations to monitor and track cybersecurity incidents effectively. This Excel-based dashboard enables businesses to analyze key metrics such as incident response time, severity, resolution status, and overall cybersecurity effectiveness. By offering detailed insights into the lifecycle of security incidents, this dashboard helps ensure that your team can react quickly, mitigate risks, and improve future security measures.
Designed for simplicity and ease of use, this dashboard tracks real-time data and helps you assess the impact of security incidents, enabling your team to identify trends, improve response protocols, and reduce potential risks. Whether you’re handling incidents across multiple systems, networks, or departments, this dashboard offers a comprehensive view of your cybersecurity landscape.
Key Features of the Cybersecurity Incident KPI Dashboard in Excel
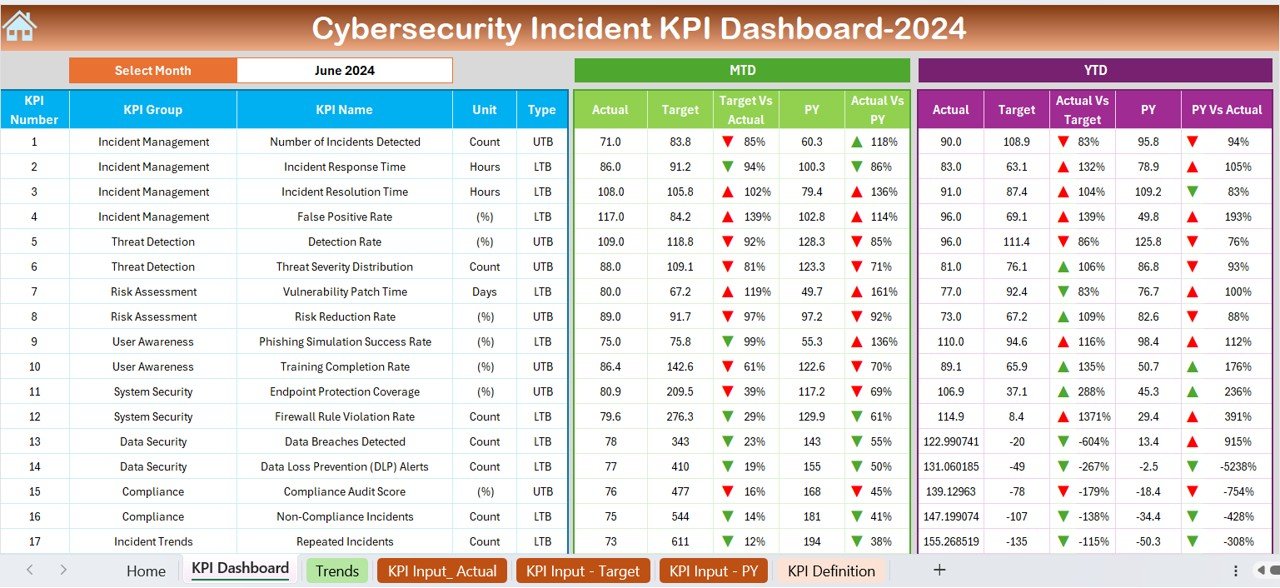
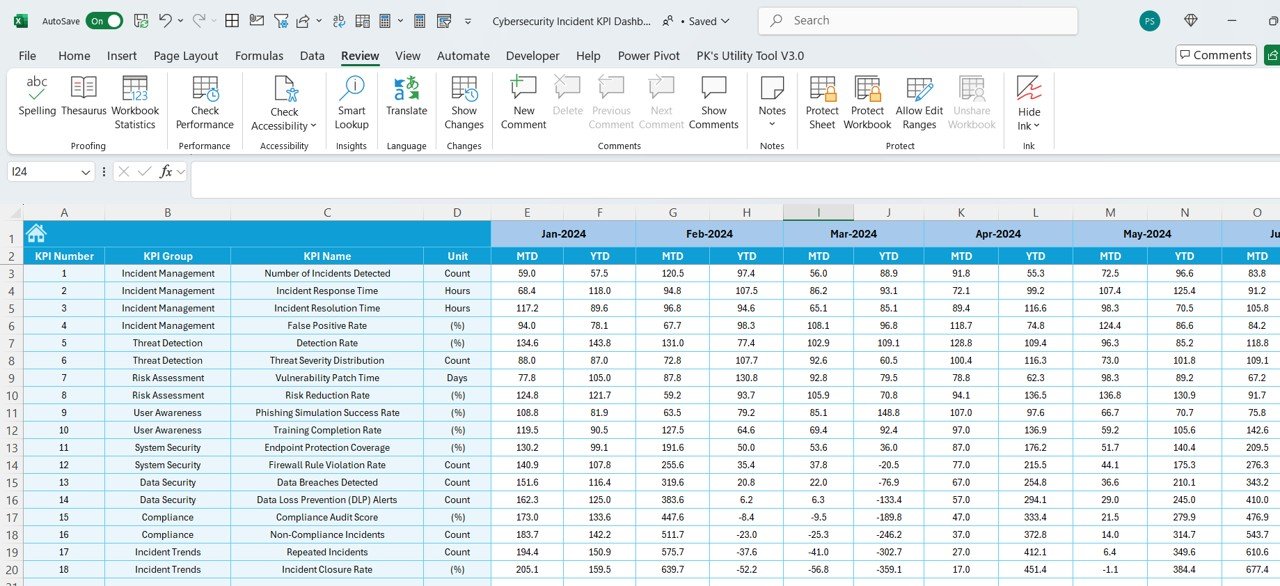
📊 Incident Tracking & Severity Classification
Track key cybersecurity incidents, classify them based on severity levels, and monitor the progress of incident resolution. This helps prioritize critical issues and ensure prompt action.
⏱ Incident Response Time Monitoring
Measure the time it takes from detecting a security incident to its resolution. Monitor response time performance to assess the effectiveness of your incident response protocols.
📝 Resolution Status & Action Plan Tracking
Track incident resolutions and ensure all action plans are followed through. This feature helps ensure that incidents are resolved properly and documented for compliance and auditing purposes.
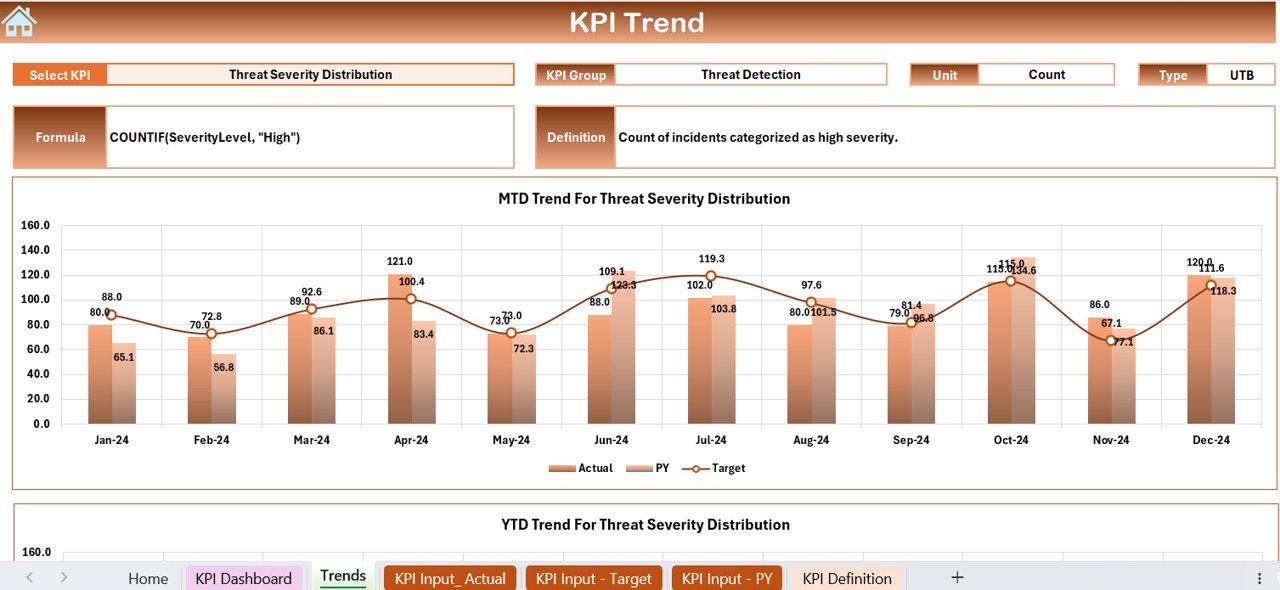
📉 Incident Frequency & Trend Analysis
Monitor the frequency of incidents over time, detect recurring threats, and analyze trends. Use this information to identify weak points in your security systems and make data-driven improvements.
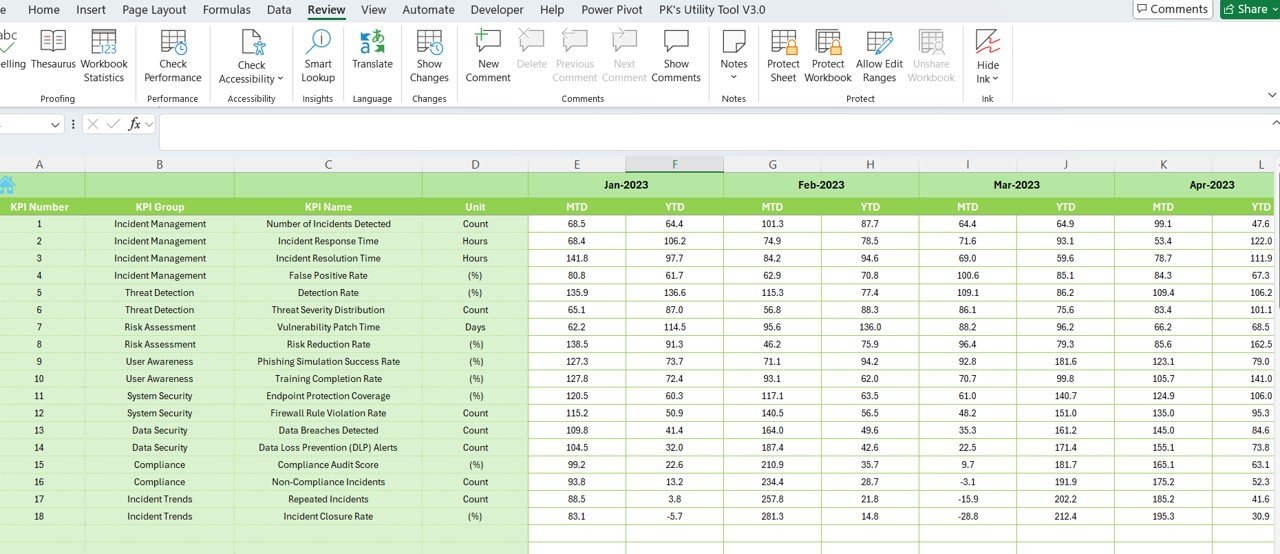
📅 Time-Based Incident Analysis
Analyze incidents over different time periods (weekly, monthly, quarterly) to track trends and see if security performance is improving or if vulnerabilities are increasing.
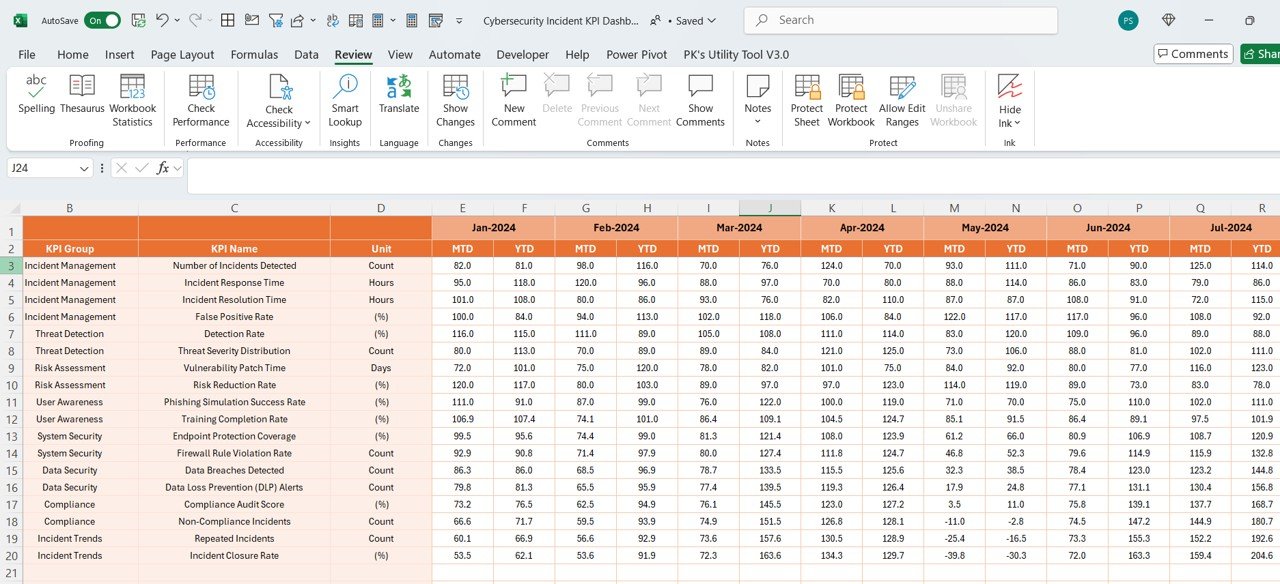
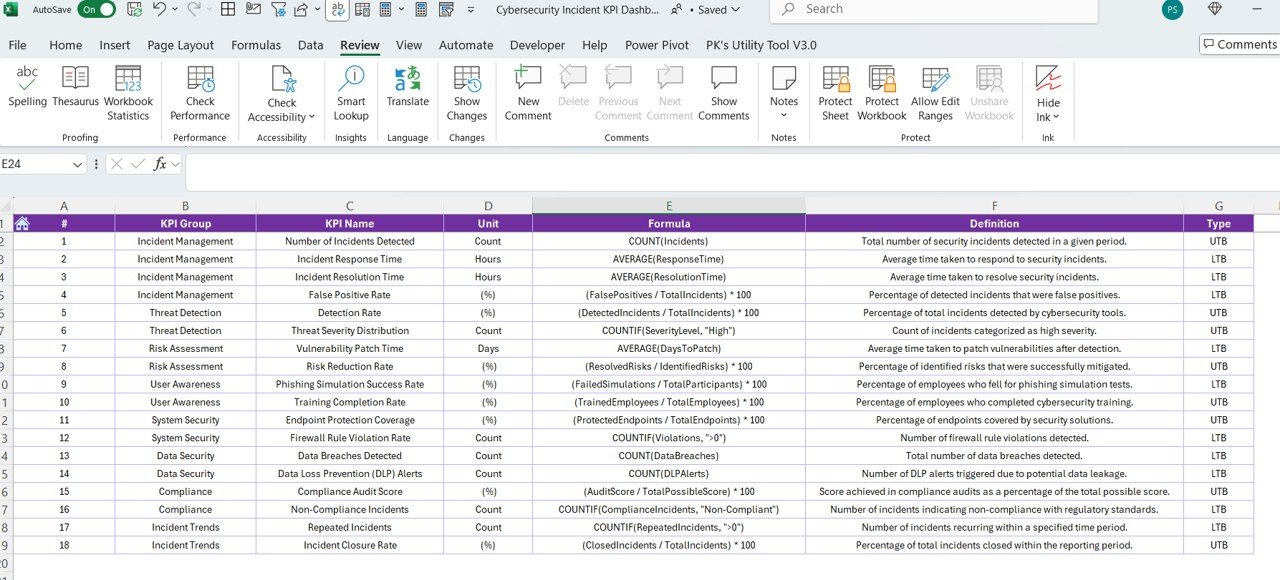
⚙️ Customizable KPIs & Metrics
Customize the dashboard to fit your specific cybersecurity goals and objectives. You can modify severity levels, response times, and reporting periods to tailor the tool to your organization’s needs.
Why You’ll Love the Cybersecurity Incident KPI Dashboard in Excel
✅ Comprehensive Incident Tracking
Track all security incidents and monitor their resolution progress from detection to closure, ensuring no incident goes unnoticed or unresolved.
✅ Optimize Incident Response Time
Monitor your response time to incidents and optimize your procedures to reduce the time it takes to resolve threats and minimize impact.
✅ Enhance Security & Risk Management
By analyzing incident frequency and severity, improve your cybersecurity posture, address recurring issues, and implement stronger security measures.
✅ Data-Driven Decision Making
Utilize incident reports and trend analysis to make informed decisions about your cybersecurity policies and identify areas for improvement in your system defenses.
✅ Customizable for Any Organization
This dashboard is highly customizable and scalable, allowing you to adapt it to any size organization or specific cybersecurity needs, ensuring it suits your team’s unique processes.
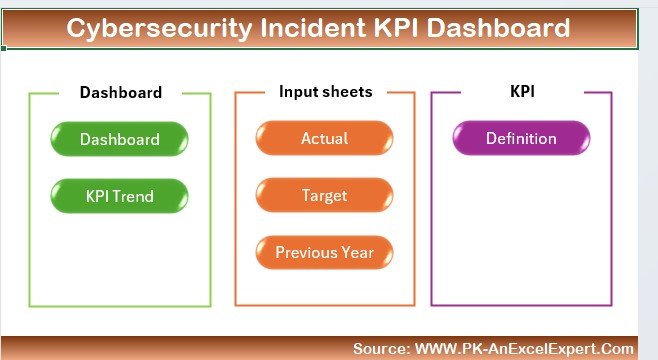
What’s Inside the Cybersecurity Incident KPI Dashboard in Excel?
-
Incident Tracking & Severity Classification: Classify and monitor cybersecurity incidents by severity.
-
Incident Response Time Monitoring: Track response time to resolve incidents.
-
Resolution Status & Action Plan: Monitor resolution status and action plan execution.
-
Incident Frequency & Trend Analysis: Analyze trends and identify recurring issues.
-
Customizable KPIs & Metrics: Tailor the dashboard to track the KPIs most relevant to your organization’s cybersecurity objectives.
How to Use the Cybersecurity Incident KPI Dashboard in Excel
1️⃣ Download the Template: Get instant access to the Cybersecurity Incident KPI Dashboard in Excel.
2️⃣ Input Incident Data: Enter key incident details, including detection time, severity, and resolution status.
3️⃣ Monitor KPIs & Performance: Track incident response times, resolution progress, and trend analysis.
4️⃣ Analyze Data & Trends: Use time-based analysis to uncover recurring incidents and vulnerabilities.
5️⃣ Optimize Your Cybersecurity Strategy: Make data-driven decisions to improve your organization’s security systems and reduce risk.
Who Can Benefit from the Cybersecurity Incident KPI Dashboard in Excel?
🔹 IT Security Teams
🔹 Cybersecurity Analysts
🔹 Risk & Compliance Managers
🔹 Business Continuity Managers
🔹 Small & Medium Enterprises (SMBs)
🔹 Large Corporations with Dedicated Security Teams
🔹 Security Operations Centers (SOCs)
Ensure your organization’s cybersecurity is proactive and effective with the Cybersecurity Incident KPI Dashboard in Excel. Track incidents, monitor resolution progress, and analyze trends to improve your security response strategy.
Click here to read the Detailed blog post
Visit our YouTube channel to learn step-by-step video tutorials
Youtube.com/@PKAnExcelExpert


Reviews
There are no reviews yet.