The Cloud Migration KPI Dashboard in Excel is a powerful tool designed to help organizations efficiently manage and track their cloud migration projects. As businesses move their operations to the cloud, this Excel-based dashboard provides an easy way to monitor key performance indicators (KPIs), track progress, and ensure a smooth transition. The dashboard offers real-time insights into cloud migration performance, helping project managers, IT teams, and business owners stay on track and make informed decisions.
Whether you’re migrating data, applications, or entire business operations to the cloud, this KPI dashboard helps you manage the complexity and ensure that the process is completed on time and within budget. It also provides the necessary tools to evaluate risks, track costs, and improve cloud adoption.
Key Features of the Cloud Migration KPI Dashboard in Excel
📊 Cloud Migration Progress Tracking
Monitor the overall progress of your cloud migration project, from initial planning to final deployment. Track key milestones and ensure that each phase is completed according to schedule.
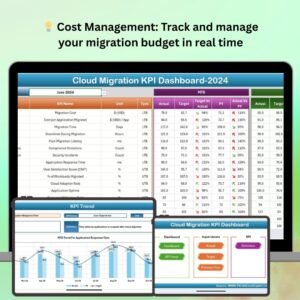
💡 Cost Tracking & Budget Management
Keep track of the costs associated with cloud migration, including infrastructure, software, and labor costs. Ensure that the project stays within budget by monitoring expenses in real time.
🔄 Risk & Issue Management
Track potential risks and issues that may arise during the migration process. Use the dashboard to document risks, assign responsibilities, and monitor the resolution of issues as they occur.
📈 Performance Metrics & KPIs
Measure key performance indicators such as data transfer speed, application performance post-migration, and cloud resource utilization. This helps you assess the success of the migration and optimize cloud usage.
🕒 Time-Based Analysis
Track project timelines and deadlines to ensure that cloud migration tasks are completed on schedule. Use time-based performance tracking to identify delays and take corrective action.
⚙️ Customizable Dashboard
Customize the dashboard to suit your specific cloud migration needs. Add or modify KPIs, metrics, and tracking categories to align with your project’s requirements.
Why You’ll Love the Cloud Migration KPI Dashboard in Excel

✅ Comprehensive Project Monitoring
Track the entire cloud migration process from start to finish. Monitor timelines, budgets, and risks all in one place for efficient management.
✅ Ensure Cost Control
Keep your cloud migration within budget by tracking expenses and comparing them against allocated funds, helping prevent cost overruns.
✅ Manage Risks & Resolve Issues
Stay ahead of potential risks and issues by tracking them in real time. Assign responsibilities and ensure that any problems are resolved quickly.
✅ Optimize Cloud Resources
Monitor cloud resource utilization and performance to ensure efficient use of resources. Make data-driven decisions to optimize cloud costs and performance.
✅ Customizable & Scalable
The dashboard is fully customizable to meet your organization’s specific needs and scalable to suit small to large-scale cloud migration projects.
What’s Inside the Cloud Migration KPI Dashboard in Excel?
-
Cloud Migration Progress Tracking: Track each stage of the migration process.
-
Cost Tracking & Budget Management: Monitor expenses and ensure the project stays within budget.
-
Risk & Issue Management: Document and resolve potential risks and issues.
-
Performance Metrics & KPIs: Monitor key performance indicators like data transfer speed and cloud resource utilization.
-
Time-Based Analysis: Track migration timelines to ensure tasks are completed on schedule.
-
Customizable Features: Modify KPIs and metrics to match your specific cloud migration goals.
How to Use the Cloud Migration KPI Dashboard in Excel
1️⃣ Download the Template: Access the Cloud Migration KPI Dashboard in Excel instantly.
2️⃣ Input Your Project Data: Enter your cloud migration details, including milestones, costs, risks, and KPIs.
3️⃣ Track Migration Progress: Use the dashboard to monitor progress at each stage and identify any delays.
4️⃣ Monitor Costs & Budget: Track your expenses in real time and compare them with the budget.
5️⃣ Analyze & Optimize Cloud Usage: Use performance metrics to assess cloud resource utilization and make adjustments to improve efficiency.
Who Can Benefit from the Cloud Migration KPI Dashboard in Excel?
🔹 IT Teams & Project Managers
🔹 Cloud Solution Architects
🔹 Business Owners & Executives
🔹 Technology Consultants
🔹 Data & Application Migration Teams
🔹 Enterprises & Startups Undertaking Cloud Migration Projects
Ensure a smooth and successful cloud migration with the Cloud Migration KPI Dashboard in Excel. Track every aspect of your project, from cost management to performance optimization, and make data-driven decisions that improve your cloud adoption strategy.
Click here to read the Detailed blog post
Visit our YouTube channel to learn step-by-step video tutorials
Youtube.com/@PKAnExcelExpert










Reviews
There are no reviews yet.