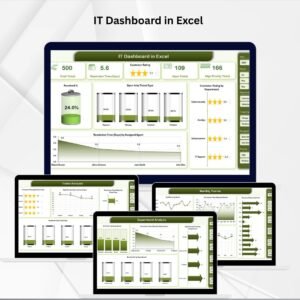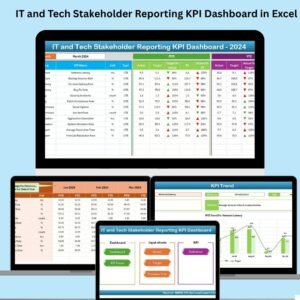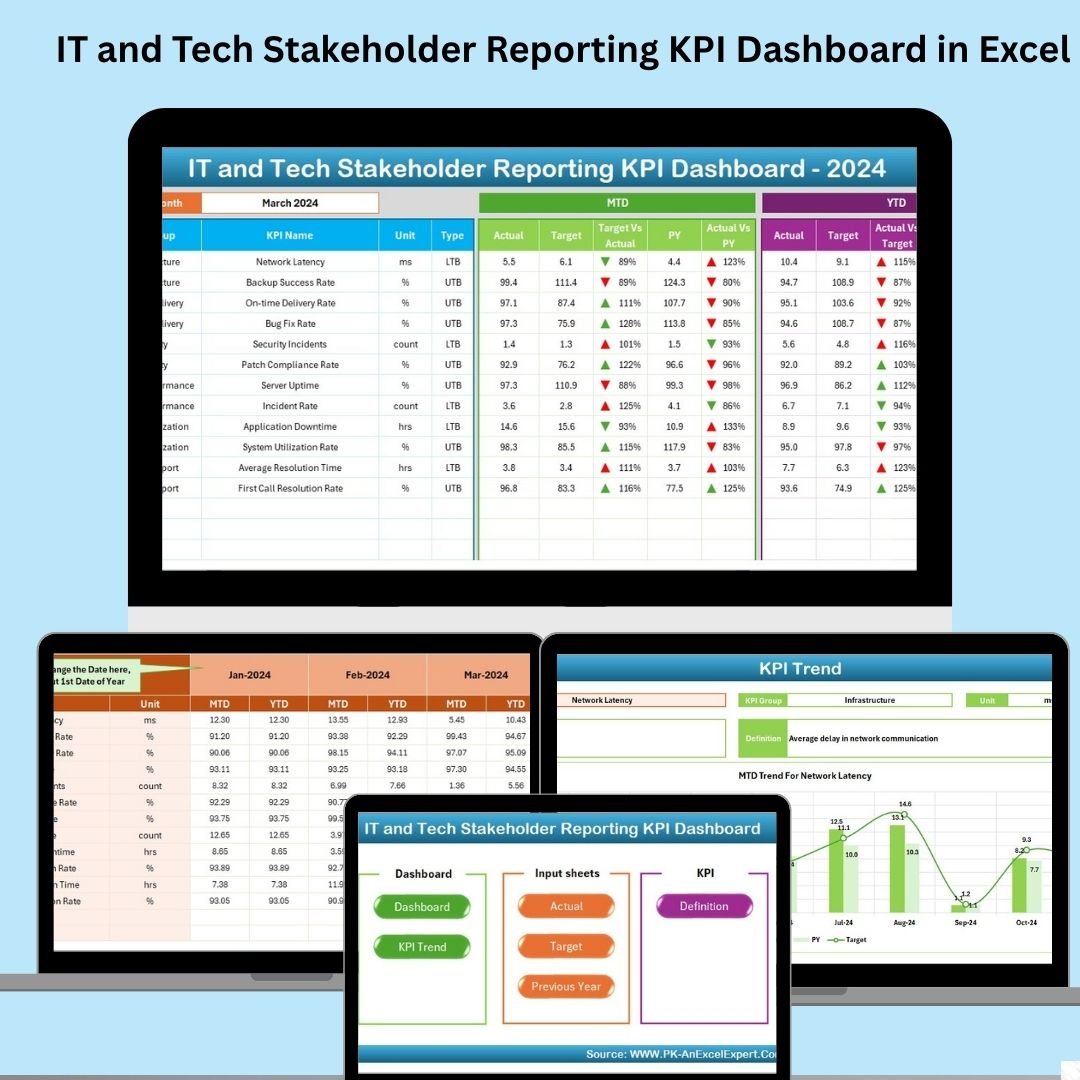
In the fast-paced world of IT and technology, performance reporting shouldn’t be overwhelming—it should be insightful and immediate. That’s why we created the IT and Tech Stakeholder Reporting KPI Dashboard in Excel. Designed to simplify reporting for tech teams, this ready-to-use Excel-based tool helps you present your KPIs clearly, visually, and professionally to internal or external stakeholders. 🧠📊
Whether you’re a CIO, IT manager, analyst, or project lead, this dashboard gives you a reliable, visual, and structured way to track monthly and year-to-date (YTD) performance—no Power BI or complex tools needed. With built-in automation, drop-down selections, dynamic charts, and intuitive formatting, you’ll have all your data at your fingertips.
✨ Key Features of IT and Tech Stakeholder Reporting KPI Dashboard
🏠 Home Sheet – Your Launchpad
Includes 6 clickable buttons to instantly navigate to any part of the dashboard. No scrolling or searching.
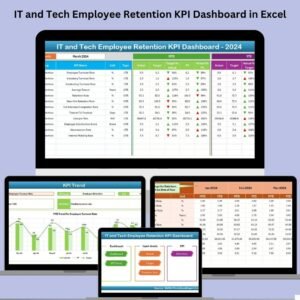
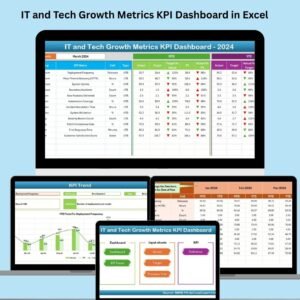
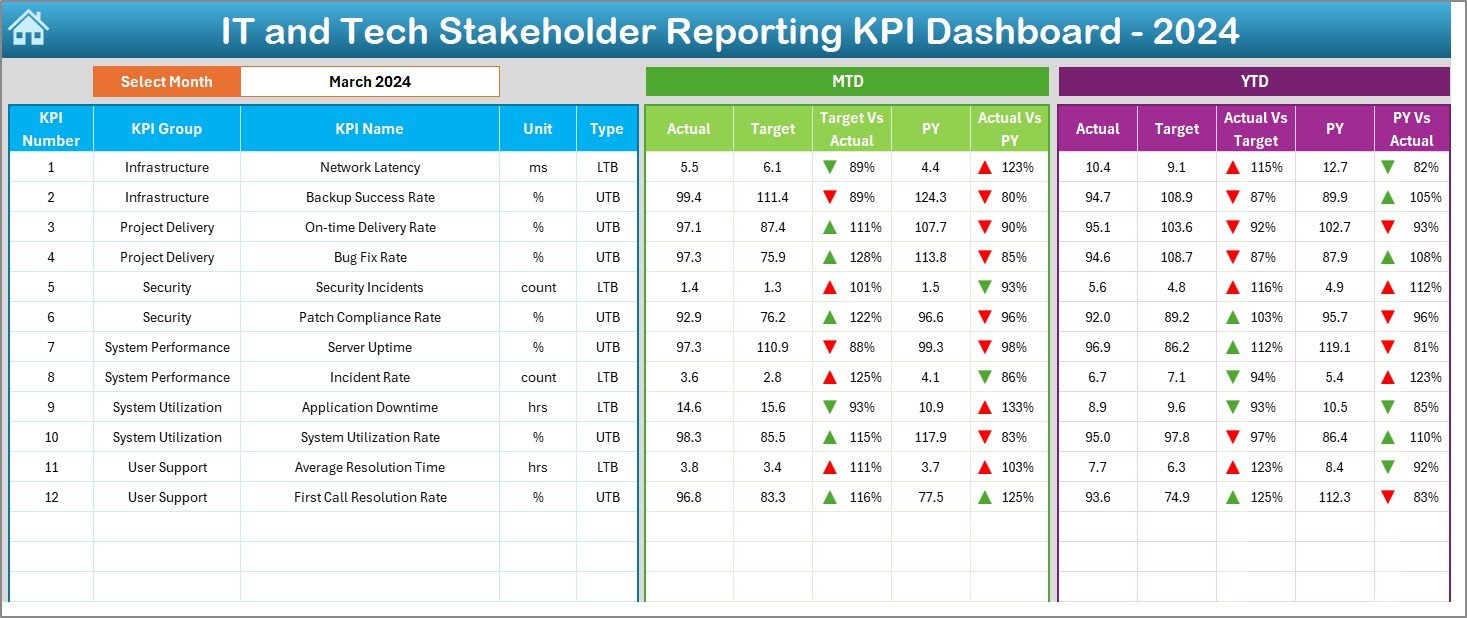
📊 Dashboard Sheet – Monthly and YTD View
Select any month using the drop-down menu
View MTD and YTD values: Actual, Target, Previous Year
✅ Green/Red arrows highlight performance trends
Perfect for leadership reviews and monthly reporting
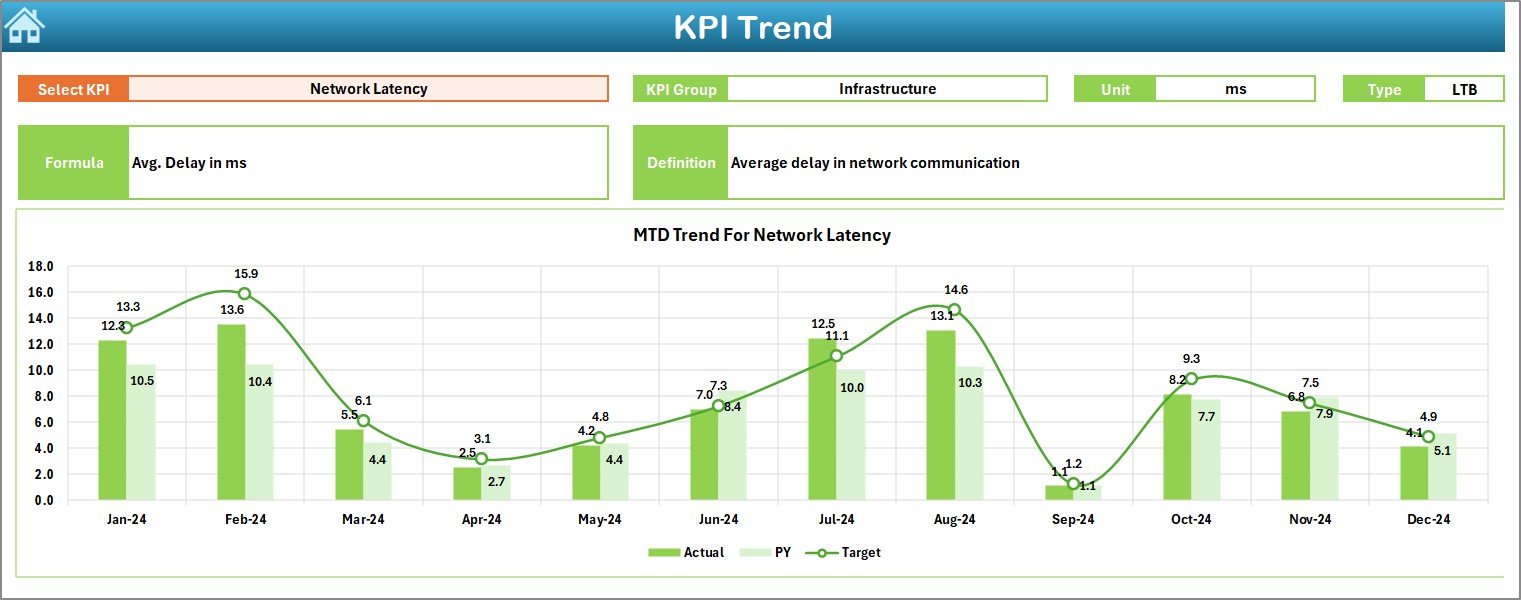
📈 KPI Trend Sheet – See the Bigger Picture
Choose any KPI from a drop-down
View MTD and YTD performance trends
Automatically updates with charts for Actual vs Target vs Previous Year
Easily identify improvements or problem areas over time
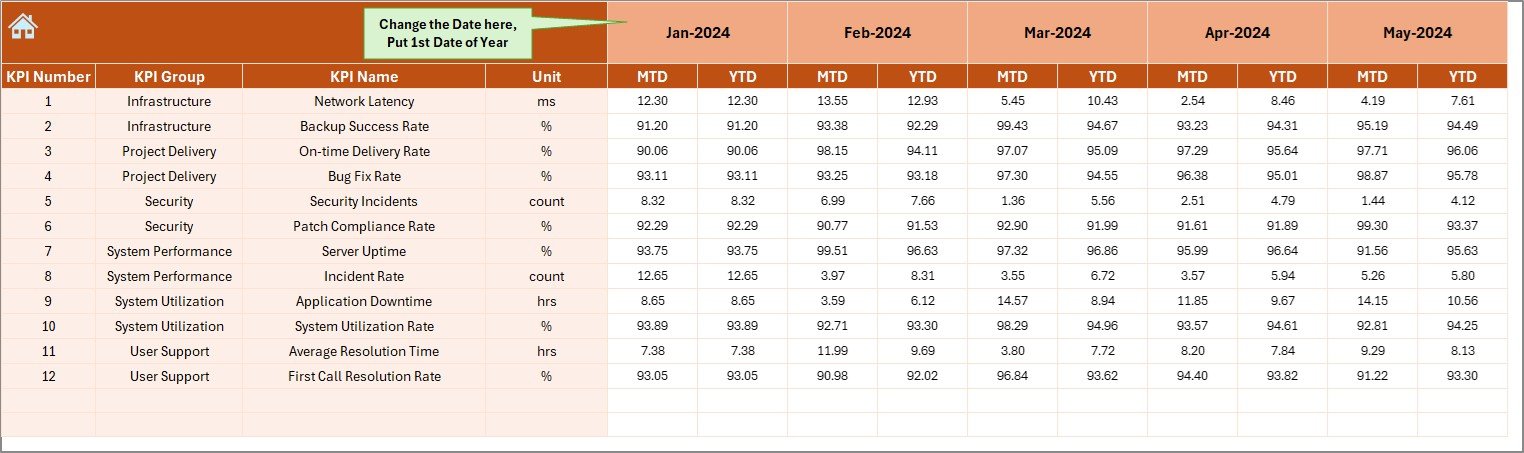
🧾 Actual Numbers Input Sheet – Real-Time Data Entry
Input actual MTD and YTD values per month
Flexible design supports custom fiscal years
Automatically feeds the dashboard visuals
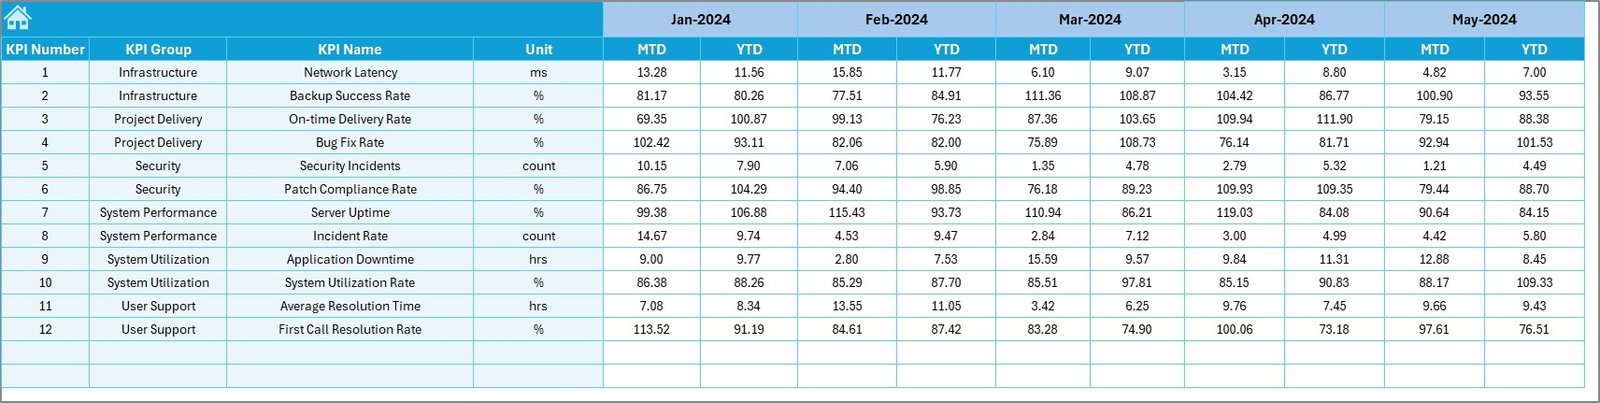
🎯 Target Sheet – Set Benchmarks
Enter monthly and YTD targets for each KPI
The dashboard pulls these benchmarks to measure real-time performance
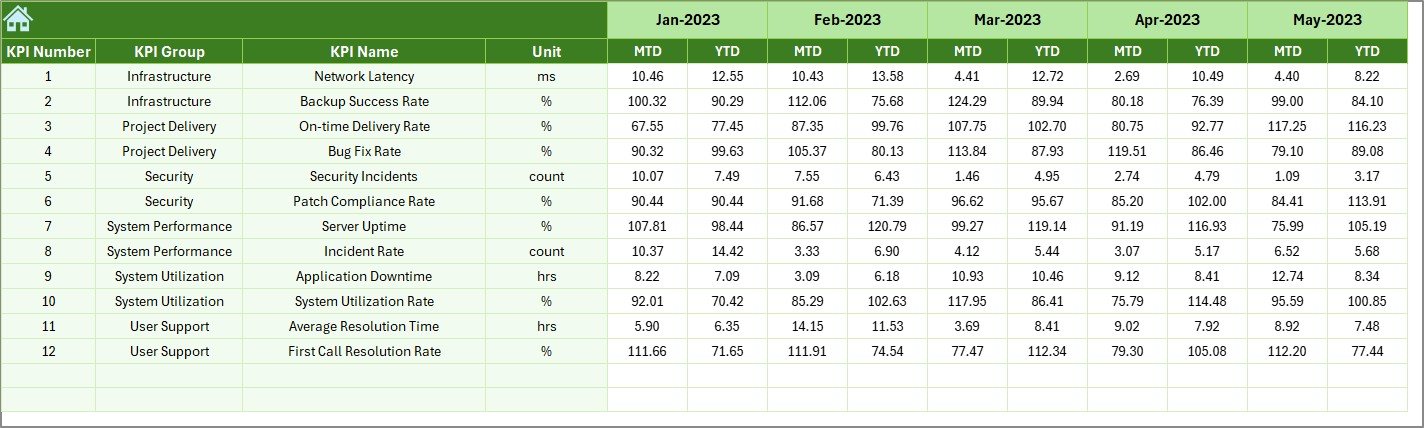
📆 Previous Year Sheet – Year-over-Year Comparison
Input historical data for each KPI
Instantly compare current year vs last year performance across KPIs
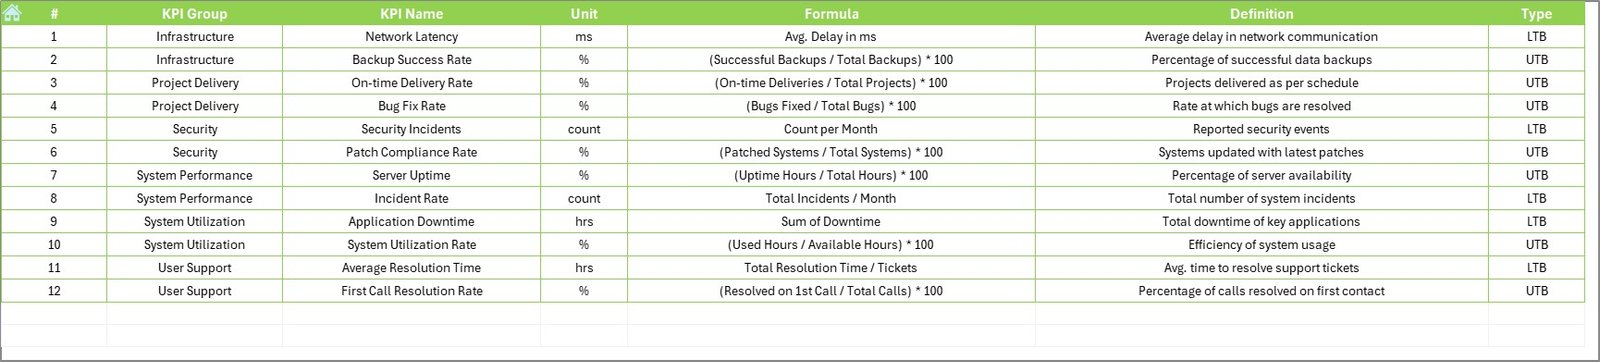
📘 KPI Definition Sheet – Clear Context
Define each KPI: Name, Unit, Formula, Group, Type (UTB/LTB)
Helps align understanding across teams and stakeholders
📂 What’s Inside the Excel Dashboard?
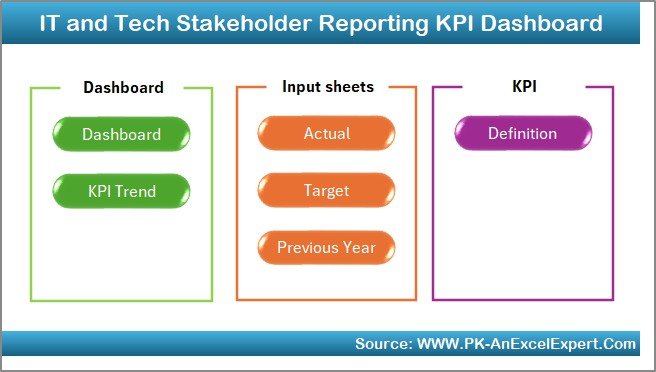
This complete dashboard comes with 7 fully integrated worksheets:
1️⃣ Home Sheet – Navigation panel
2️⃣ Dashboard Sheet – Monthly + YTD visual performance view
3️⃣ KPI Trend Sheet – Deep dive into KPI progress
4️⃣ Actual Numbers Input Sheet – Monthly actuals
5️⃣ Target Sheet – Set your performance goals
6️⃣ Previous Year Sheet – Historical reference data
7️⃣ KPI Definition Sheet – KPI documentation
All formulas are automated and interlinked for live updates. Just enter the data and let the dashboard do the rest.
👨💼 Who Can Benefit from This Product?
This tool is ideal for:
✅ IT Managers & CIOs – Present KPIs with clarity during board meetings
✅ Data Analysts – Deliver stakeholder reports without extra formatting
✅ Project Teams – Monitor deliverables against defined goals
✅ Startup Founders – Measure product deployment, uptime, user engagement
✅ Support & DevOps Teams – Track incident resolution, SLA compliance
If you’re looking to make tech reporting visual, quick, and executive-ready—this dashboard is built for you.
🔗 Click here to read the Detailed blog post
🎥 Visit our YouTube channel to learn step-by-step video tutorials