



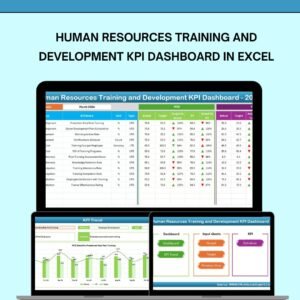
The Human Resources Training and Development KPI Dashboard in Excel is a comprehensive and powerful tool designed to help HR departments track, manage, and optimize employee training and development programs. This Excel-based dashboard provides valuable insights into key performance indicators (KPIs) such as employee participation rates, training effectiveness, skill development, and training costs, helping HR professionals make data-driven decisions to improve employee performance and organizational growth.
This dashboard is ideal for organizations of all sizes looking to streamline their HR training programs. Whether you’re tracking mandatory compliance training or development initiatives aimed at improving employee skills, this tool helps you monitor progress, assess ROI, and ensure training programs are achieving their intended outcomes.
Key Features of the Human Resources Training and Development KPI Dashboard in Excel
📊 Training Program Participation Tracking
Monitor employee participation in training programs, courses, and workshops. Track attendance and completion rates to ensure that employees are meeting their training requirements.
📈 Training Effectiveness & Feedback Monitoring
Track the effectiveness of training programs through post-training feedback and assessments. Measure the success of training initiatives and identify areas for improvement.
🧑🏫 Skill Development Tracking
Monitor employee progress in acquiring new skills. Measure how employees apply their new skills on the job and track improvements over time.
💸 Training Cost & Budget Monitoring
Track the costs associated with each training program and compare them against your budget. This feature helps HR teams control costs and ensure that training programs are cost-effective.
📅 Time-Based Training Performance Analysis
Assess training performance over different time periods (monthly, quarterly, yearly). This helps to identify trends in training participation, effectiveness, and employee development.
⚙️ Customizable KPIs & Metrics
Customize the dashboard to track the KPIs that are most relevant to your organization’s training and development goals, such as specific skill sets, training programs, or employee performance metrics.
Why You’ll Love the Human Resources Training and Development KPI Dashboard in Excel

✅ Streamline Training Program Management
Easily track training participation, completion rates, and effectiveness in one place, allowing HR teams to stay on top of employee development efforts.
✅ Improve Employee Skill Development
Track the progress of employee skill development and identify gaps in knowledge. Use insights from the dashboard to target specific areas for improvement.
✅ Optimize Training Budgets
Monitor training costs and compare them against your budget to ensure training programs are financially sustainable and cost-effective.
✅ Data-Driven Decisions for HR
Leverage data to make informed decisions about training investments and employee development initiatives. Measure the ROI of training programs and optimize resources.
✅ Customizable & Scalable
The dashboard is fully customizable and can scale to meet the needs of any organization, whether you’re managing a small team or a large workforce with complex training requirements.
What’s Inside the Human Resources Training and Development KPI Dashboard in Excel?
Training Participation Tracking: Monitor employee participation rates and completion statuses.
Training Effectiveness Monitoring: Track feedback and measure the effectiveness of training programs.
Skill Development Tracking: Monitor employee progress in acquiring new skills.
Training Cost & Budget Tracking: Track training costs and ensure programs stay within budget.
Time-Based Performance Analysis: Analyze training performance over different time periods.
Customizable KPIs & Metrics: Tailor the dashboard to fit your specific training goals.
How to Use the Human Resources Training and Development KPI Dashboard in Excel
1️⃣ Download the Template: Access the Human Resources Training and Development KPI Dashboard in Excel instantly.
2️⃣ Input Employee Training Data: Track employee participation, training programs, and feedback.
3️⃣ Monitor KPIs & Metrics: Use the dashboard to monitor key KPIs such as training effectiveness, skill development, and training costs.
4️⃣ Analyze Training Performance: Use time-based analysis to assess training performance and identify areas for improvement.
5️⃣ Optimize Training Programs: Make data-driven decisions to improve training programs and increase employee development.
Who Can Benefit from the Human Resources Training and Development KPI Dashboard in Excel?
🔹 HR & Training Managers
🔹 Learning & Development Teams
🔹 Employee Relations Specialists
🔹 Business Owners & Executives
🔹 Small & Medium Enterprises (SMBs)
🔹 Large Enterprises with Training Departments
🔹 Consultants & HR Professionals
Ensure your training and development programs are effective and efficient with the Human Resources Training and Development KPI Dashboard in Excel. Track participation, monitor skill development, and make informed decisions to improve employee performance and business growth.
Click here to read the Detailed blog post
Visit our YouTube channel to learn step-by-step video tutorials
Youtube.com/@PKAnExcelExpert
Compatibility and Requirements
- Works in Microsoft Excel desktop (Excel 2016 or later, or Microsoft 365).
- New to Excel? Microsoft offers free lessons in Excel for Windows training.
Frequently Asked Questions
What can I track with this dashboard?
You can track training participation and completion, training effectiveness and feedback, skill development, and training costs against your budget.
Can I look at results over different time periods?
Yes. The dashboard includes time-based performance analysis, so you can review training results by month, quarter or year.
Can I change the KPIs to fit my own training goals?
Yes. The KPIs and metrics are customizable, so you can track the skill sets, training programs or employee performance measures that matter to your organization.
Can I compare training spending with my budget?
Yes. You enter the cost of each training program and the dashboard compares it against your budget.
Is there a Power BI or Google Sheets version?
There is a Training and Development Dashboard in Power BI and a Training and Development Dashboard in Google Sheets.
Related HR and Training Templates
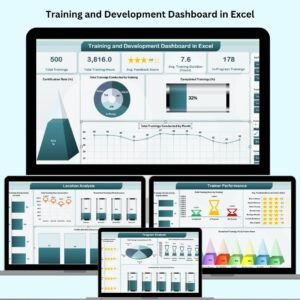
- Training and Development Dashboard in Excel: a general training dashboard in Excel
- Training and Development Report in Excel: a report layout for training results
- Training Resource Request Tracker in Excel: track requests for training resources
- Human Resources Employee Retention KPI Dashboard in Excel: another HR KPI view in Excel
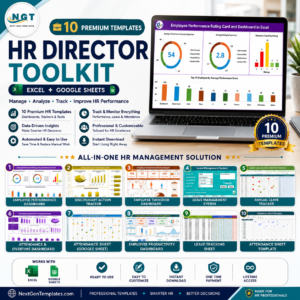
- HR Director Toolkit: 10 HR templates in one download
Browse all Excel KPI dashboards.





























Reviews
There are no reviews yet.