

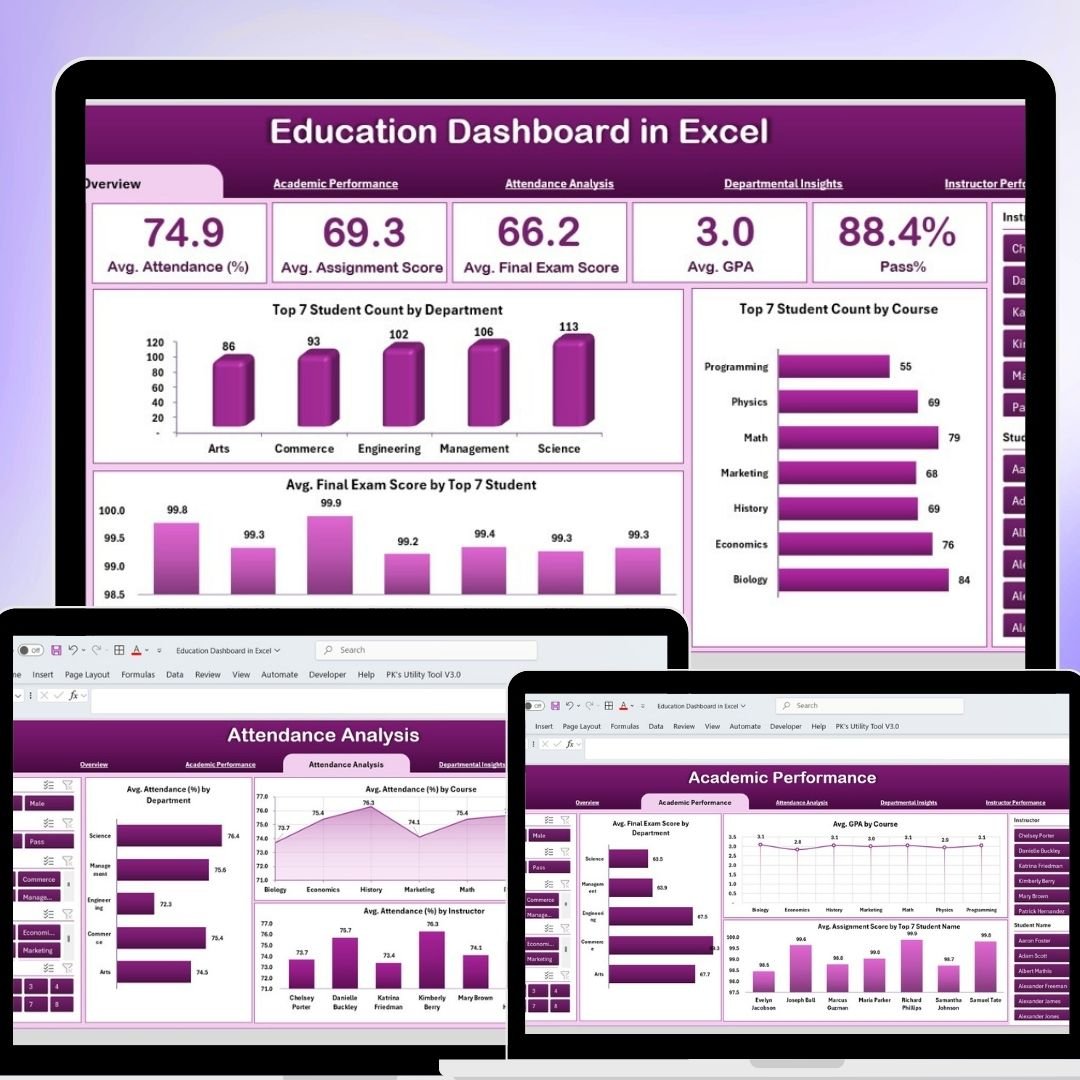
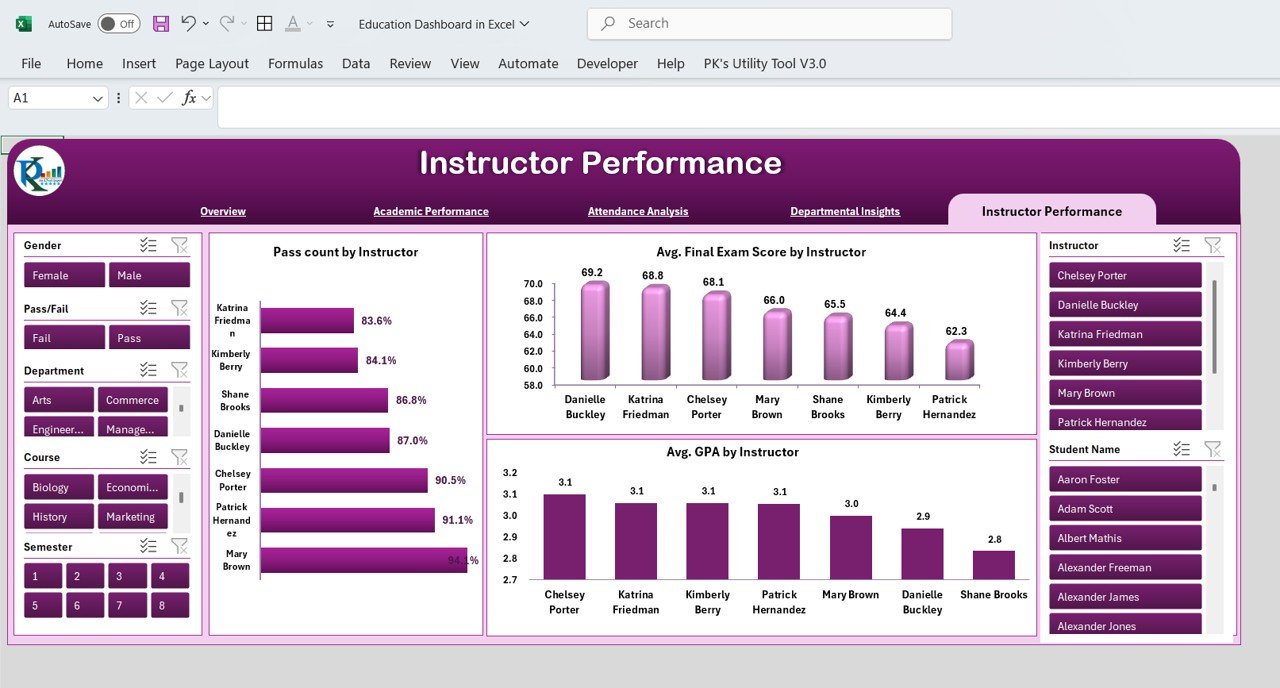


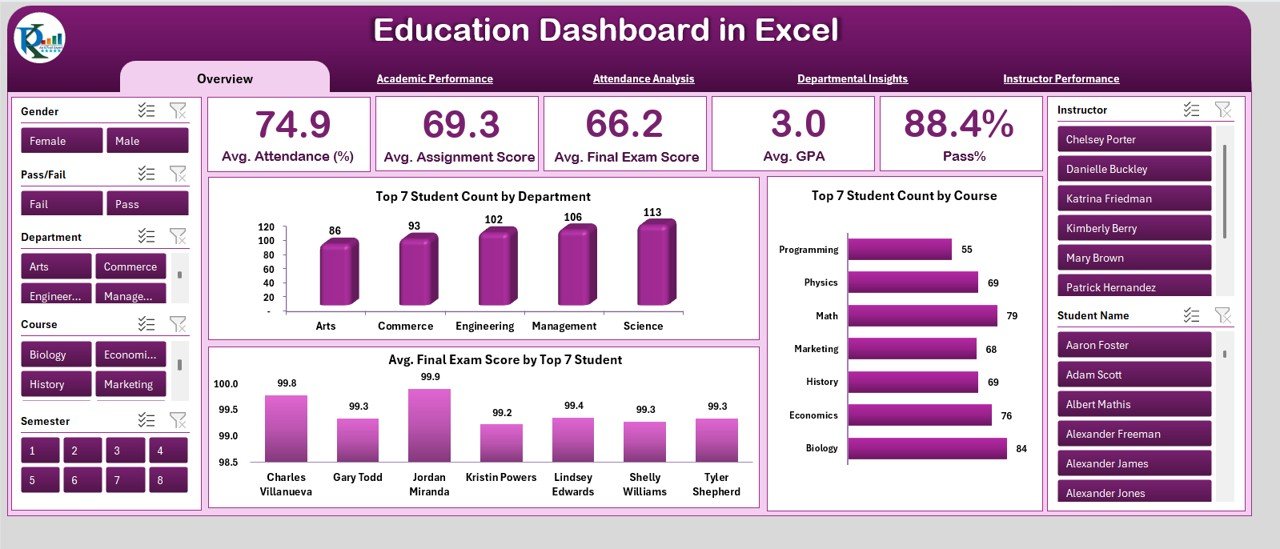
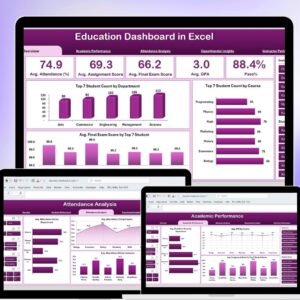
The Education Dashboard in Excel is a comprehensive tool designed to help educational institutions track and analyze their key performance indicators (KPIs). This dashboard centralizes various metrics such as student performance, attendance, graduation rates, and more, enabling administrators and educators to make informed decisions and optimize institutional performance.
By using this Excel-based dashboard, educational organizations can gain valuable insights into their operations, assess trends, and implement strategies to improve overall educational outcomes.
Key Features of the Education Dashboard in Excel
📊 Centralized KPI Tracking
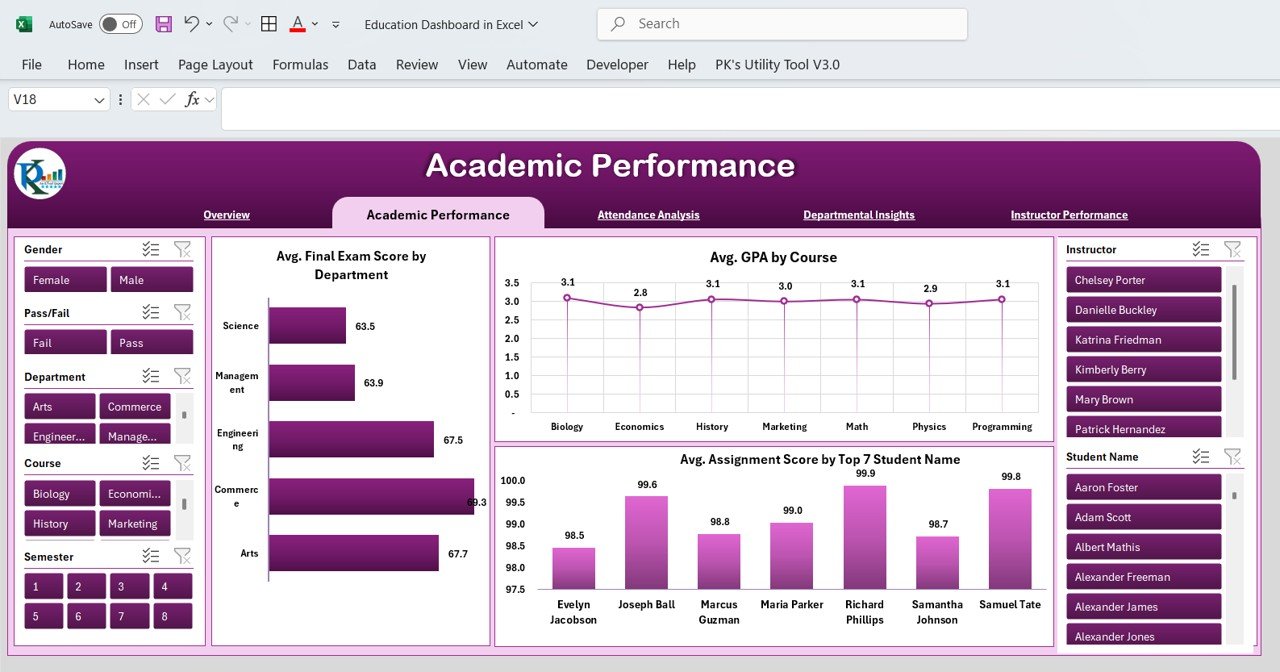
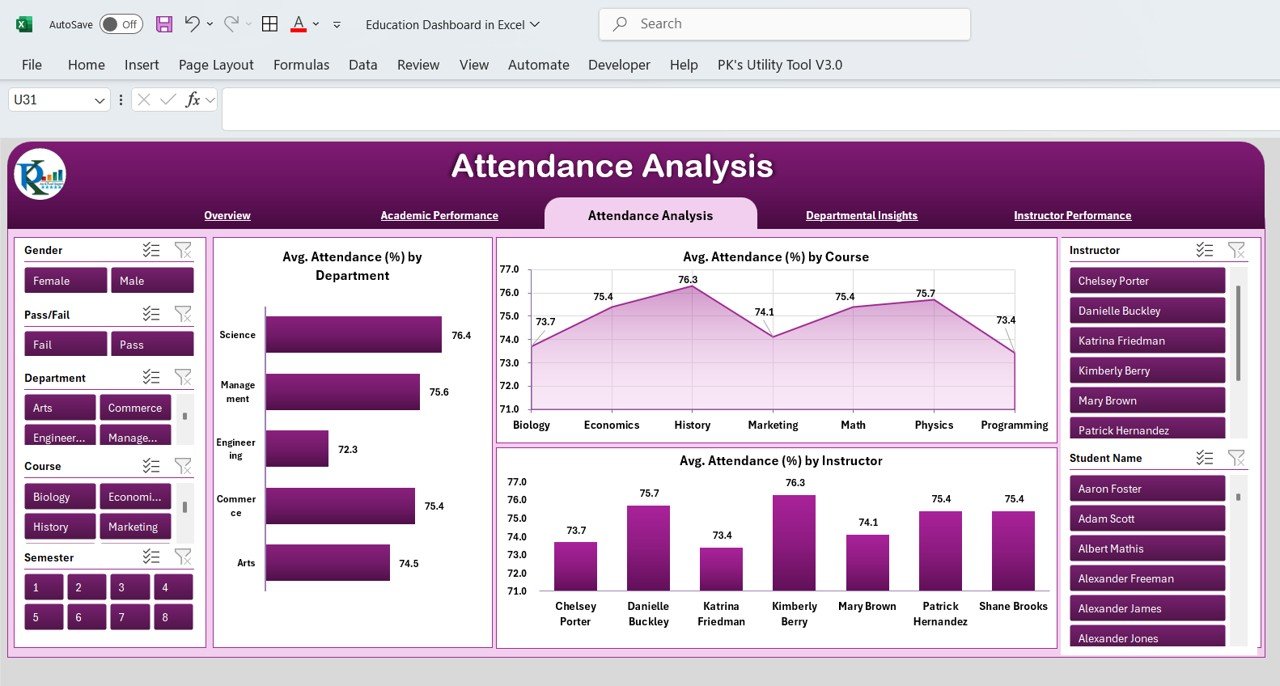
Comprehensive Metric Monitoring: Track key educational KPIs such as student grades, attendance, teacher performance, and graduation rates, all in one centralized dashboard.
Real-Time Data Visualization: Use dynamic charts, graphs, and tables to visualize trends and performance over time, making it easier to interpret data.
Customizable Metrics: Tailor the dashboard to include KPIs specific to your institution’s objectives and needs.
📈 Performance Analysis and Monitoring
Trend Tracking: Monitor KPIs over time, comparing actual data against targets and previous periods to assess improvements or areas needing attention.
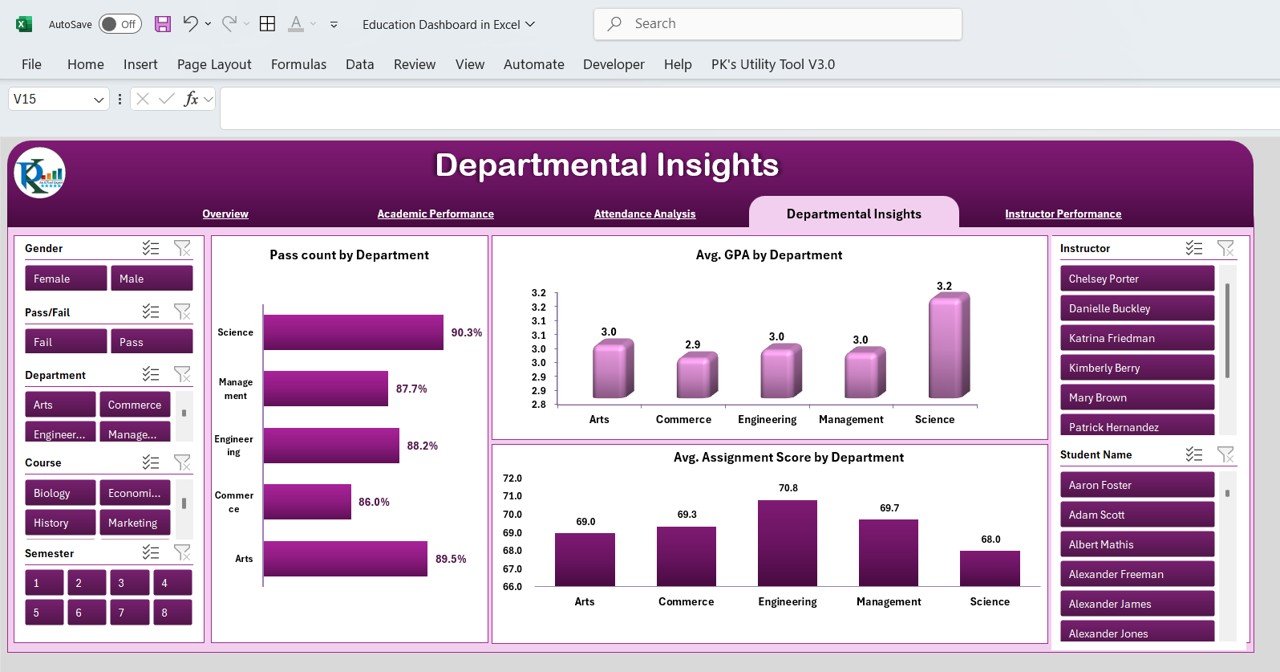
Breakdown by Category: Analyze performance by various categories, such as grade levels, subject areas, and departments, to get a more granular view of progress.
🔧 Data Integration and Reporting
Easy Data Import: Import data from your existing systems, such as student management or learning management systems, to keep the dashboard updated with real-time information.
Actionable Insights: Gain actionable insights to identify areas for improvement in student performance, teaching strategies, and overall educational effectiveness.
💡 User-Friendly Interface
Intuitive Design: Designed to be user-friendly and accessible, even for those without advanced technical skills. This makes it easy for teachers and administrators to track performance without feeling overwhelmed by complex tools.
Customizable Layouts: Adjust the layout and features of the dashboard to suit your institution’s specific needs, making it a flexible and scalable tool.
Benefits of Using the Education Dashboard in Excel
✅ Informed Decision-Making
The dashboard provides real-time data, enabling educational leaders to make informed decisions based on accurate and up-to-date performance metrics.
✅ Improved Educational Outcomes
Track critical metrics such as attendance, grades, and graduation rates to identify areas for improvement and implement targeted strategies that enhance student success.
✅ Streamlined Monitoring
Easily monitor institutional performance across various departments and grades, providing a quick overview of where improvements are needed and which areas are performing well.
✅ Cost-Effective Solution
This Excel template offers an affordable solution to track KPIs and analyze educational data, making it accessible to educational institutions of all sizes without the need for expensive software.
Getting Started with Your Education Dashboard in Excel
Download the Template: Start by downloading the Education Dashboard template to customize it for your institution.
Set Up Your KPIs: Define the key KPIs that align with your institution’s goals, such as student performance, attendance, and graduation rates.
Import Data: Import data from your student management systems, grades, and attendance records to keep the dashboard updated.
Monitor Performance: Use the visualizations and metrics to track educational performance and identify trends.
Collaborate: Share the dashboard with your team to ensure alignment and transparency in performance monitoring.
By using the Education Dashboard in Excel, your institution can improve performance monitoring, foster data-driven decision-making, and enhance educational outcomes across the board.
Click here to read the Detailed blog post
Education Dashboard in Excel
Visit our YouTube channel to learn step-by-step video tutorials
YouTube.com/@PKAnExcelExpert
Watch the step-by-step video tutorial:
Compatibility and Requirements
- Works in Microsoft Excel desktop (Excel 2016 or later, or Microsoft 365).
- Charts update from the data you enter or import. Microsoft’s guide Create a chart from start to finish covers editing them.
Frequently Asked Questions
What does the Education Dashboard track?
It tracks education KPIs such as student grades, attendance, teacher performance and graduation rates in one dashboard.
Can I break results down by grade or subject?
Yes. You can analyze performance by grade level, subject area and department.
Can I import data from our school system?
Yes. You can import data from a student management or learning management system to keep the dashboard current.
Can I add our own KPIs?
Yes. The metrics and layout are customizable, so you can add KPIs that match your institution’s goals.
Related Education Templates
- Education Dashboard in Power BI: the same education dashboard built in Power BI
- Education Dashboard in Google Sheets: the same education dashboard in Google Sheets
- Education and Learning Quality Assurance KPI Dashboard in Excel: tracks learning quality KPIs in Excel
- Primary Schools KPI Dashboard in Excel: a KPI dashboard focused on primary schools
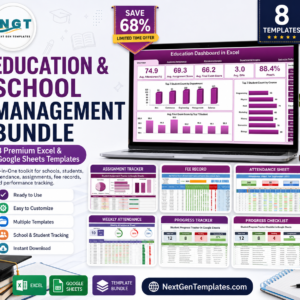
- Education & School Management Bundle: eight education and school templates in one bundle
Browse all Excel education templates or the Excel dashboards.




Reviews
There are no reviews yet.