

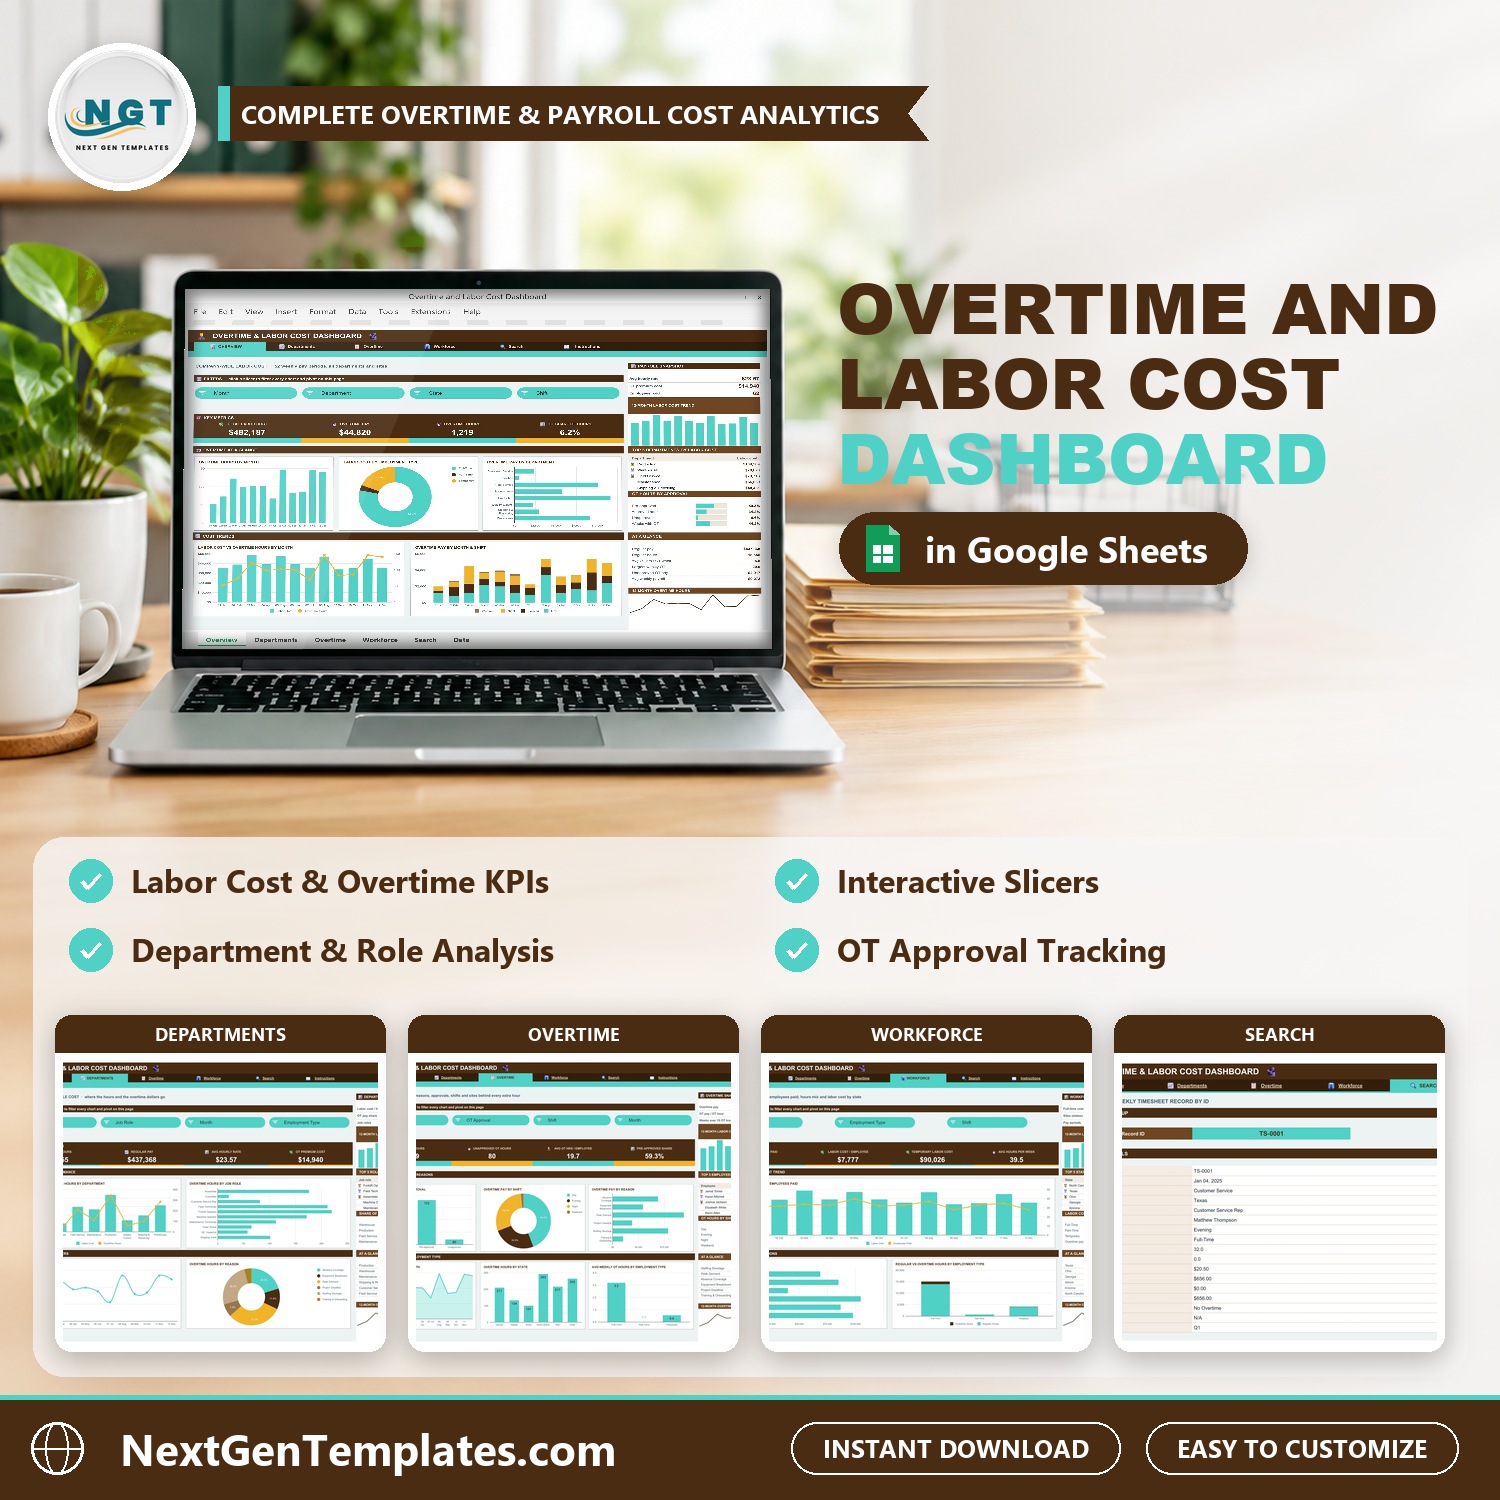

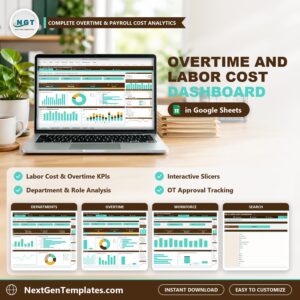
Overtime is easy to approve one week at a time and hard to see as a whole. The Overtime and Labor Cost Dashboard in Google Sheets is an overtime tracking template that turns a year of weekly timesheet records into four dashboard pages: what your hourly workforce costs, how much of it is overtime, which departments, roles, shifts and states drive it, and whether that overtime was approved first.
🌍 Join 10,000+ customers in 180+ countries using NextGenTemplates to replace paid SaaS tools with one-time-purchase Excel, Google Sheets, Power BI and HTML templates.
✅ Instant download · One-time payment · No subscription · No per-user fees · Lifetime access
Watch the Overtime and Labor Cost Dashboard in Google Sheets walkthrough
Good to know: this is a reporting dashboard, not a time clock or a payroll system. You paste or enter weekly timesheet records into the Data tab. All sample employees and figures are fictional.
🔑 Key Features of the Overtime and Labor Cost Dashboard
📌 A labor cost dashboard in Google Sheets. This labor cost dashboard shows total labor cost, regular pay and overtime pay side by side, so overtime never hides inside the payroll total.
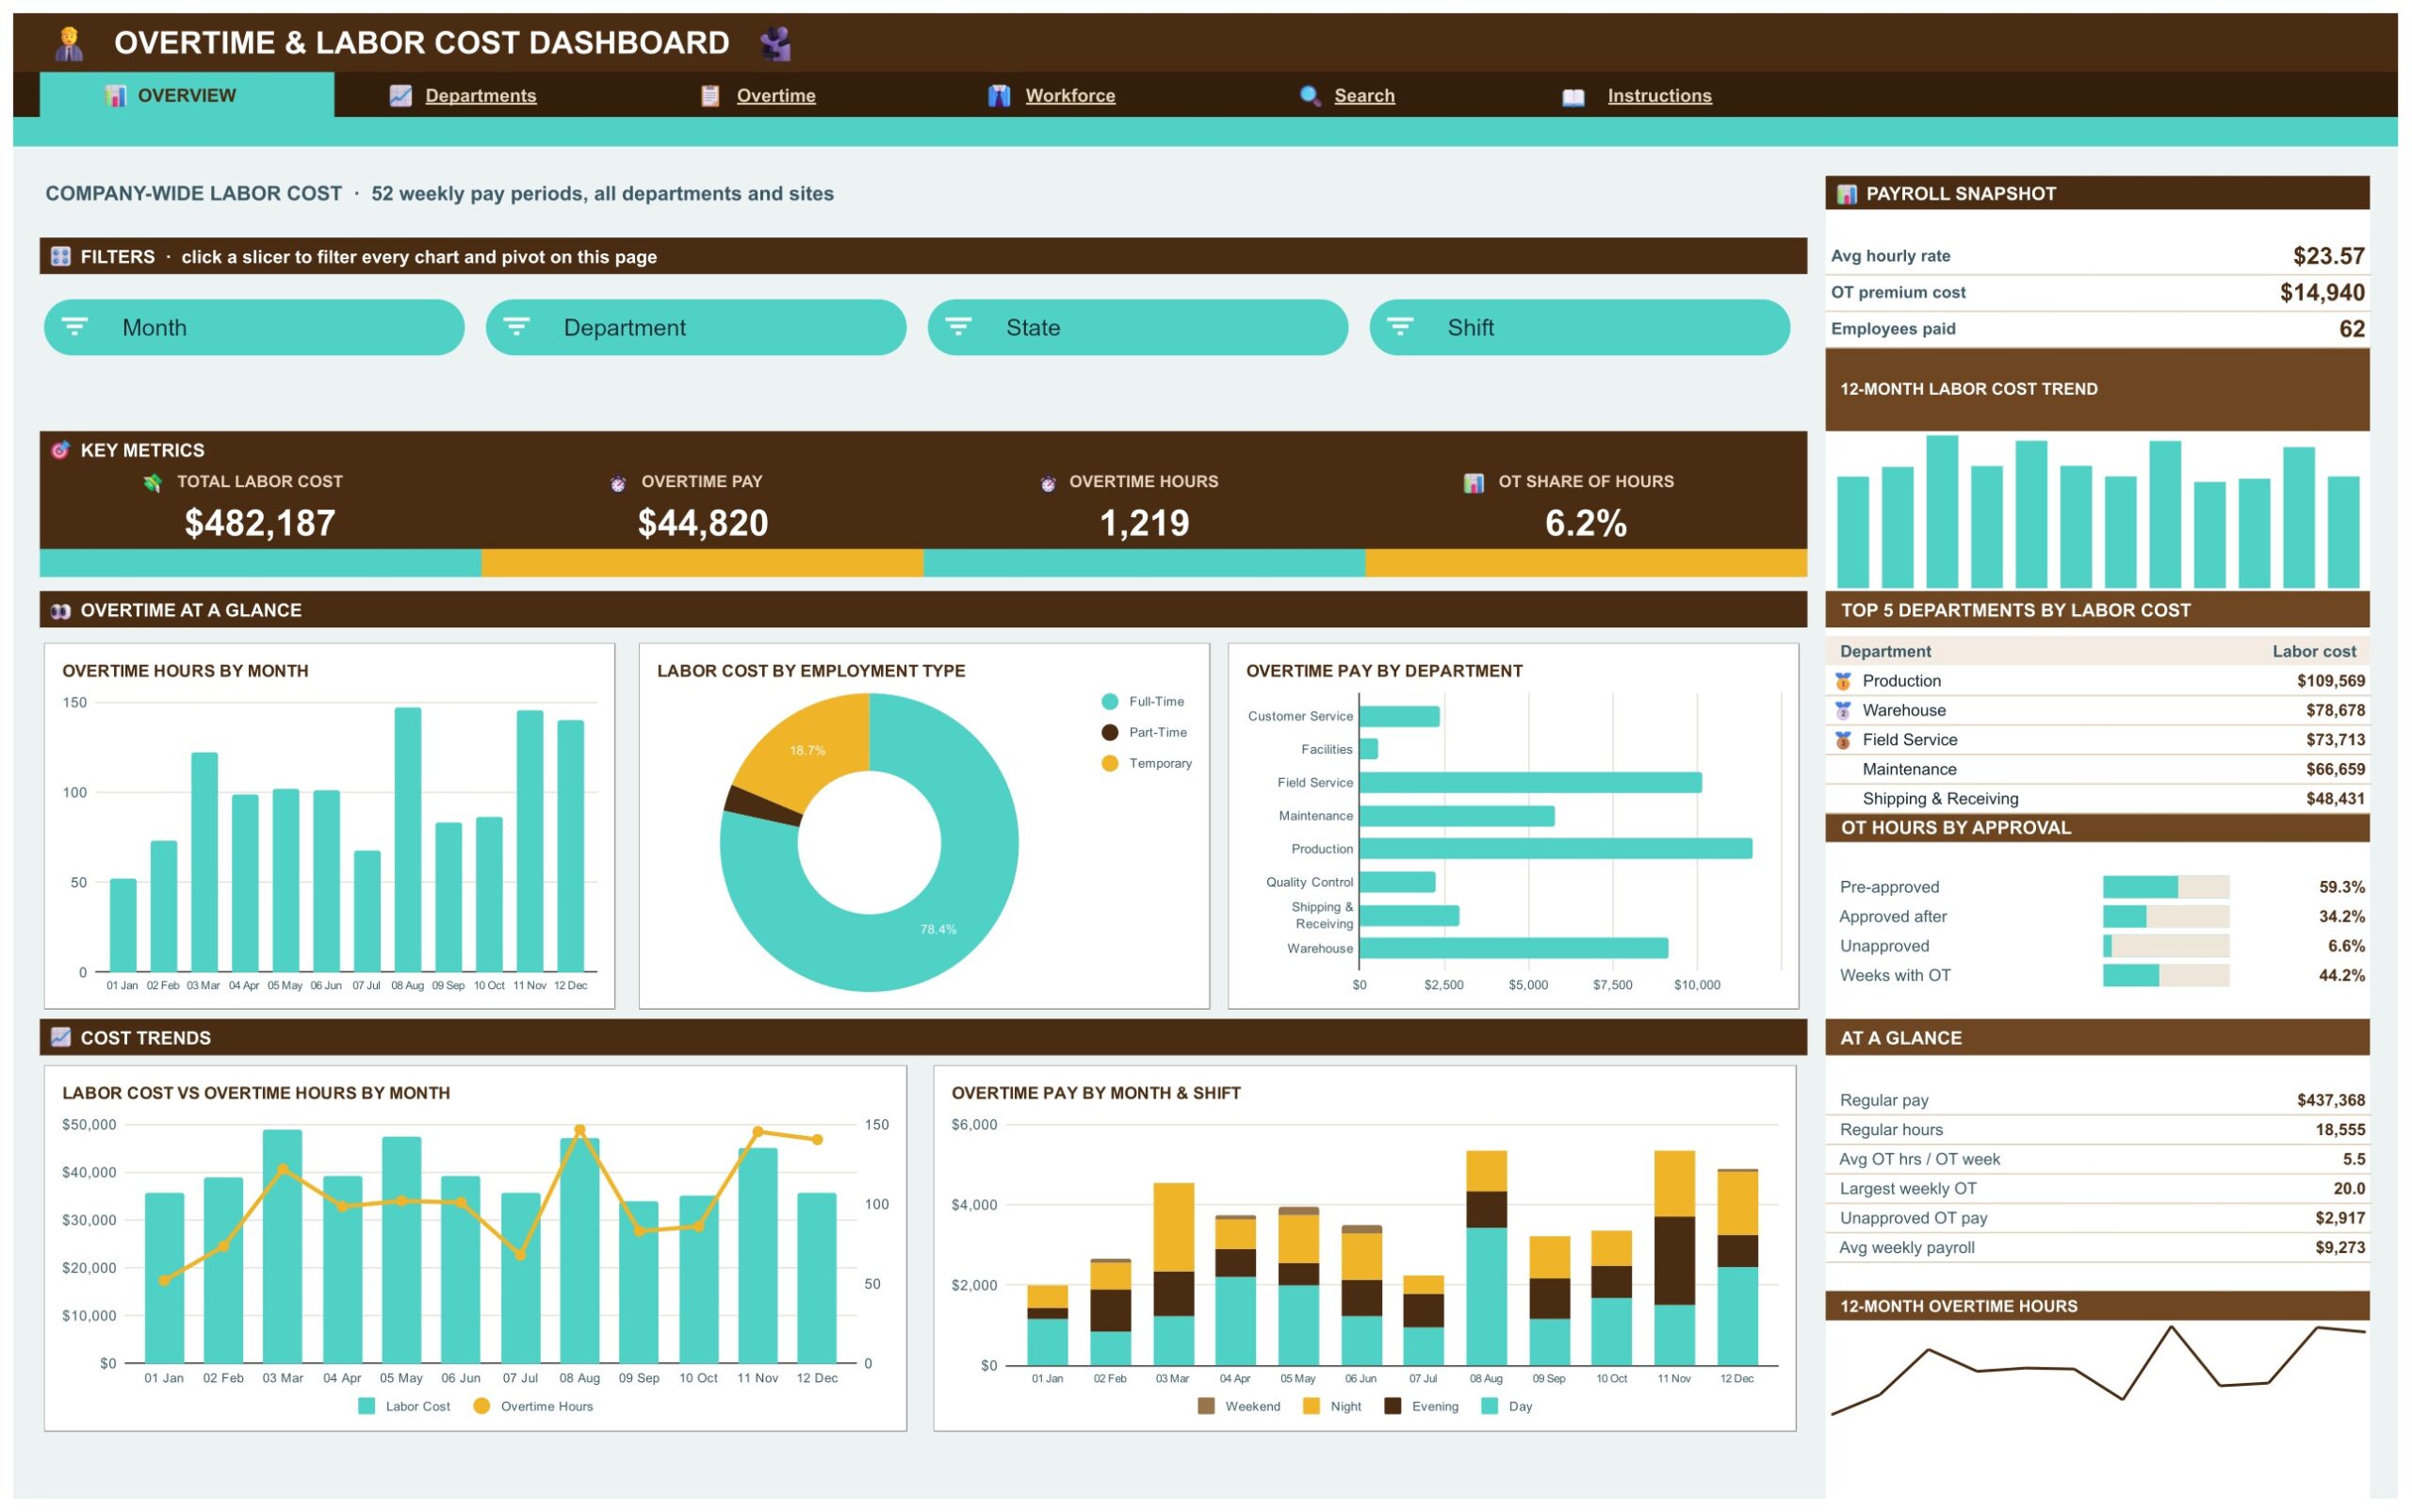
📌 KPI cards on every page. Total Labor Cost, Overtime Pay, Overtime Hours, OT Share of Hours, Unapproved OT Hours, Average OT Hours per Employee, Pre-Approved Share, Regular Pay and Employees Paid.
📌 Eight native slicers. Month, Department, State, Shift, Job Role, Employment Type, OT Reason and OT Approval filter the charts and pivots on their pages with one click.
📌 An overtime approval tracker. The Overtime page splits overtime hours into pre-approved, approved after the fact and unapproved, so you can see how much overtime happened without a manager’s sign-off.
📌 Overtime by department, shift, reason and state. Overtime Pay by Department, by Shift, by Reason and by State, plus Overtime Hours by Job Role, show where the extra hours really go.
📌 Top 5 panels. Top 5 departments by labor cost, top 5 roles and employees by overtime hours, and top 5 states by labor cost update with the slicers.
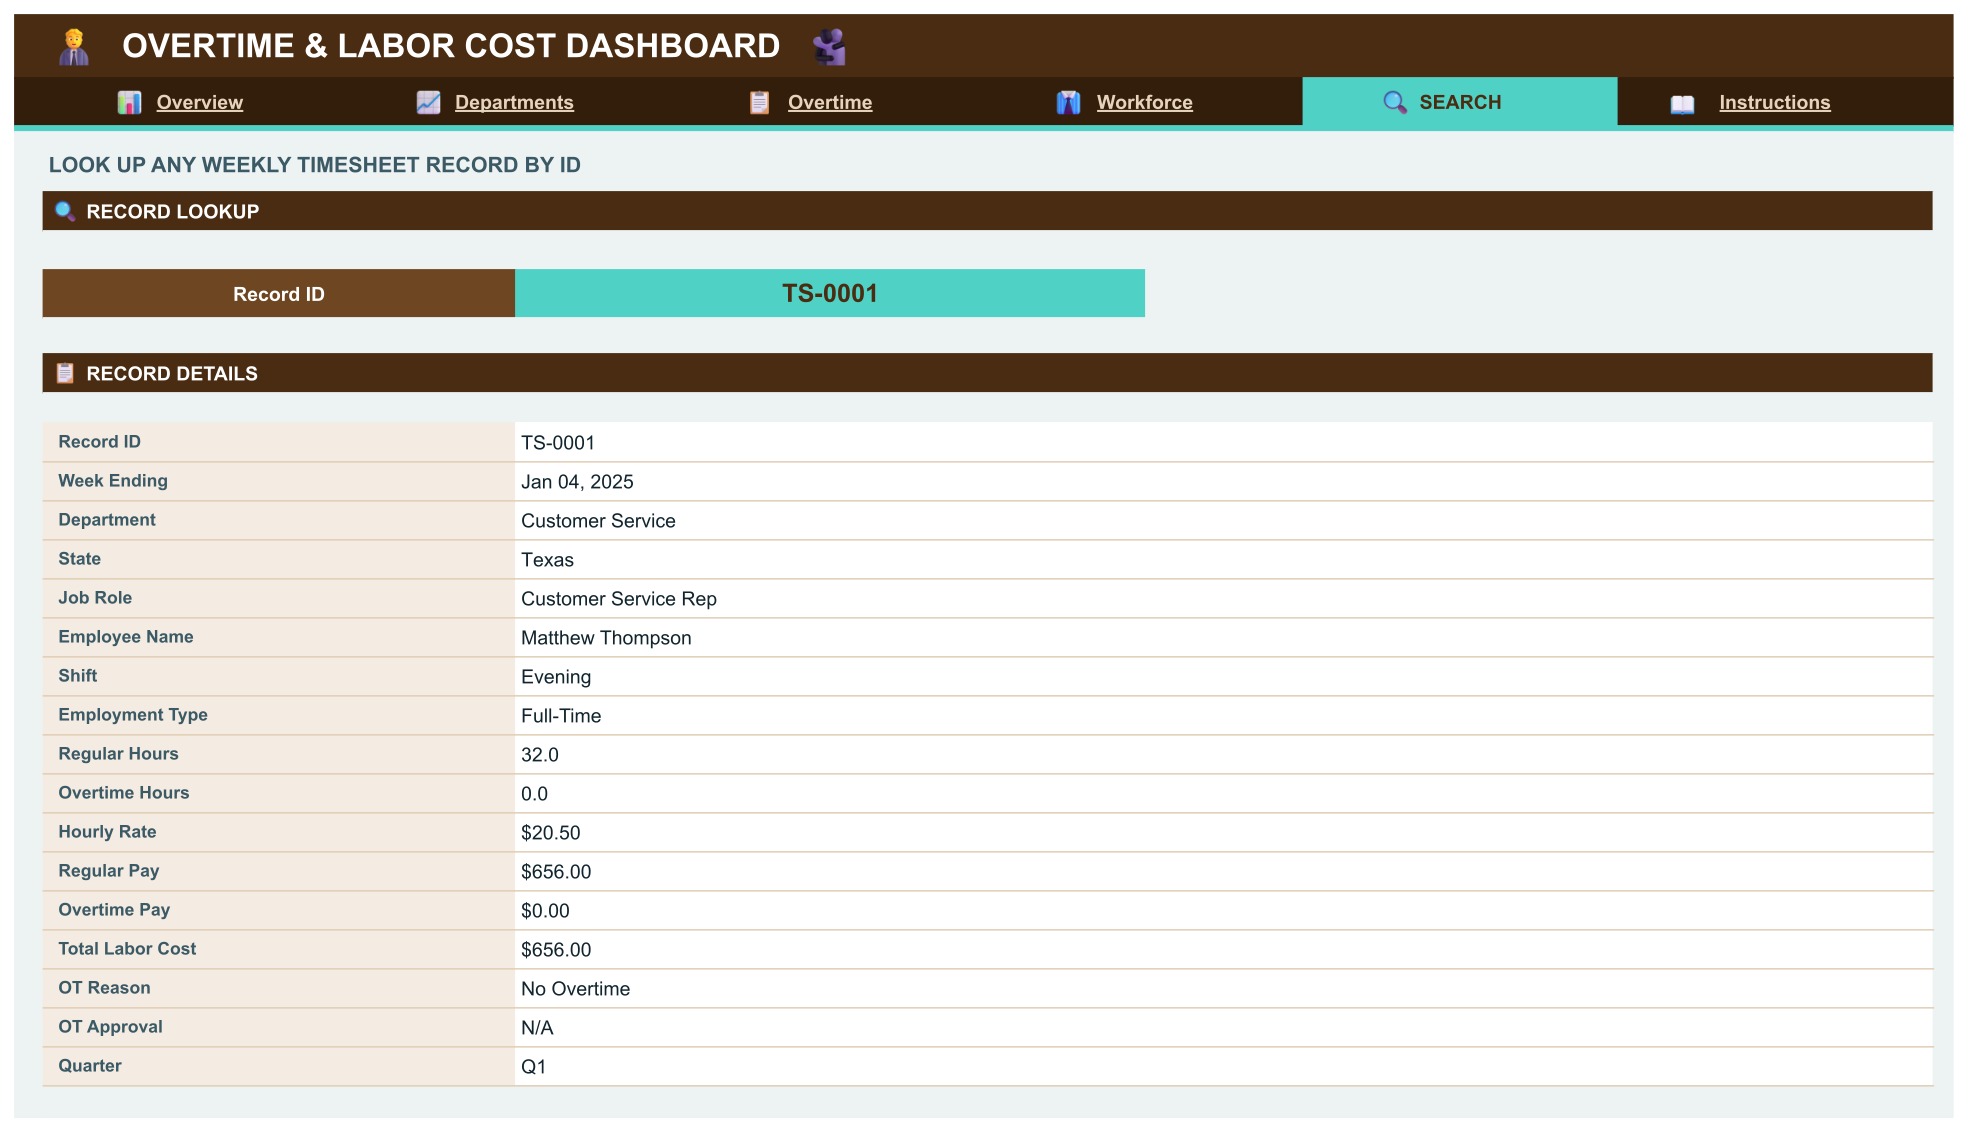
📌 Record-level Search page. Pick any Record ID such as TS-0001 and the full weekly timesheet record appears.
📌 Built for payroll overtime reporting in Google Sheets. This payroll overtime dashboard Google Sheets users can copy to their own Drive uses formulas, pivot tables and slicers. No add-on, no script, no macro.
📌 Room for 1,000 timesheet rows. Paste your own payroll export over the sample rows and the pages update on their own.
📦 What’s Inside the Overtime and Labor Cost Dashboard
Four dashboard pages (Overview, Departments, Overtime, Workforce), a Search page, an Instructions page and a Data tab. Your download is a PDF guide with the link to open the dashboard and make your own editable copy.
Overview Page
Four KPI cards lead the page: Total Labor Cost, Overtime Pay, Overtime Hours and OT Share of Hours. Below them are Overtime Hours by Month, Labor Cost by Employment Type, Overtime Pay by Department, Labor Cost vs Overtime Hours by Month and Overtime Pay by Month and Shift. A sidebar adds a payroll snapshot, a Top 5 departments by labor cost list and an OT hours by approval panel. Month, Department, State and Shift slicers filter the page.
Departments Page
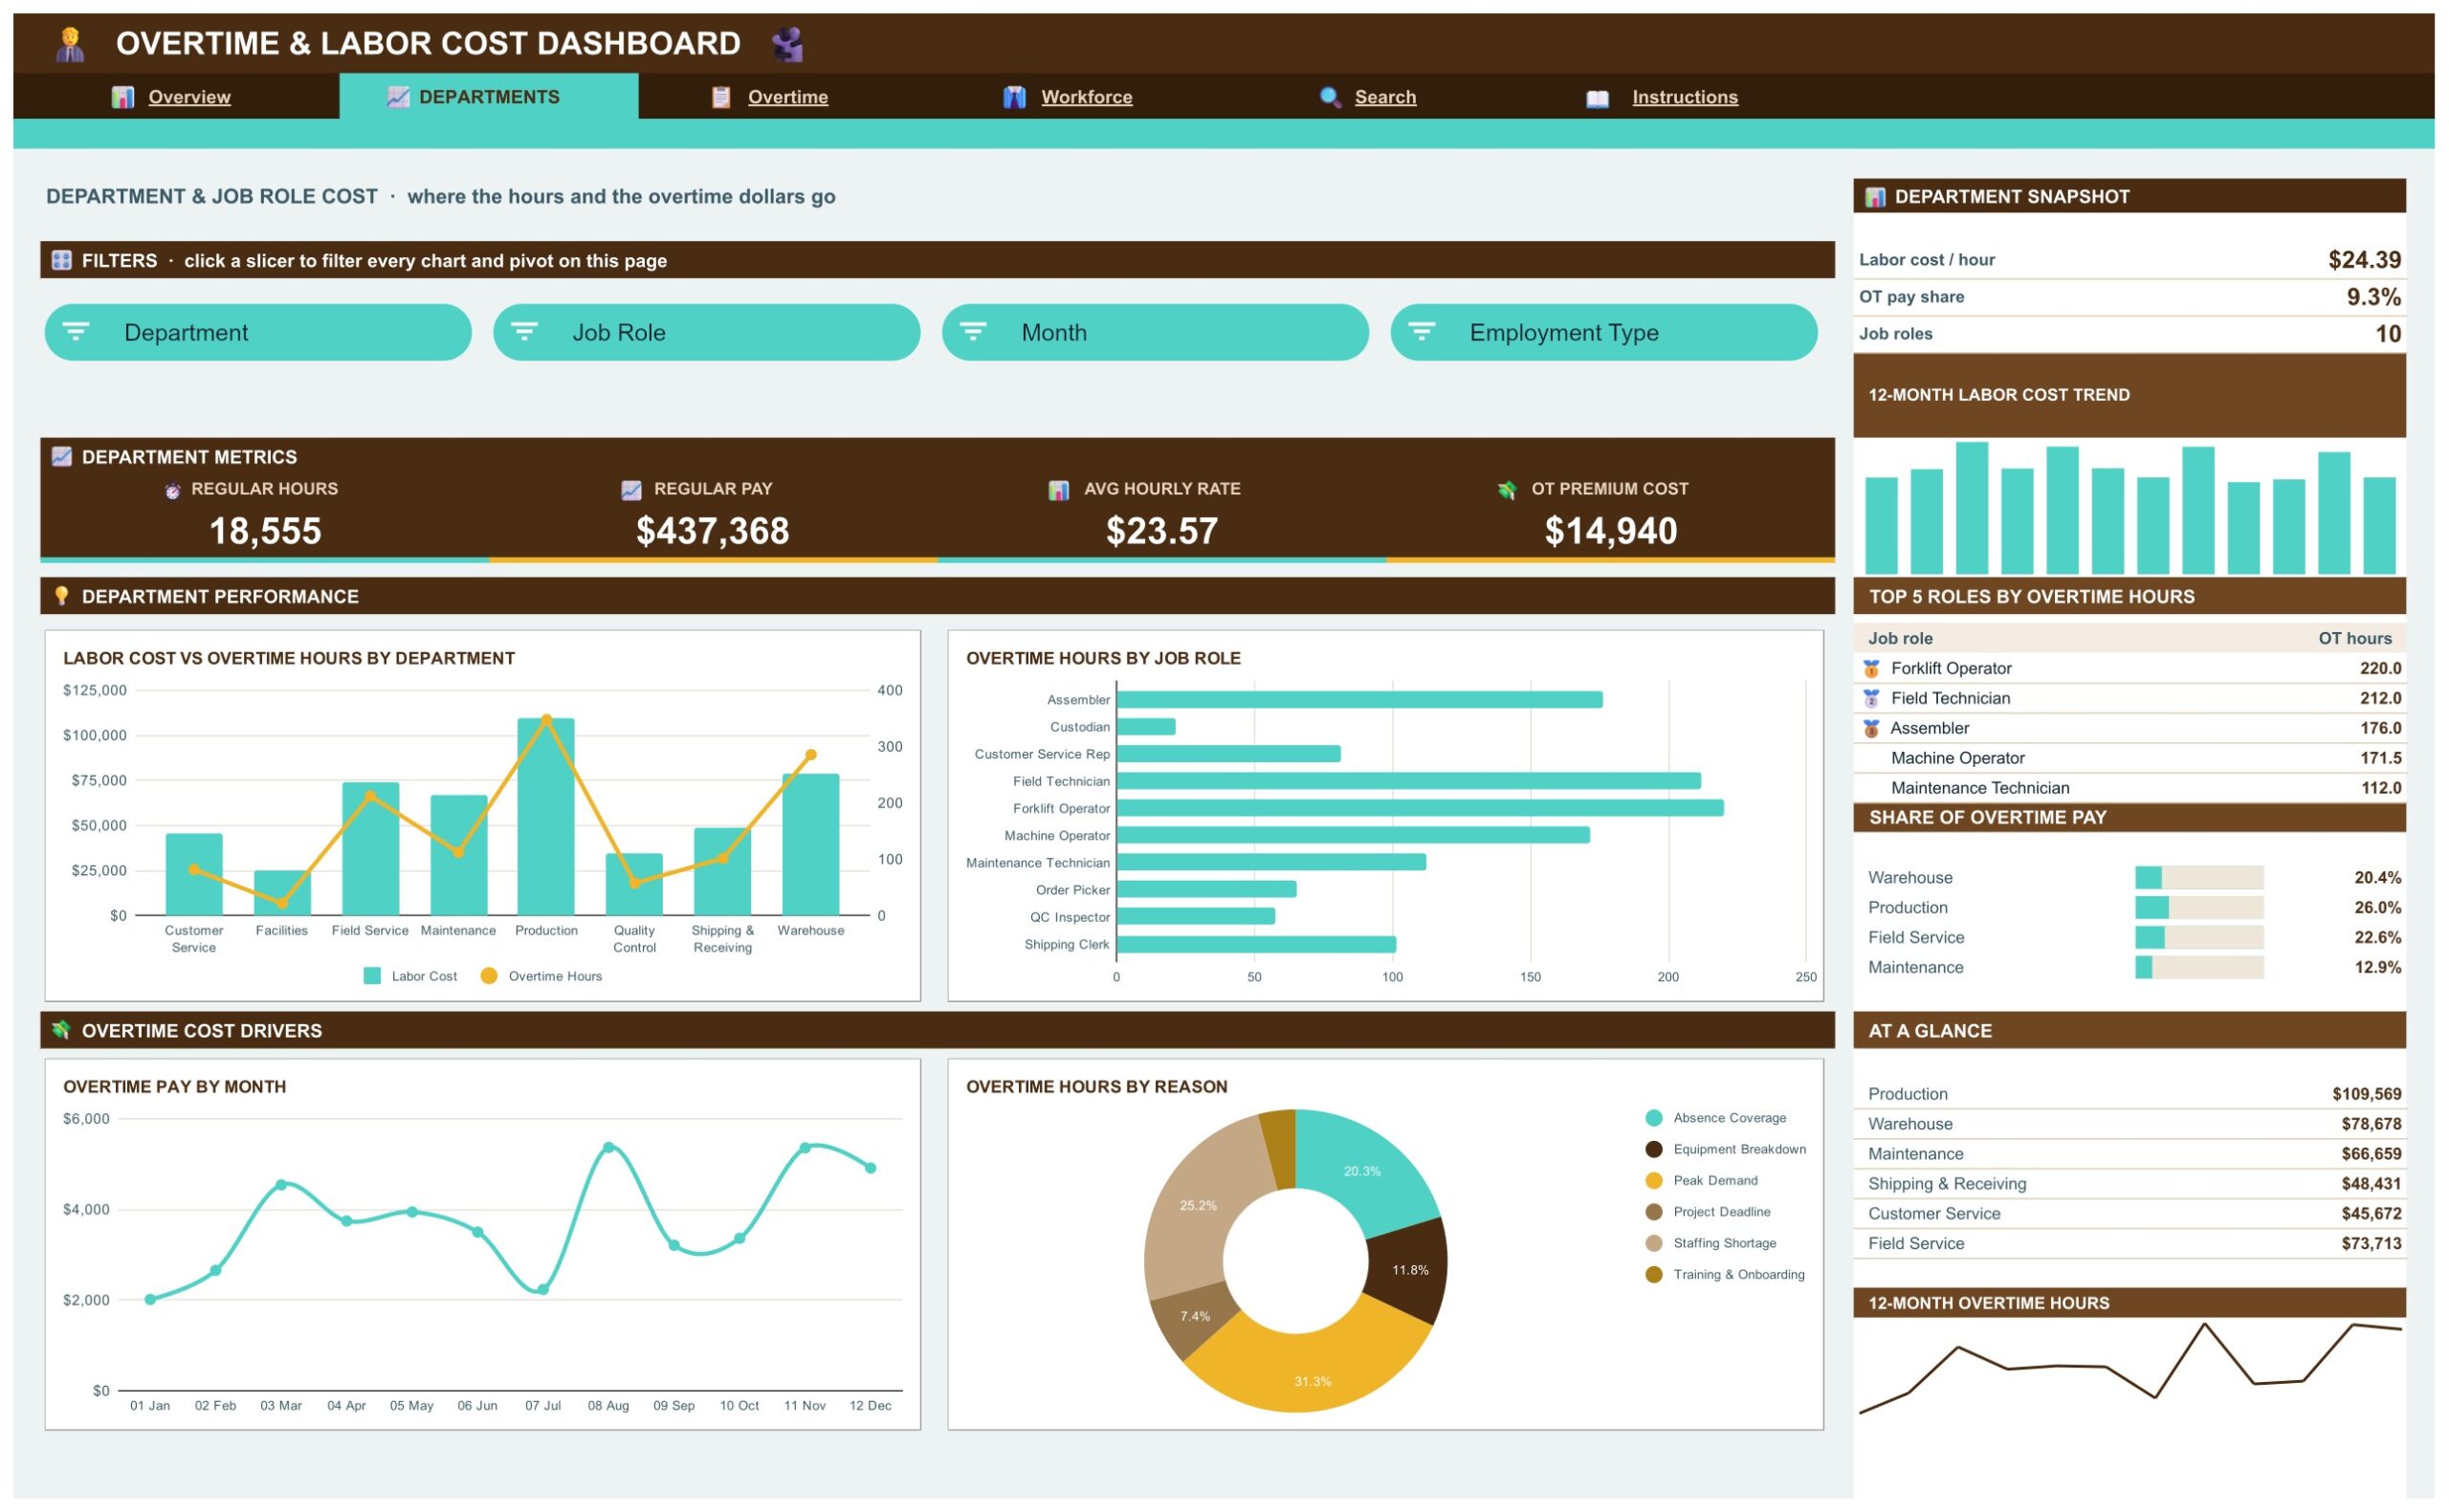
Labor Cost vs Overtime Hours by Department, Overtime Hours by Job Role, Overtime Pay by Month and Overtime Hours by Reason show which departments and roles carry the extra hours and why.
Overtime Page
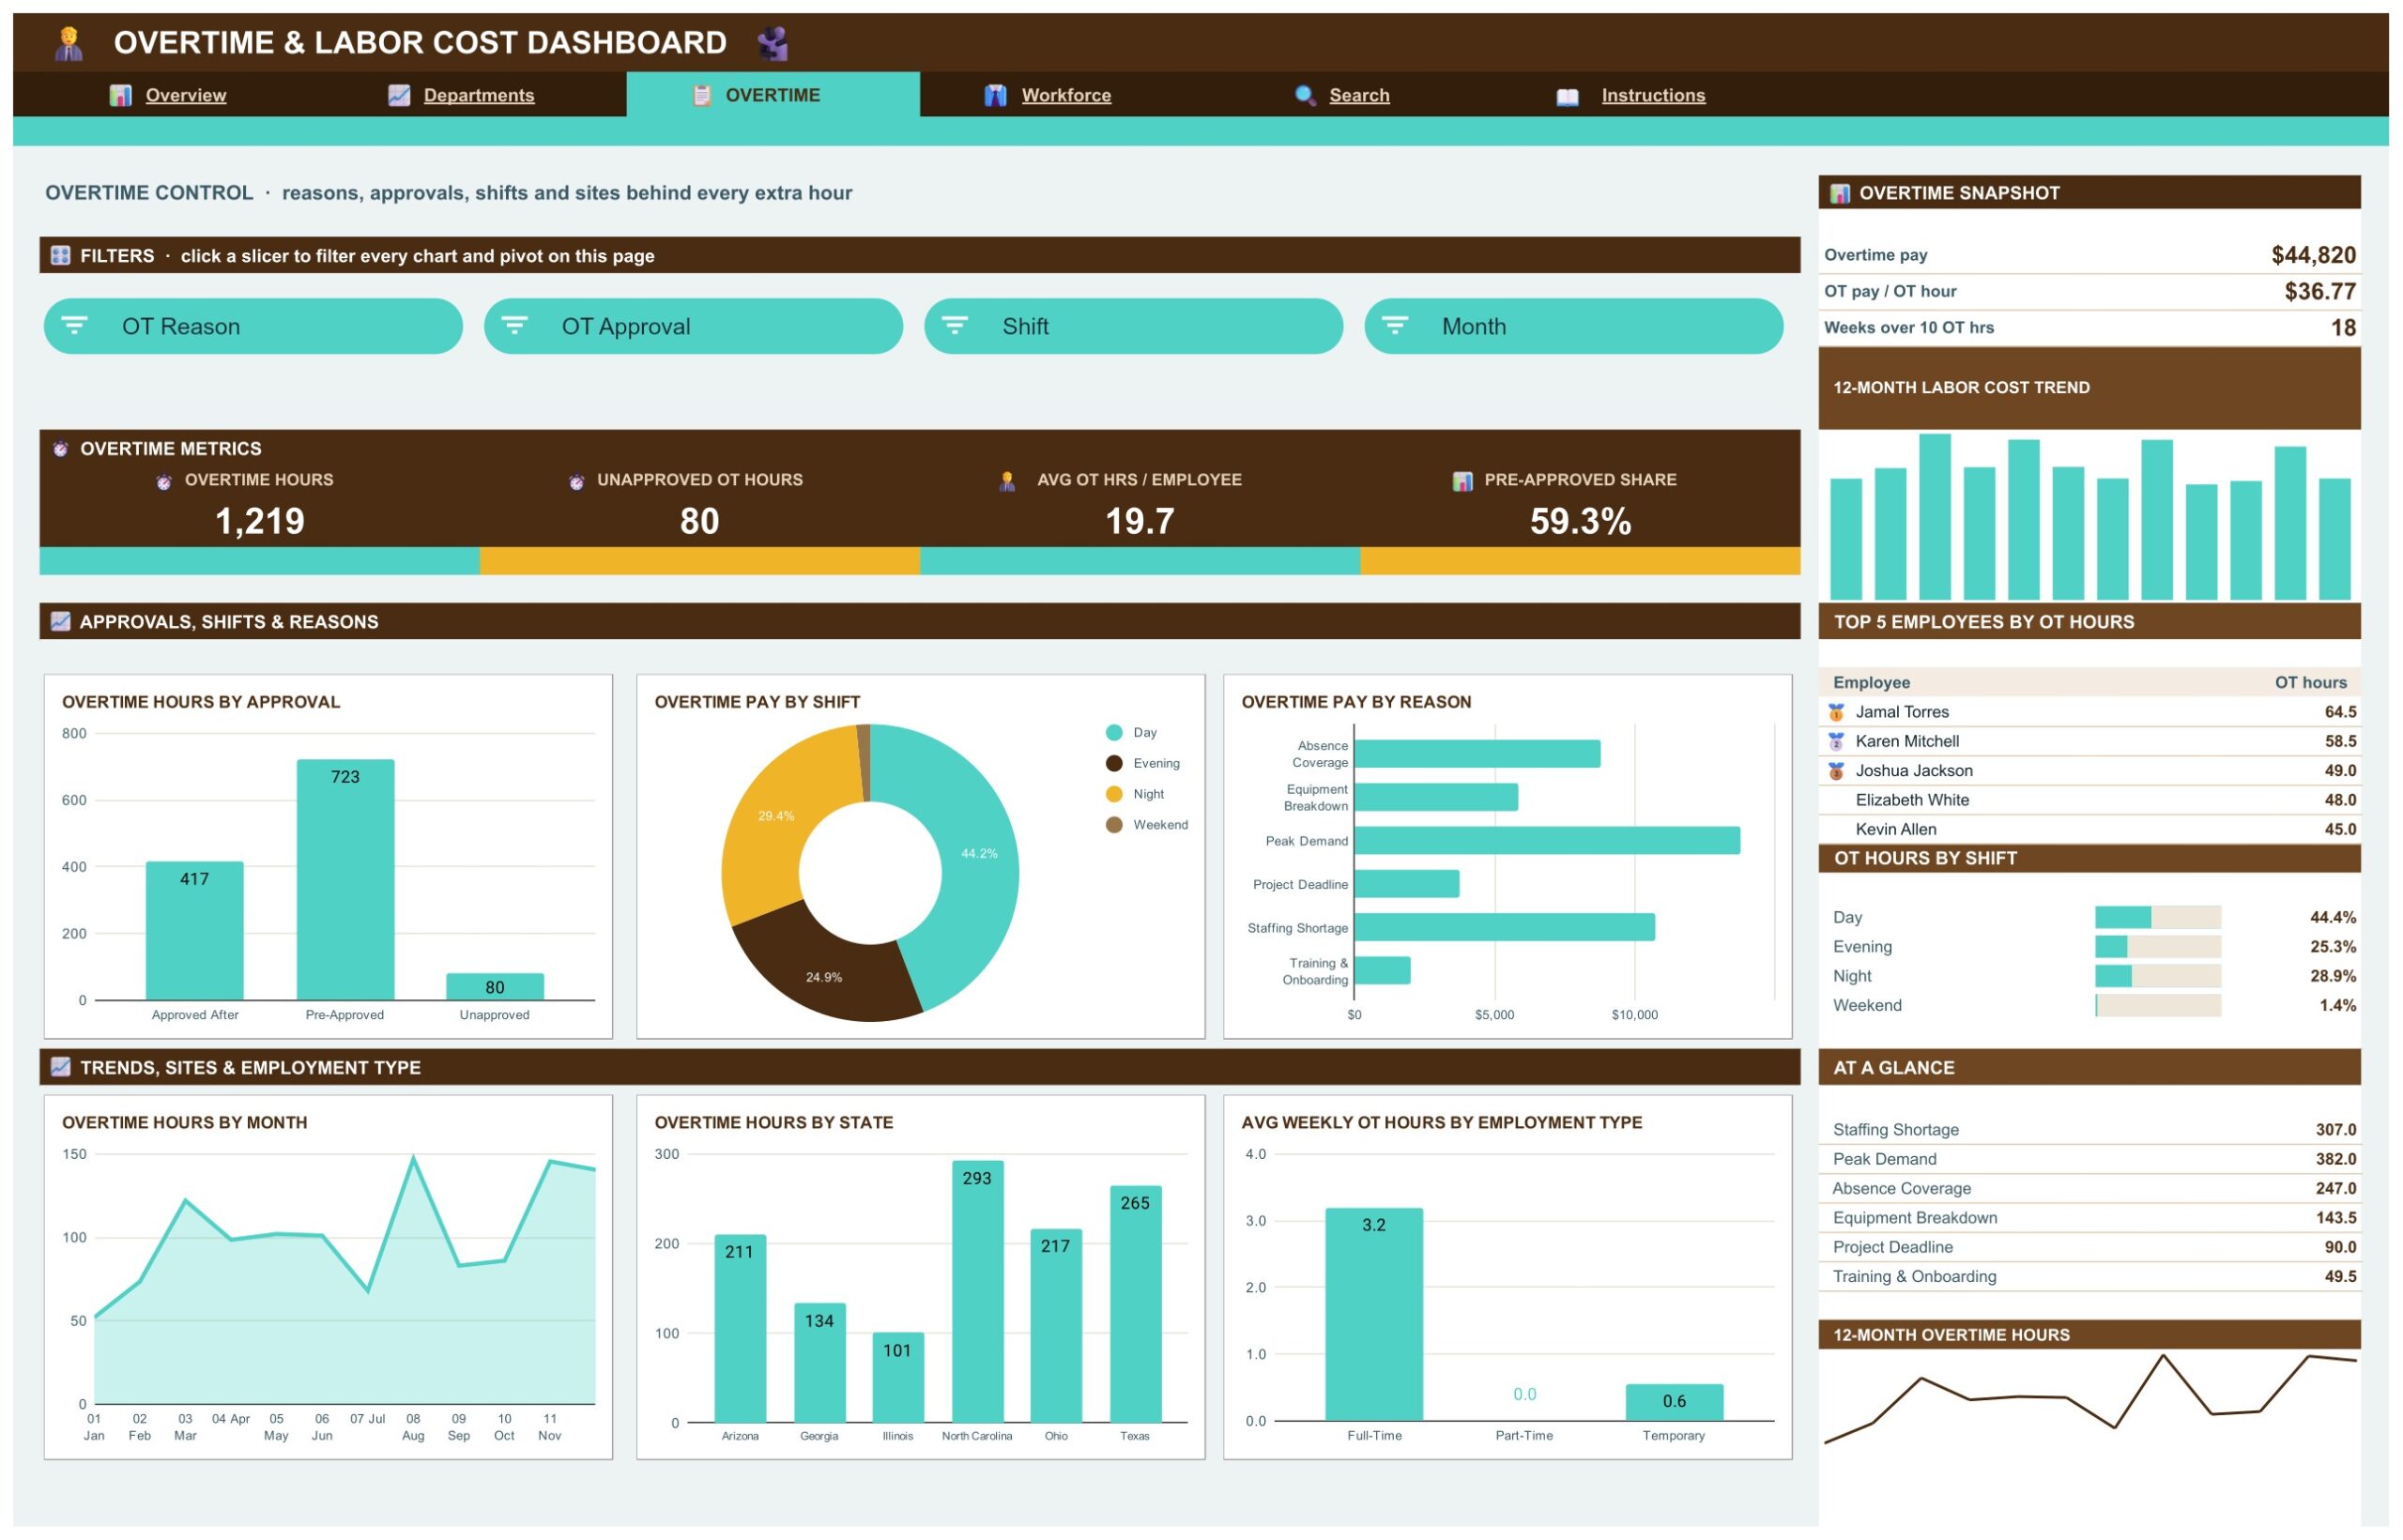
The overtime control page: Overtime Hours by Approval, Overtime Pay by Shift, Overtime Pay by Reason, Overtime Hours by Month, Overtime Hours by State and Average Weekly OT Hours by Employment Type. KPI cards show overtime hours, unapproved OT hours, average OT hours per employee and the pre-approved share. OT Reason, OT Approval, Shift and Month slicers filter the page.
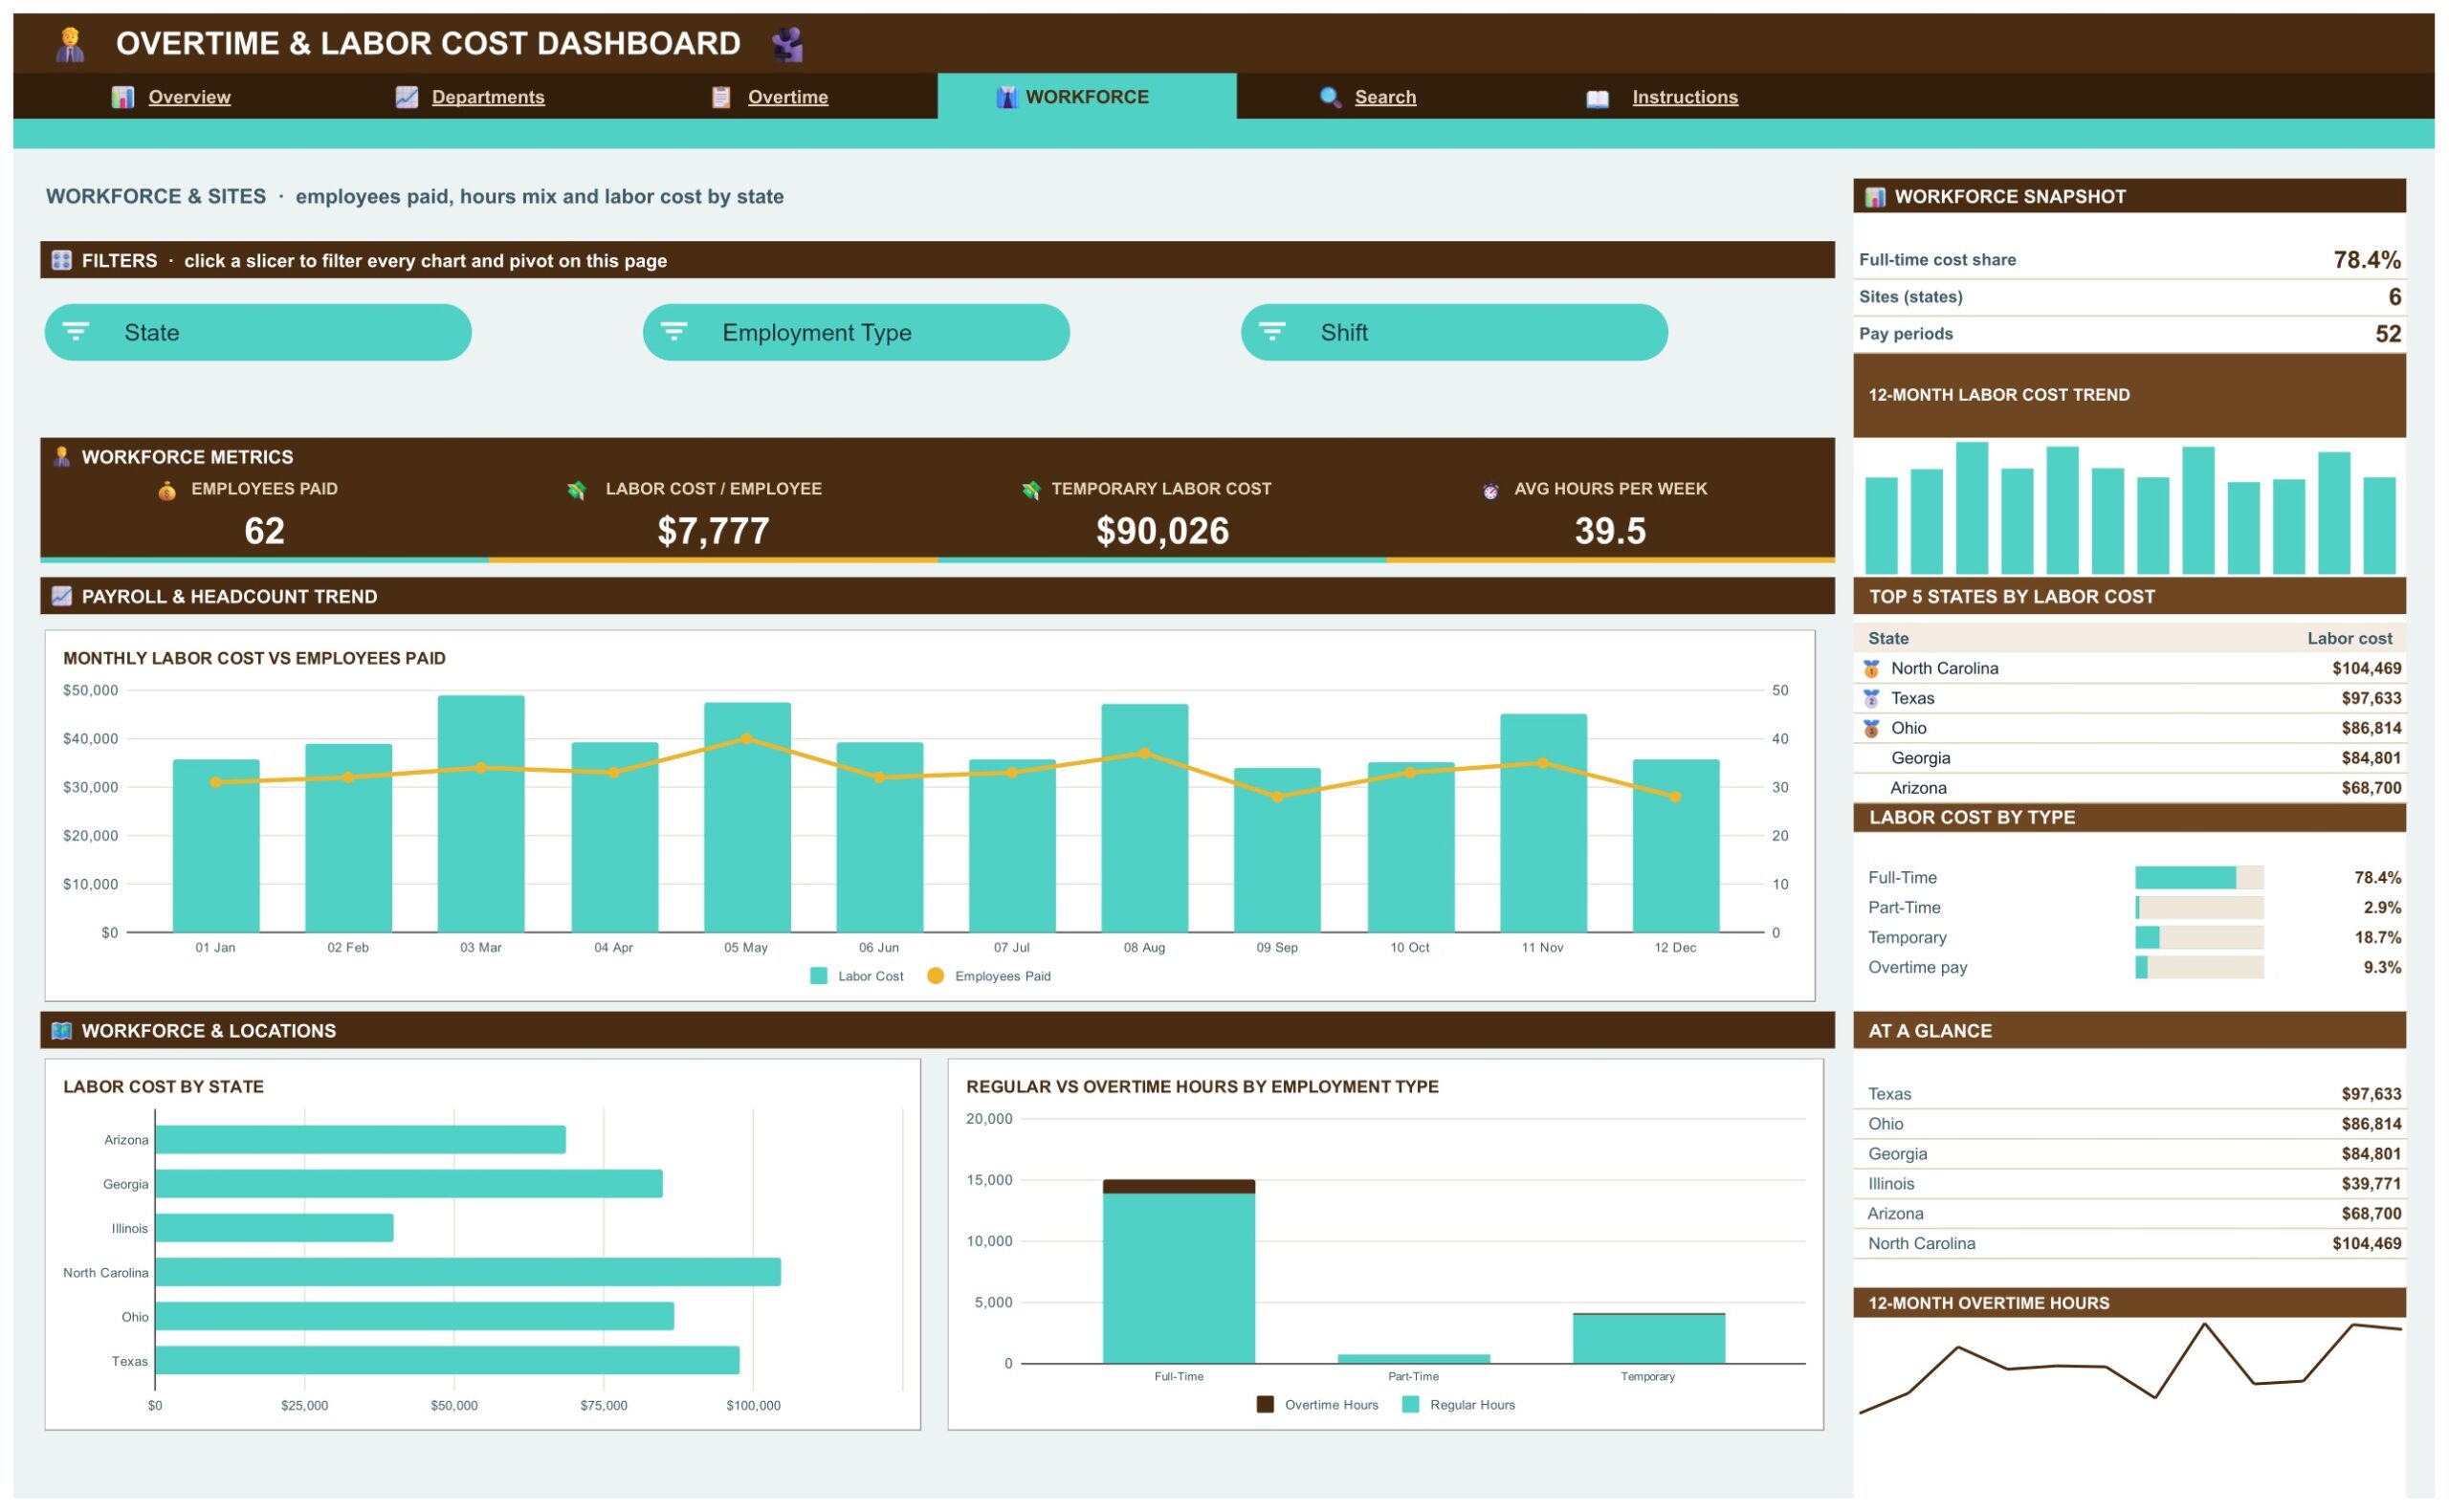
Workforce Page
Monthly Labor Cost vs Employees Paid, Labor Cost by State and Regular vs Overtime Hours by Employment Type, so you can see how headcount, location and employment type drive the payroll bill.
Search Page
Pick any Record ID, such as TS-0001, in the input box and the full weekly timesheet record appears: week ending date, department, state, job role, employee, shift, employment type, regular and overtime hours, hourly rate, regular pay, overtime pay, total labor cost, OT reason and OT approval.
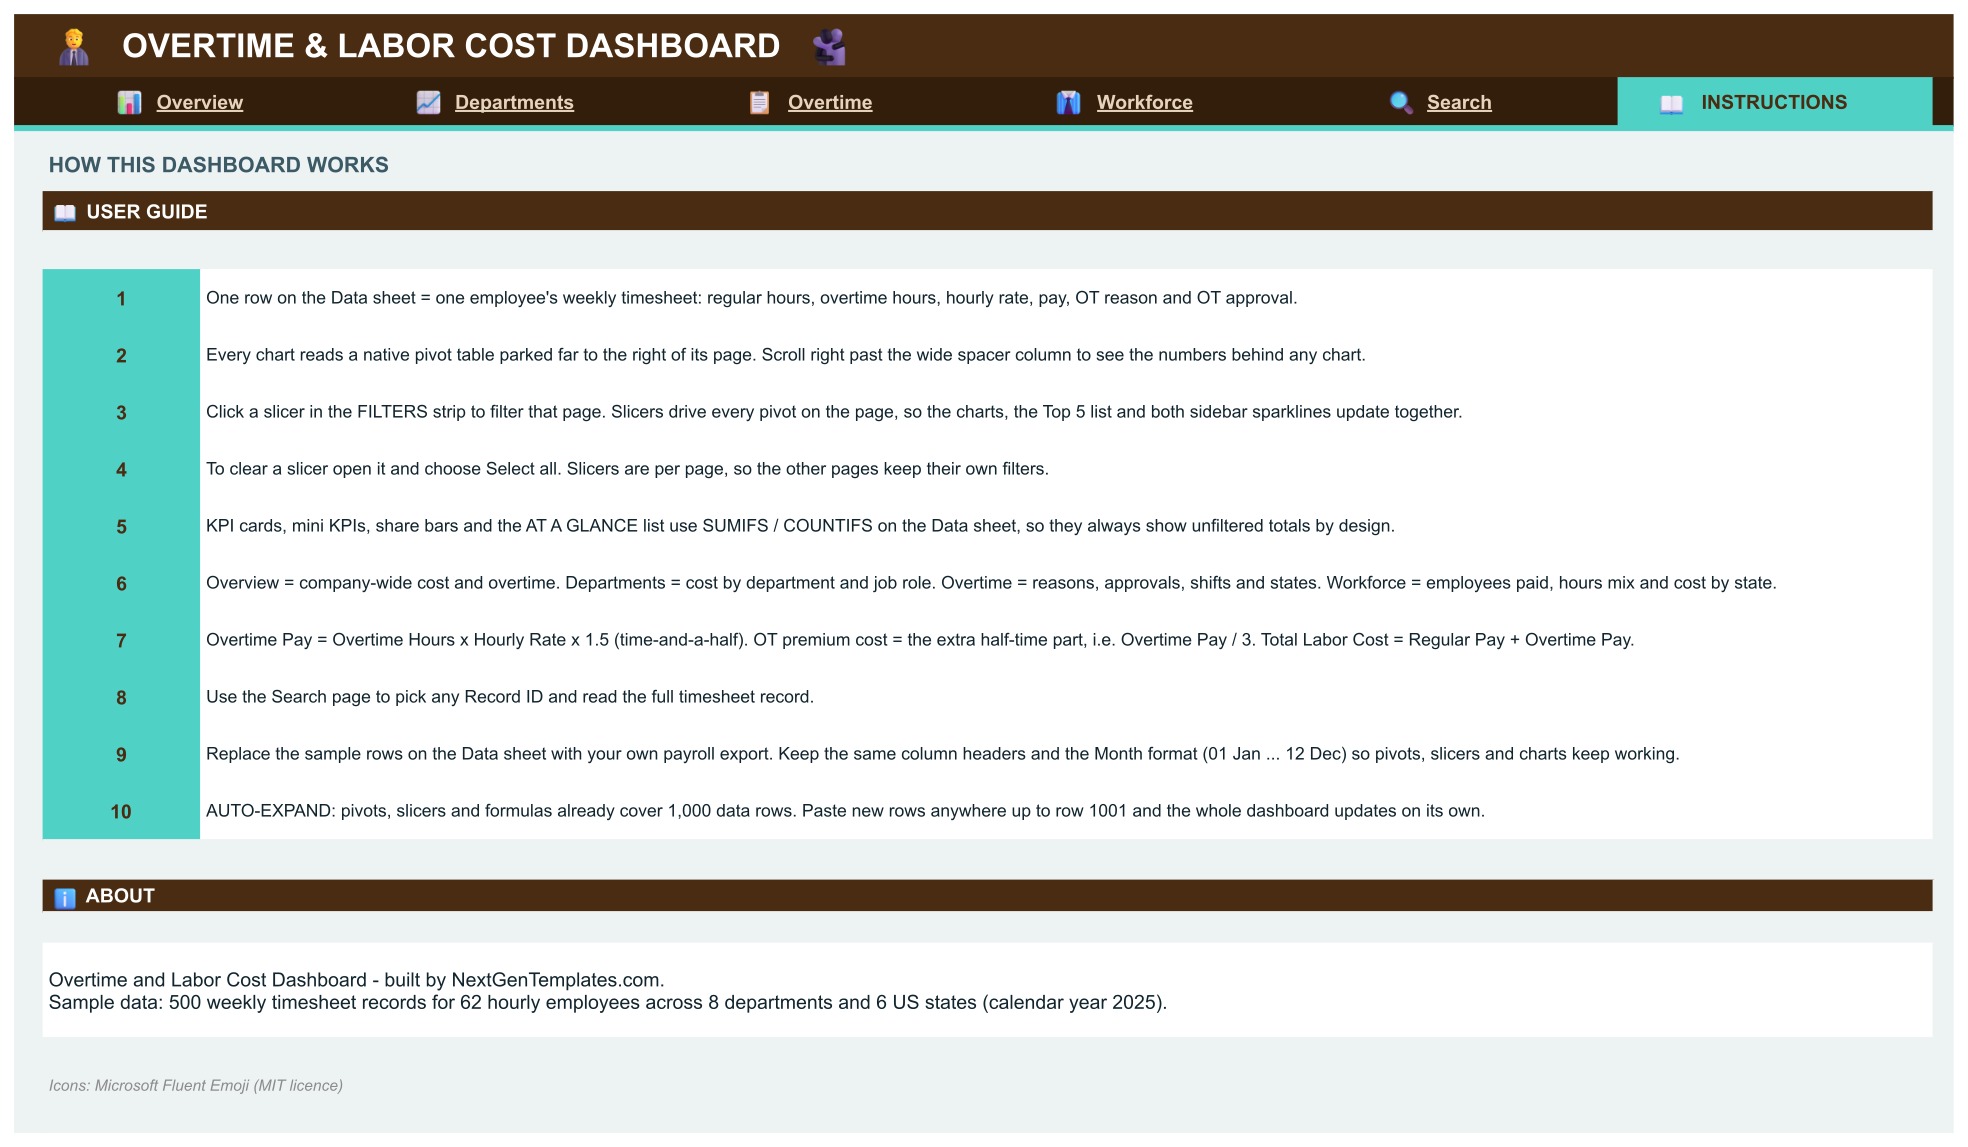
Instructions Page
Explains that each Data row is one employee’s weekly timesheet, how the pivot tables and slicers work, why the KPI cards show unfiltered totals, how overtime pay and the overtime premium cost are worked out, and how to replace the sample rows with your own payroll export.
📊 Overtime and Labor Cost Dashboard vs. a Timesheet Spreadsheet vs. Workforce Software: Where This Fits
| Feature | This Google Sheets dashboard | Plain timesheet spreadsheet | Workforce management software |
|---|---|---|---|
| Cost | $9.99 one-time ✅ | Free, but you build it | Monthly subscription, often per employee |
| Overtime pay and hours by department, shift and reason | Charts and cards ✅ | Manual formulas | Yes ✅ |
| Overtime approval mix | Pre-approved, after the fact, unapproved ✅ | Build it yourself | Varies |
| Slicers for month, department, state and shift | Yes ✅ | No | Varies |
| Clock-in, scheduling and payroll processing | No | No | Yes ✅ |
| Add-ons or scripts required | No | No | Not applicable |
If you already export weekly hours from a time clock or payroll system and want a clear overtime picture without another subscription, this dashboard fits. If you need clocking in, scheduling or live payroll, you need workforce software as well.
👥 Who This Template Is For, and Who It’s Not For
✅ This template is built for:
- Payroll and HR managers who report overtime and labor cost to finance every month
- Operations and department managers who run hourly teams and want overtime under control
- Controllers who need to see how much overtime was approved before it was worked
- Small and mid-size businesses with shift work, warehouses, production floors or field service teams
❌ This template is NOT for:
- Teams that need clock-in, scheduling or payroll processing, because it only reports on timesheet records you add
- Anyone looking for statutory overtime rules or tax calculations, which it does not apply
- Teams that need a live feed from a time clock, because the records are pasted or typed into the Data tab
⚙️ How to Use the Overtime and Labor Cost Dashboard
- Open the PDF guide in your download and click the link to open the dashboard.
- Choose File, then Make a copy and save it to your own Google Drive.
- Go to the Data tab and paste your own weekly timesheet records over the sample rows. Keep the header row unchanged.
- Use the slicers on each page to filter the charts and pivots.
- Move through Overview, Departments, Overtime and Workforce from the navigation bar at the top.
💼 Real-World Use Cases
The monthly overtime review. A payroll manager filters to one month on the Overview page and compares overtime pay with total labor cost by department.
The approval check. An operations manager opens the Overtime page, picks the Unapproved status on the OT Approval slicer and sees which reasons, shifts and states are behind the hours nobody signed off.
The staffing decision. A department head looks at overtime hours by reason, sees that staffing shortage is the biggest driver, and uses the figures in a hiring request.
❓ Frequently Asked Questions
What does the Overtime and Labor Cost Dashboard in Google Sheets show?
It turns weekly timesheet records into a clear view of total labor cost, overtime pay, overtime hours and the overtime share of hours, split by department, job role, shift, state, employment type, overtime reason and approval status.
Is this a payroll or time clock system?
No. It is a reporting dashboard. You paste or type weekly timesheet records into the Data tab, and the pages report on them. It does not clock people in or run payroll.
How do I get my own copy?
Open the PDF guide in your download, click the link and choose File, then Make a copy. The copy lands in your Google Drive and is fully editable.
Do I need add-ons, scripts or macros?
No. It is built with formulas, pivot tables and native slicers. There is no add-on, no Apps Script and no macro to authorise.
How many timesheet rows can it hold?
The pivots, slicers and formulas are set up for up to 1,000 weekly timesheet rows. Paste your own rows over the sample rows and everything recalculates.
Is the sample data real?
No. All employees, departments and figures on the Data tab are fictional. Replace them with your own payroll export.
Can I change the departments, shifts, states or overtime reasons?
Yes. Use your own values in the Data tab columns and the pivots and slicers pick them up.
How is overtime pay calculated?
The Instructions tab explains it: overtime pay uses time-and-a-half on the hourly rate, and the overtime premium cost is the extra paid above the regular rate. You can edit the multiplier to match your own policy.
👤 About the Author
Built by PK, Microsoft Certified Professional with 15+ years of Excel, Google Sheets and Power BI experience. Founder of NextGenTemplates. Every template is hand-built and tested before release.
🔗 Explore Related Templates
- Payroll Management Dashboard in Google Sheets: payroll cost analytics by department, pay grade and run status.
- Billable Hours and Time Tracker in Google Sheets: capture the hours this dashboard reports on.
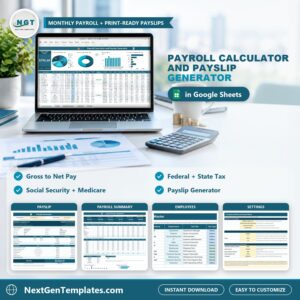
- Payroll Calculator and Payslip Generator in Google Sheets: gross to net pay and payslips.
- Payroll and Salary Management System Web App: a browser-based payroll system.
Browse all Google Sheets dashboards.
🎥 Visit our YouTube channel for step-by-step video tutorials
👉 YouTube.com/@NextGenTemplates
📅 Last updated: November 2026
Compatibility and Requirements
- Works in Google Sheets. You need a free Google account and a web browser.
- Every chart reads a native Google Sheets pivot table. Google explains how to build charts in Add and edit a chart or graph.



















Reviews
There are no reviews yet.