


The best waste management dashboard template for most collection operators in 2026 is the Waste Management Dashboard ($13.99 in Excel, $17.99 in Power BI). It shows vehicles, operating cost, maintenance cost, labor cost and service rating by waste type, zone, team and month. Recycling plants should pair it with a recycling KPI dashboard.
Last updated: October 2026
Key takeaways
- Our top pick is the Waste Management Dashboard: five report pages covering fleet, cost, zones, collection teams and monthly trends, from $13.99.
- Teams that report to a council, client or board get monthly KPIs against target and last year in the Waste Management KPI Dashboard, from $9.99 in Google Sheets.
- Recycling programs and material recovery facilities have their own files: the Recycling KPI Dashboard and the Recycling Companies KPI Dashboard.
- E-waste and food waste recyclers get dedicated five-page dashboards with recovered value, diversion and CO2 avoided, at $17.99 each.
- Every pick is a one-time purchase from $9.99 to $17.99, with no fee per truck, site or user.
 Launch offer
SUMIFS, XLOOKUP, FILTER, LAMBDA and checking AI-written formulas, with real business projects. 11h 47m of video by PK, with practice files, quizzes and a capstone.
Waste management dashboard templates compared
| Template | Format | Best For | Price |
|---|---|---|---|
| Waste Management Dashboard (Best overall) | Excel, Power BI | Collection fleet, operating cost and service rating by zone and team | $13.99 to $17.99 |
| Waste Management KPI Dashboard (Best value) | Excel, Power BI, Google Sheets | Monthly KPIs against target and last year | $9.99 to $12.99 |
| Recycling KPI Dashboard | Excel, Power BI, Google Sheets | Recycling programs: recycling rate, recovery and cost per ton | $9.99 to $14.99 |
| Recycling Companies KPI Dashboard | Excel, Power BI | MRFs and recycling plants: contamination, output and revenue per ton | $11.99 to $14.99 |
| E-waste Recycling Dashboard | Excel, Power BI | E-waste collectors and processors | $17.99 |
| Food Waste Recycling Dashboard | Excel, Power BI | Composting, digestion and food recovery programs | $17.99 |
Why do waste and recycling teams need a dashboard?
Waste is a volume business with thin margins. A collection contractor pays for fuel, drivers, maintenance and landfill or processing fees on every ton, and a recycling plant lives or dies on contamination and the price it gets for each bale. The numbers exist, but they sit in different places: the weighbridge, the fuel cards, the workshop log, the routing tool and the billing system.
The scale of the problem is large. The US EPA puts municipal solid waste at 292.4 million tons in 2018, about 4.9 pounds per person per day, with a combined recycling and composting rate of 32.1% (see the EPA national overview of materials, waste and recycling). Every council, hauler and recycler is being asked to move that rate up while holding cost down, and that needs a monthly report someone can trust.
Waste and recycling software from vendors such as AMCS or Routeware does far more than report, and it is usually priced by quote, per truck or per user. For a small hauler, a council department or a single recycling site, a waste management dashboard template does the reporting half of the job for a one-time price, using the totals your existing systems already produce.
How we picked these waste management templates
We searched the NextGenTemplates catalog for files built for waste collection, waste reduction, recycling, recycling companies, recycling infrastructure, e-waste and food waste, and read each product page for what it actually tracks: vehicles and cost, KPIs against targets, contamination, recovered value and diversion. We left out general asset trackers that only share a word with the topic.
Where one tool comes in several formats, we list it once with every price. We ranked on three things: how much of a waste or recycling team’s monthly reporting a file covers, how quickly a small team can load its own figures, and price. If you also report wider ESG figures, our ESG KPIs guide covers the metrics that sit beside waste.
The 6 best waste management and recycling templates for 2026
1. Waste Management Dashboard: best overall
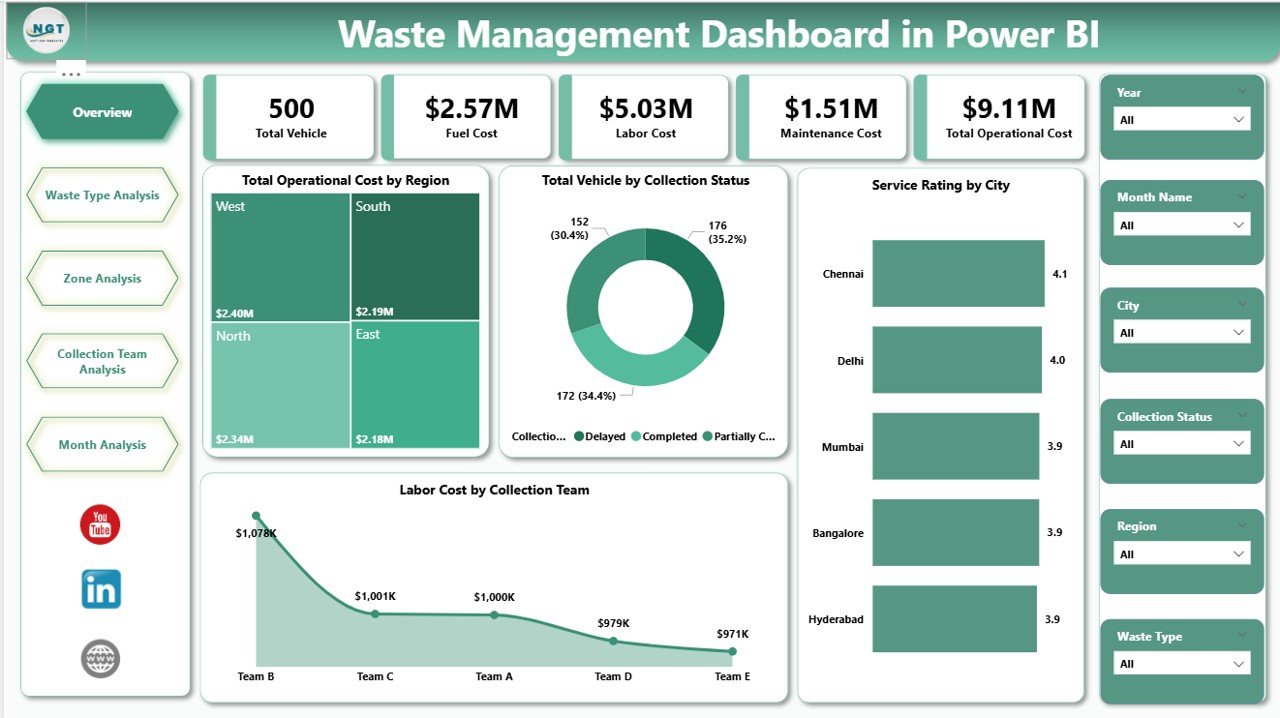
This is the file we would hand to an operations manager at a hauler or a council waste department. It answers the questions that come up every week: how many trucks are on the road, what the fleet is costing, which zone or crew is slipping, and whether service ratings are holding.
Who it is for: municipal waste departments, private collection contractors, environmental service providers and facility management companies.
What is inside:
- Five pages: Overview, Waste Type, Zone, Collection Team and Month Analysis, with a page navigator down the left side
- Overview KPI cards for total vehicles, operating cost, maintenance cost and average service rating, plus charts for service rating by city, vehicles by collection status, operating cost by region and labor cost by team
- Slicers for waste type, zone, region, team and month, so you can isolate hazardous or recyclable routes in one click
- One data sheet (date, zone, waste type, vehicle ID, costs, service rating) feeding every chart after a Refresh All
The Power BI edition ($17.99) adds fuel cost and vehicle status (active, under maintenance, inactive) and splits cost across organic, plastic, metal, e-waste and hazardous streams. The Excel edition costs $13.99 and runs on pivot tables, so anyone comfortable with Excel can extend it.
Price: $13.99 in Excel, $17.99 in Power BI. Verdict: the best single file if your job is running collection operations at a sensible cost per route.
2. Waste Management KPI Dashboard: best value

A contract with a council or a large commercial client usually comes with KPIs: on-time collection, diversion, contamination, cost per ton. This dashboard is built around that monthly KPI review, with every figure set against its target and last year.
Who it is for: contract managers, municipal waste officers, sustainability leads and environmental consultants who report KPIs on a fixed schedule.
- Sample KPIs in four groups: waste reduction (total waste generated, diversion, recycling, reuse and compost rates), operational efficiency (collection efficiency, equipment downtime, fuel per collection, on-time collection rate), environmental impact (greenhouse gas emissions, landfill share, hazardous waste, contamination) and financial performance (cost per ton, revenue from recycled material, total cost, profit margin)
- A month selector that updates month-to-date and year-to-date actuals, targets and previous-year figures
- Up and down arrows that respect direction, so falling landfill share or downtime shows as an improvement
- Actual, Target and Previous Year input sheets, a KPI Trend sheet and an editable KPI Definition sheet
It comes in Power BI ($11.99) and Google Sheets ($9.99), the cheapest way to share one live KPI file with a whole team. Prefer a single-page grid to charts? The Waste Management KPI Scorecard costs $12.99 in Excel and $9.99 in Google Sheets. Businesses that generate waste rather than collect it should look at the Waste Reduction KPI Dashboard ($14.99, or $8.99 in Google Sheets).
Price: $12.99 in Excel. Verdict: the best value pick when the monthly question is “did we hit the contract KPIs?”
3. Recycling KPI Dashboard: best for recycling programs
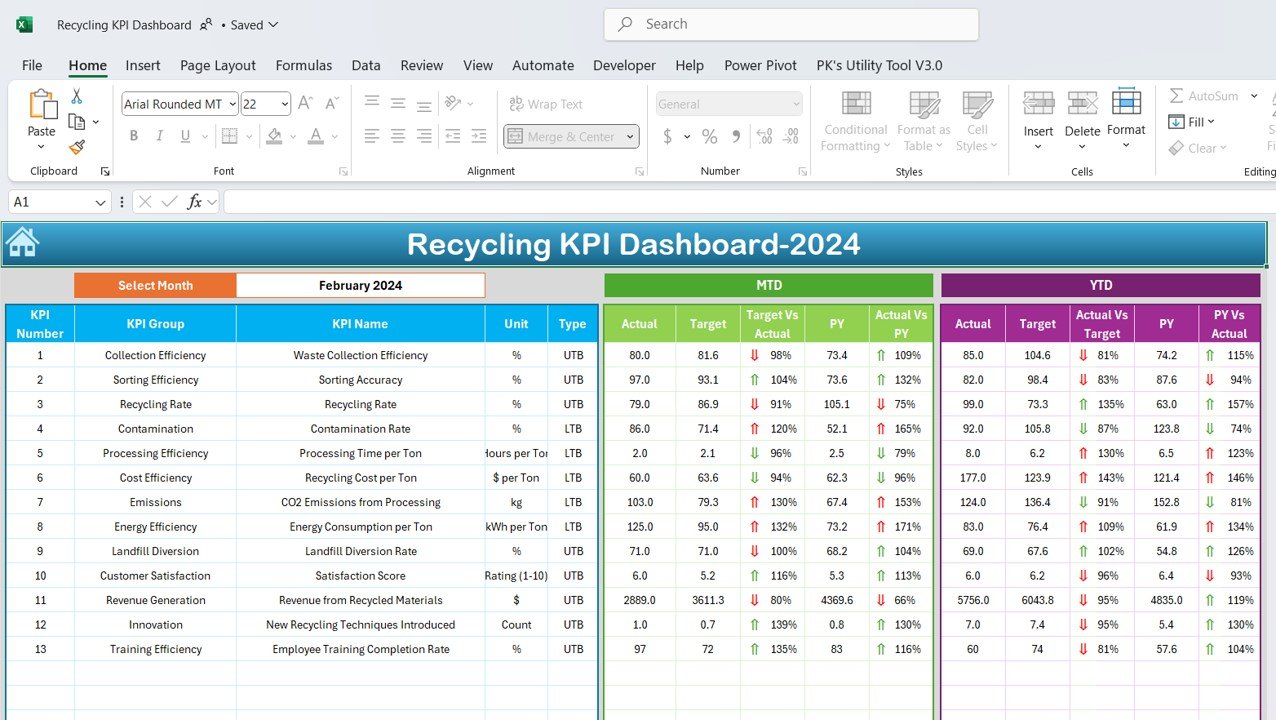
A recycling program is judged on two things: how much material it actually recovers and what each ton costs. This dashboard keeps both in view, month by month, for a council scheme, a campus or a corporate recycling program.
Who it is for: recycling coordinators, sustainability managers, municipal program leads and recycling facility managers.
- KPIs for recycling rate, material recovery, waste diversion, cost per ton, operational efficiency and community participation
- MTD and YTD results against target and last year, with color-coded alerts on low recycling rates or high costs
- A trend chart for any KPI you choose and a definition sheet you can extend with your own measures
It comes in Power BI ($11.99) and Google Sheets ($9.99). The Recycling KPI Scorecard gives the same discipline on one page for $12.99, or $9.99 in Google Sheets.
Price: $14.99 in Excel. Verdict: the right pick if you run a recycling program and need to show progress on recovery and cost.
Not sure yet? Most collection teams start with the Waste Management Dashboard at $13.99 for operations, and add the Waste Management KPI Dashboard in Google Sheets at $9.99 for the monthly KPI pack. Together they cost less than $25, once.
4. Recycling Companies KPI Dashboard: best for MRFs and recycling plants
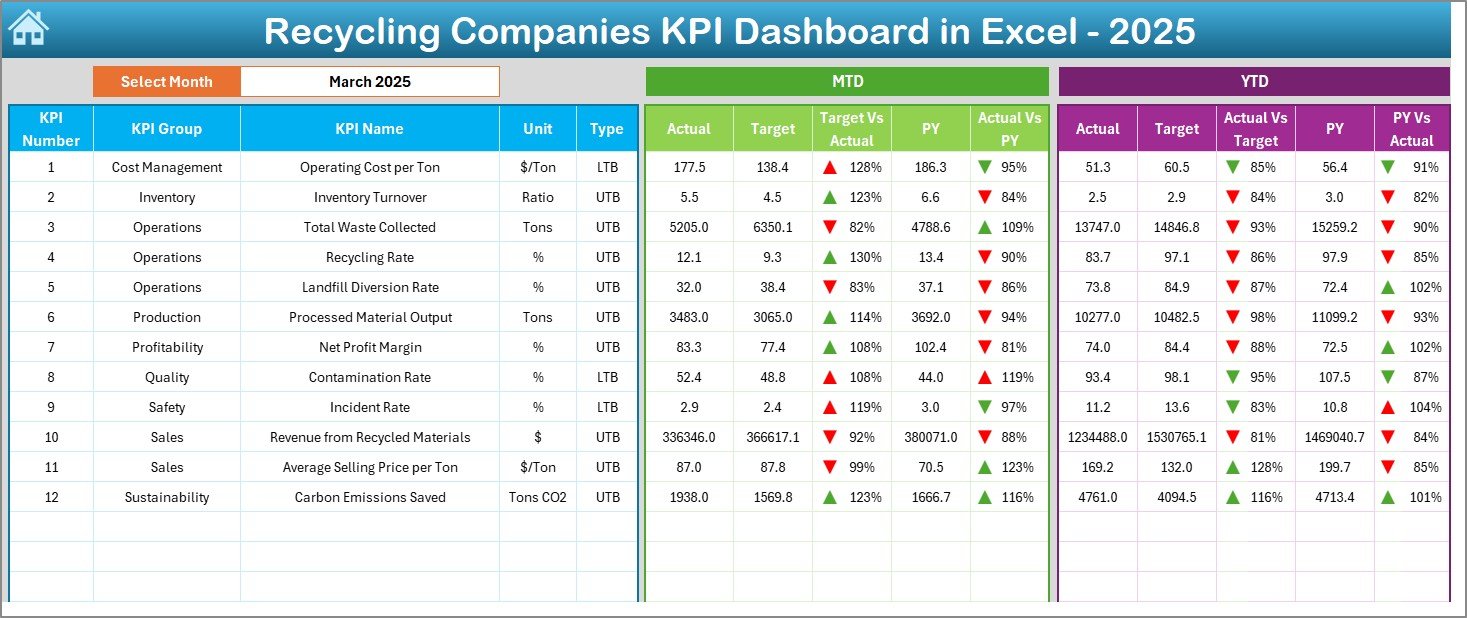
A recycling business is a processing business. What matters is throughput, contamination, safety and the price each ton fetches. This dashboard is built for that plant-floor and finance view rather than a public program.
Who it is for: plant managers at material recovery facilities, owners of recycling businesses and their finance teams.
- Twelve sample KPIs: operating cost per ton, inventory turnover, total waste collected, recycling rate, landfill diversion rate, processed material output, net profit margin, contamination rate, incident rate, revenue from recycled materials, average selling price per ton and carbon emissions saved
- Seven worksheets: Home, Dashboard, KPI Trend, Actual Numbers, Target, Previous Year Numbers and KPI Definition
- A month selector in cell D3 that refreshes every MTD and YTD comparison, with conditional-format arrows
The Power BI edition costs $11.99. Planning or running the wider network of drop-off sites, transfer stations and facilities? The Recycling Infrastructure Dashboard ($17.99 in Excel or Power BI) tracks tonnage, collection and processing cost, emissions avoided, facility rating and project status, and a KPI version costs $14.99.
Price: $14.99 in Excel. Verdict: the pick for anyone who sells recovered material and needs to watch contamination and margin per ton.
5. E-waste Recycling Dashboard: best for electronics recyclers
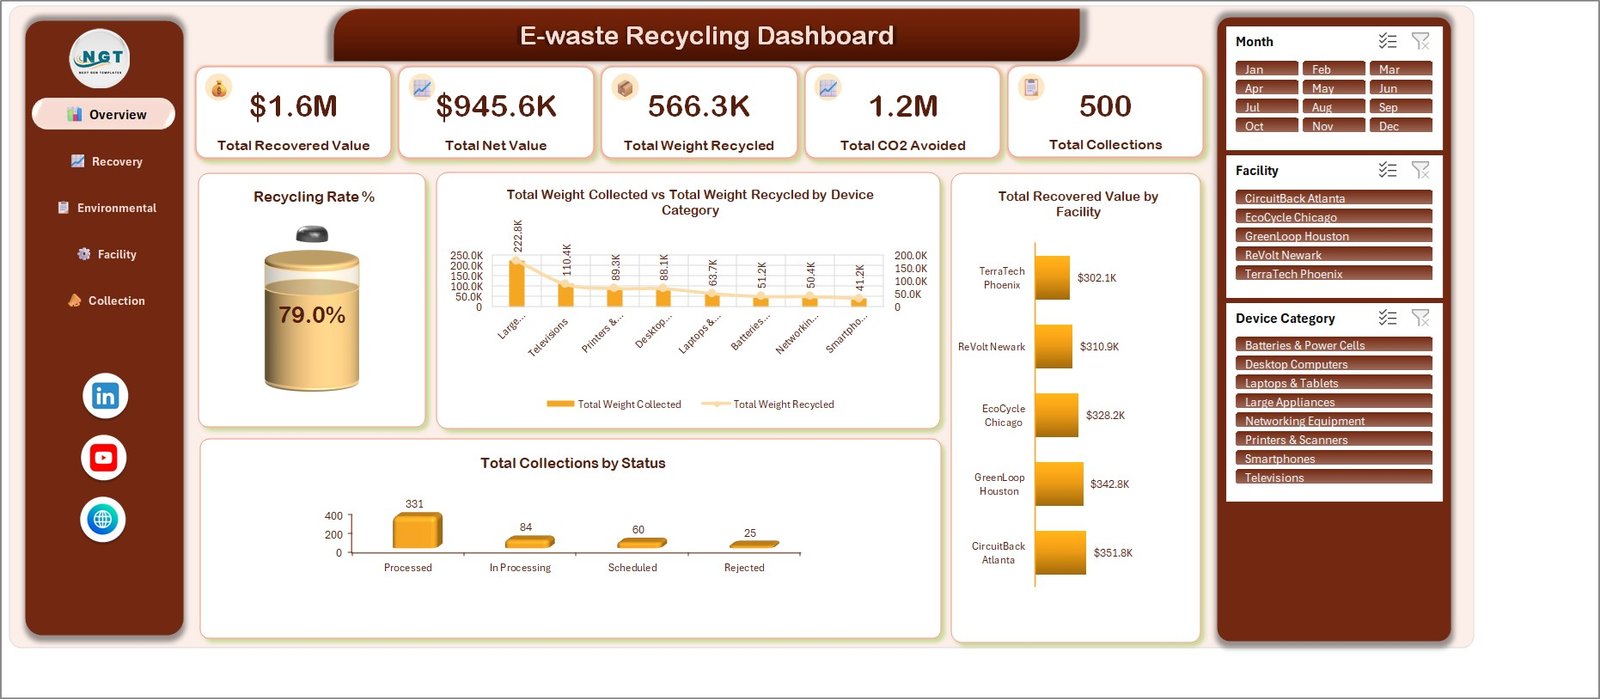
Electronics recycling has its own economics: recovered metal value, device categories and collection channels such as drop-off events and corporate pickups. The EPA electronics recycling guidance explains why this stream is handled apart from general waste, and this dashboard reports it on its own terms.
Who it is for: e-waste collectors, IT asset disposition (ITAD) teams and electronics processors.
- Five report pages: Overview, Recovery Analysis, Environmental Impact, Facility Performance and Collection Channels
- Five KPI cards (recovered value, net value, weight recycled, CO2 avoided, collections) and 20 charts
- Slicers for month, facility and device category, all reading from one data sheet with 500 sample records you replace with your own
The Power BI edition also costs $17.99. It is a reporting file only: it is not a certificate of destruction or proof of R2, e-Stewards or WEEE compliance.
Price: $17.99 in Excel. Verdict: the best fit if electronics are your main stream and you report recovered value by facility.
6. Food Waste Recycling Dashboard: best for organics programs
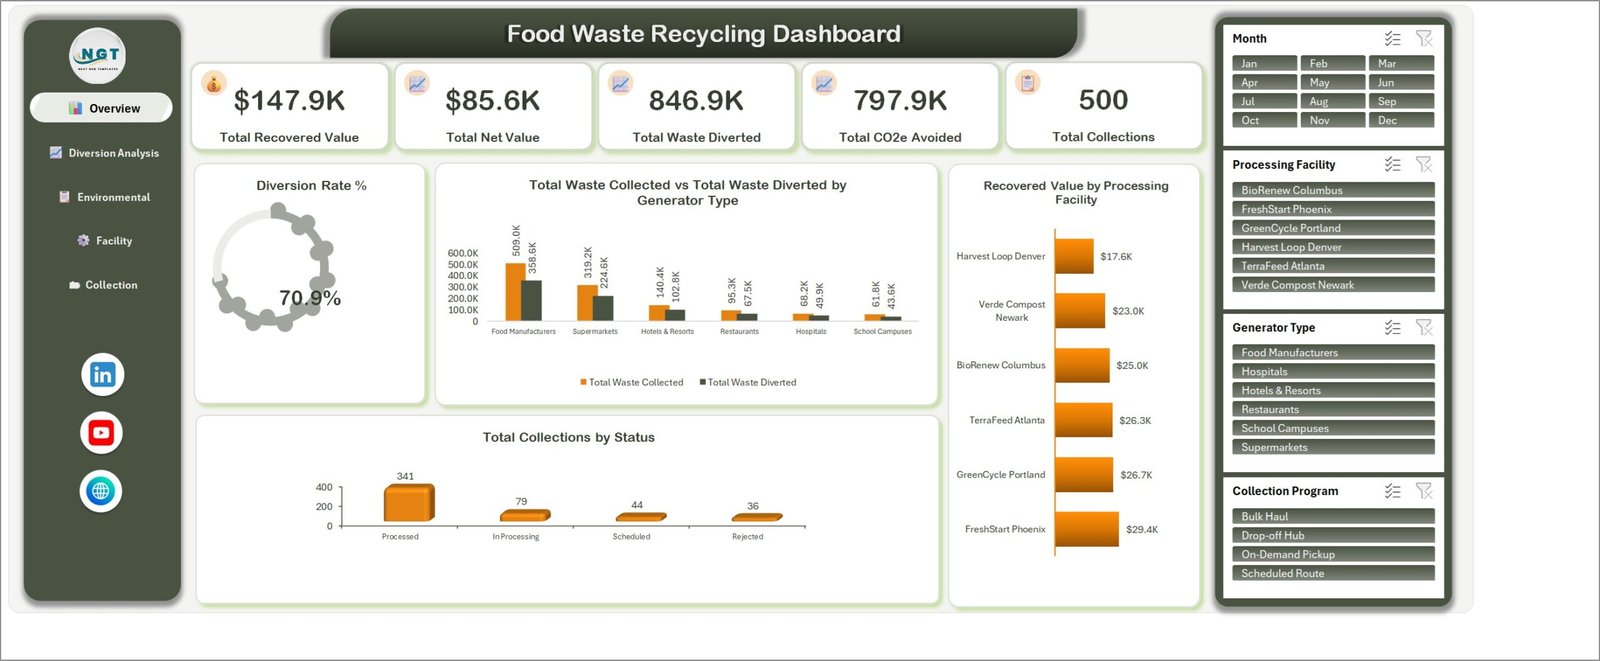
Food waste is one of the largest parts of the waste stream, and diverting it means tracking several routes at once: composting, anaerobic digestion, food donation, animal feed and rendering. This dashboard compares them side by side.
Who it is for: organics haulers, composting and digestion sites, food recovery programs and sustainability teams at food businesses.
- Five pages: Overview, Diversion Analysis, Environmental Impact, Facility Performance and Collection Programs
- KPIs for recovered value, net value, waste diverted, CO2e avoided and collections, with a diversion rate gauge
- Filters for month, processing facility, generator type and collection program (scheduled routes, bulk haul, on-demand pickup, drop-off hubs)
The Power BI edition also costs $17.99. Restaurants that want to cut waste at source should also read our restaurant and hospitality dashboard templates.
Price: $17.99 in Excel. Verdict: the pick for anyone measuring how much food waste stays out of landfill, and by which route.
Which waste management KPIs should you track?
Whichever template you choose, these are the measures most waste and recycling reviews come back to. Agree the formula once, write it on the KPI definition sheet, and keep it the same every month so trends mean something.
| KPI | Formula | Direction |
|---|---|---|
| Waste diversion rate | Tons diverted from landfill / Total tons generated x 100 | Higher is better |
| Recycling rate | Tons recycled / Total tons collected x 100 | Higher is better |
| Contamination rate | Tons of non-recyclable material in recycling / Total recycling tons x 100 | Lower is better |
| Cost per ton | Total collection and processing cost / Tons handled | Lower is better |
| On-time collection rate | Collections completed on schedule / Collections scheduled x 100 | Higher is better |
| Fuel per collection | Liters (or gallons) of fuel / Collections or tons | Lower is better |
| Equipment downtime | Hours vehicles or plant were unavailable | Lower is better |
| Revenue per ton | Revenue from recovered material / Tons sold | Higher is better |
| Landfill share | Tons landfilled / Total tons generated x 100 | Lower is better |
A worked example: a hauler collects 1,200 tons in a month at a total cost of $84,000, and 420 tons go to recycling or composting. Cost per ton is $70 and the diversion rate is 35%. If 50 of those 420 tons are rejected at the MRF, the contamination rate is about 12%, and the true diversion rate drops to roughly 31%. That gap is exactly what a monthly dashboard should make visible.
Fleet-heavy operations should also read our logistics KPIs guide and maintenance KPIs guide, and safety leads can use our safety KPIs guide covering TRIR and LTIFR.
How do you choose the right waste management template?
| If you are… | Start with |
|---|---|
| A hauler or council department running trucks and crews | Waste Management Dashboard |
| A contract manager reporting KPIs to a client or council | Waste Management KPI Dashboard |
| A recycling coordinator running a public or corporate program | Recycling KPI Dashboard |
| A MRF or recycling plant manager watching contamination and margin | Recycling Companies KPI Dashboard |
| An electronics recycler or ITAD provider | E-waste Recycling Dashboard |
| An organics hauler, composter or food recovery program | Food Waste Recycling Dashboard |
| An office or facility team cutting its own waste | Office Waste Management Dashboard |
A common setup is one operations file and one KPI file: the Waste Management Dashboard for the weekly operations meeting and the Waste Management KPI Dashboard for the monthly contract review. Office and facility teams can start smaller with the Office Waste Management Dashboard in Google Sheets at $6.99, and should also see our facility management templates. Public-sector teams will find more in our government dashboard templates, and food producers in our food and beverage manufacturing dashboards. City programme teams that report waste alongside mobility, water and safety KPIs can compare our smart city dashboard templates.
When a template is NOT the right answer
- You need route optimization or live truck tracking. These files report what happened. Planning routes, dispatching drivers and tracking vehicles by GPS needs routing or fleet software.
- You need weighbridge tickets and customer billing. Scale-house and billing systems record each load and invoice it. A dashboard reads their monthly totals; it does not replace them.
- You need legal compliance records. Waste transfer notes, manifests, certificates of destruction and permit returns must come from systems built for them. None of these templates carries legal standing.
- Nobody owns the monthly load. A dashboard is only as current as its last update. If no one will enter the month’s figures, the numbers go stale fast.
For most small and mid-sized haulers, councils and recycling sites, a waste management dashboard template is the quickest way to get a clean monthly report without another subscription. Want to try a free file first? See our free Excel dashboard templates and free Power BI dashboard templates. Every paid file here is fully editable, which matters more than it sounds; our guide to editable vs locked templates explains why. Energy and carbon leads can go further with our energy management KPIs guide. ESG teams should also compare our sustainability reporting templates.
Frequently asked questions
What is a waste management dashboard template?
It is a ready-made Excel, Google Sheets or Power BI file that turns your collection, cost and recycling records into one report. You enter or paste your own figures and the charts, KPI cards and month-by-month comparisons update. It replaces the monthly report you build by hand, not the routing or weighbridge software that captures the data.
Which waste management template should I buy first?
If you run trucks and crews, start with the Waste Management Dashboard: $13.99 in Excel or $17.99 in Power BI, with vehicles, operating cost, maintenance cost and service rating by zone and team. If you report KPIs against targets to a council or board, start with the Waste Management KPI Dashboard from $9.99.
How do you calculate waste diversion rate?
Divide the tonnage kept out of landfill (recycled, composted, reused or otherwise recovered) by the total waste generated, then multiply by 100. If a site generates 500 tons in a month and 210 tons are recycled or composted, the diversion rate is 42%. Decide once whether energy recovery counts, then keep that rule every month.
What is a good recycling rate?
It depends on the material and the program, so compare against your own last year and your contract or local target first. For context, the US EPA reported a national recycling and composting rate of 32.1% for municipal solid waste in 2018, its most recent full national figure.
Is there a waste management template in Google Sheets?
Yes. The Waste Management KPI Dashboard costs $9.99 in Google Sheets, and so do the Waste Management KPI Scorecard, the Recycling KPI Dashboard and the Recycling KPI Scorecard. The Waste Reduction KPI Dashboard costs $8.99 and the Office Waste Management Dashboard costs $6.99 in Google Sheets.
Which template suits a material recovery facility (MRF)?
The Recycling Companies KPI Dashboard. Its sample KPIs include operating cost per ton, inventory turnover, processed material output, contamination rate, revenue from recycled materials and average selling price per ton. It costs $14.99 in Excel or $11.99 in Power BI and compares each month with target and last year.
Can these templates track e-waste or food waste separately?
Yes. The E-waste Recycling Dashboard reports recovered value, weight recycled, CO2 avoided and collections by facility and device category. The Food Waste Recycling Dashboard reports waste diverted by method, such as composting, anaerobic digestion and food donation, plus generator type and collection program. Each costs $17.99 in Excel or Power BI.
Do these dashboards prove regulatory compliance?
No. They report the figures you enter. They are not waste transfer notes, certificates of destruction, chain-of-custody records or proof of R2, e-Stewards or WEEE compliance. Use them to review performance and prepare internal reports, and keep the official records your permits and contracts require.
Do the templates connect to weighbridge or routing software?
Not directly. Export monthly totals or a CSV from your scale house, routing or billing system and paste them into the data or input sheets. The Power BI editions can point at an Excel or CSV export, so a regular export to a shared folder keeps the dashboard close to current.
Are these waste and recycling templates a one-time purchase?
Yes. Prices run from $6.99 to $17.99 per file with no subscription, no per-user seat and no charge per truck or site. You download the file, edit it to match your own waste streams, zones and KPIs, and keep it.
Get your waste management dashboard template
Start with the Waste Management Dashboard ($13.99 in Excel, $17.99 in Power BI) to see fleet, cost and service rating by zone and team in one file. Add the Waste Management KPI Dashboard from $9.99 for the monthly KPI review, or pick the recycling, e-waste or food waste file that matches your stream. Each one is a one-time purchase you can edit and keep. Step-by-step walkthroughs are on our YouTube channel.