

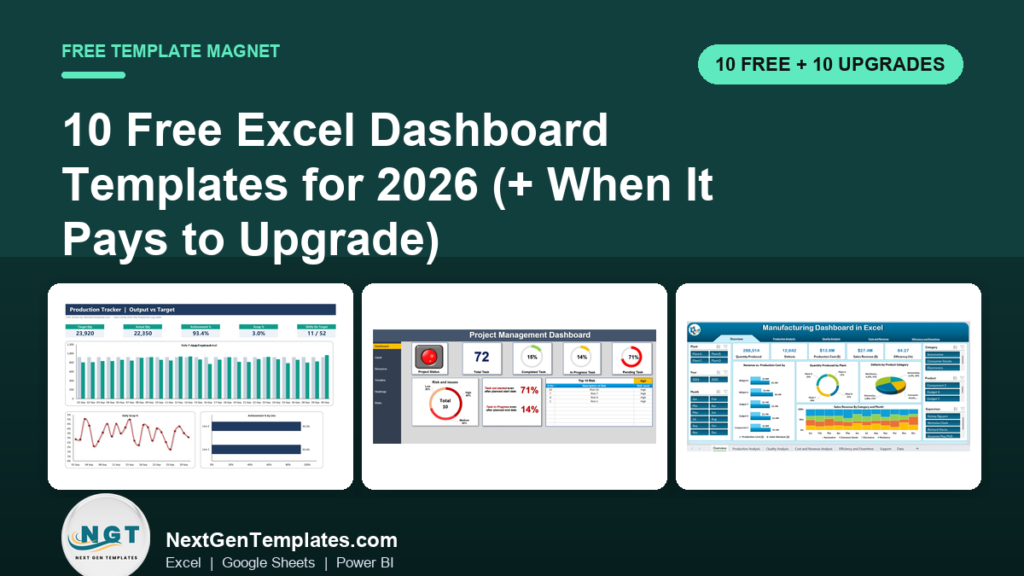
The best free Excel dashboard templates for 2026 come from three places you can trust: NextGenTemplates’ own free downloads, PK: An Excel Expert’s free dashboard files, and the free template libraries at Smartsheet and Chandoo. Our top free pick is the Production Tracker in Excel, a plain .xlsx with 5 KPI cards, 3 auto-updating charts and a 32-step build guide.
Last updated: October 2026
Related guide: If you have a small budget rather than zero budget, see cheap Excel dashboard templates under $15.
Key takeaways
- All 10 templates in the free list below cost nothing to download; we opened every source page in October 2026 to confirm it.
- Best overall free pick: the Production Tracker in Excel from NextGenTemplates, a macro-free .xlsx with sample data and a 32-step “How to Build” sheet.
- Free templates are usually one-topic, one-page files. They stop paying off when you need several pages, slicers across sheets, MTD/YTD logic or more than one department.
- Paid upgrades in this guide run from $12.99 to $17.99 each, paid once; the KPI Dashboard Library bundles 15 Excel KPI dashboards for $89.99 (about $6 a dashboard).
- Microsoft’s old template gallery link now redirects to the Microsoft 365 Create sign-in page, so the reliable free sources have changed since most 2023-2024 lists were written.
Free Excel dashboard templates compared
Every free file in this guide, side by side. One row is flagged best overall. Price is “Free” for all ten because all ten are free.
| # | Template | Source | Format | Best For | Price |
|---|---|---|---|---|---|
| 1 | Production Tracker in Excel (Best overall) | NextGenTemplates | Excel .xlsx, no macros | Output vs target by shift and line | Free |
| 2 | HR Attrition and Head Count Analysis Dashboard | PK: An Excel Expert | Excel, Power Pivot + DAX | Attrition %, YTD and annualised attrition | Free |
| 3 | One Page Sales Dashboard | NextGenTemplates | Google Sheets (download as .xlsx) | Revenue, profit, orders, margin by region | Free |
| 4 | KPI Performance Dashboard Template | Smartsheet | Excel | Project KPIs, risks and issues | Free |
| 5 | Project Management Dashboard Template | Smartsheet | Excel | Task timeline, status and budget | Free |
| 6 | Sales Management Dashboard Template | Smartsheet | Excel | Rep, region, product and outlet mix | Free |
| 7 | Budget Dashboard Template | Smartsheet | Excel | Planned vs actual labour and materials | Free |
| 8 | Data Quality Dashboard Template | Smartsheet | Excel | Valid, invalid and missing records | Free |
| 9 | Simple KPI Dashboard | Chandoo.org | Excel + tutorial | Learning to build a KPI trend page | Free |
| 10 | Interactive Project Dashboard | Chandoo.org | Excel + tutorial | Project status at a glance | Free |
And the paid Excel upgrades we recommend once a free file runs out of road. One row is best overall, one is best value.
| Upgrade | Format | Best For | Price |
|---|---|---|---|
| KPI Dashboard Library (Excel), 15 templates (Best value) | Excel | Analysts and consultants covering many industries | $89.99 |
| Project Management Dashboard in Excel (Best overall) | Excel | One project: tasks, Gantt, resources, risks | $17.99 |
| Multiple Projects Management Dashboard in Excel | Excel | Portfolios, PMs and departments | $17.99 |
| Project Timeline Dashboard in Excel | Excel VBA | Milestones with add/update/delete buttons | $17.99 |
| Manufacturing Dashboard in Excel | Excel | OEE, downtime, FPY, MTBF, MTTR | $17.99 |
| HR Performance Dashboard in Excel | Excel | Performance, attendance, training | $17.99 |
| Employee Performance Review Dashboard in Excel | Excel | Review cycles, reviewers, skill scores | $17.99 |
| Sales KPI Dashboard in Excel | Excel | Sales targets, growth, conversion | $12.99 |
| Finance and Accounting Performance KPI Dashboard in Excel | Excel | Revenue, margin, cash flow, budget vs actual | $12.99 |
| Healthcare Dashboard in Excel | Excel | Patients, revenue, doctor and department metrics | $17.99 |
How we picked these free Excel dashboard templates
We started from the sources people actually search for: Microsoft’s template gallery, Vertex42, Smartsheet, Chandoo, and the free files on NextGenTemplates and PK: An Excel Expert. Every source page was opened in October 2026 and every link in this post was checked.
Two well-known sources did not make the cut. The old Microsoft Create dashboards link now forwards to the Microsoft 365 Create page, which asks you to sign in and leads with Copilot prompts rather than a browsable dashboard gallery. Vertex42’s business template index is strong on Gantt charts, budgets and expense reports, but we did not find a dedicated dashboard template there, so we did not invent one.
A template made the list only if it is a genuine dashboard (charts or KPI cards on a summary page, not just a table), is free to download with no trial clock, and opens in desktop Excel. The paid upgrades come from NextGenTemplates’ catalogue of more than 7,000 templates and were chosen to match the jobs the free files cover, so each one is a direct next step rather than a random upsell.
The 10 best free Excel dashboard templates for 2026
1. Production Tracker in Excel (NextGenTemplates) – best overall free
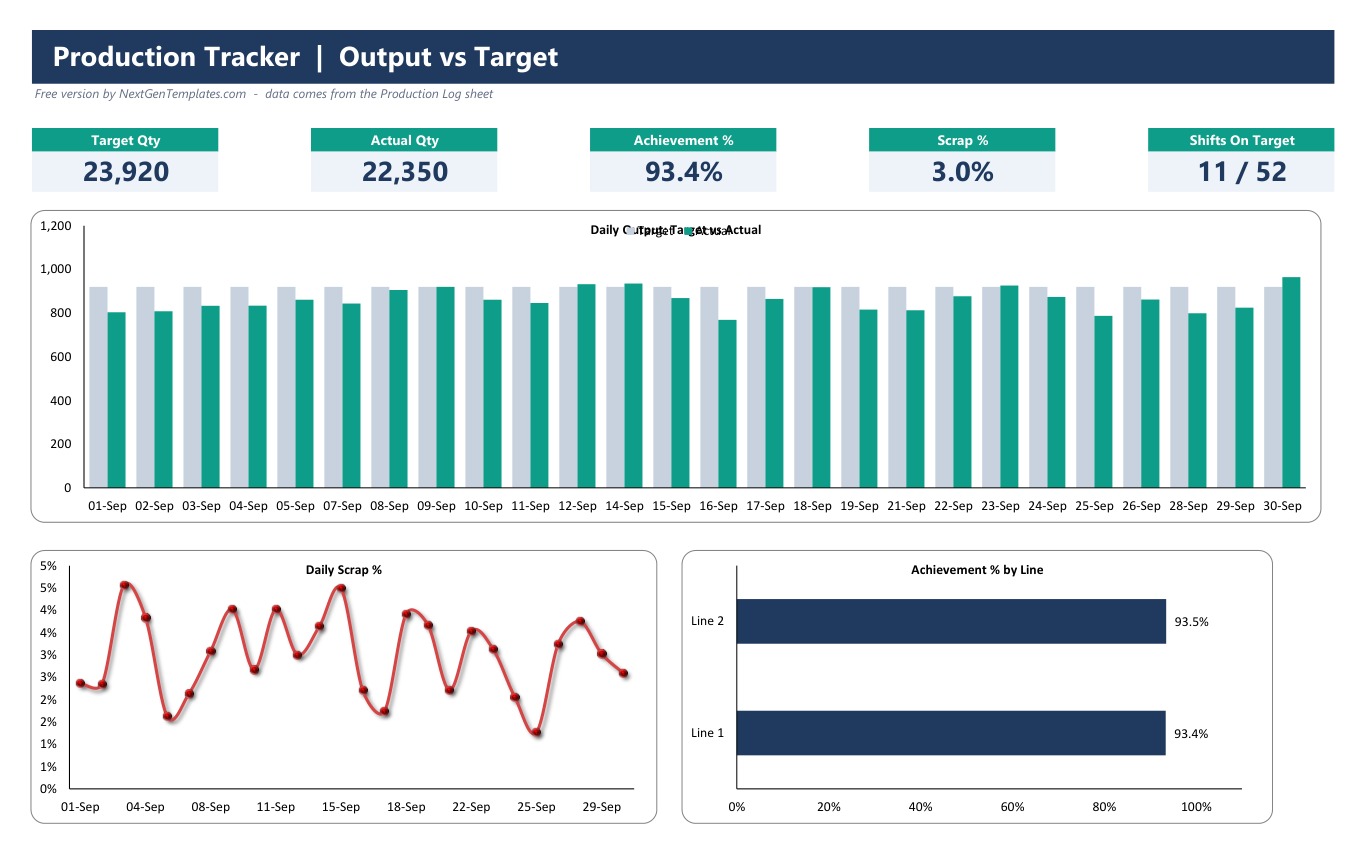
This is the most complete free file on the list and the one we would hand to a beginner first. It turns a simple shift log into an output-versus-target dashboard, and it ships with 52 sample shift entries so you can watch every formula work before you type your own numbers.
What is inside:
- 5 KPI cards: Target Qty, Actual Qty, Achievement %, Scrap % and Shifts On Target
- 3 auto-updating charts: daily output target vs actual, daily scrap % and achievement % by line
- A shift-wise production log with colour-coded On Target / Near Target / Below Target status
- A “How to Build” sheet with all 32 steps and formulas, so you learn the method, not just the file
It is a plain .xlsx with no macros and no add-ins, which matters if your IT team blocks macro-enabled files. Clear the sample rows and you can log real shifts the same day.
Best for: small plants and supervisors who need a daily output view today. Free – get the free production tracker.
2. HR Attrition and Head Count Analysis Dashboard (PK: An Excel Expert)
A more advanced free file, built with Power Pivot and DAX measures rather than plain formulas. The dashboard sheet shows head count, total attrition %, YTD attrition % and annualised attrition % on semi-circle charts, a voluntary vs involuntary doughnut, attrition by tenure with a gender drill-down, and a monthly trend combo chart.
Slicers filter by phase, process, sub-process, year, month, gender and tenure, and a separate table-view sheet repeats the KPIs as a pivot. Because it uses the Data Model, you need desktop Excel for Windows with Power Pivot; Excel for Mac and Excel on the web will not let you edit the model.
Best for: HR analysts who want to learn DAX-based attrition maths. Free – download the HR attrition dashboard.
3. One Page Sales Dashboard (NextGenTemplates)
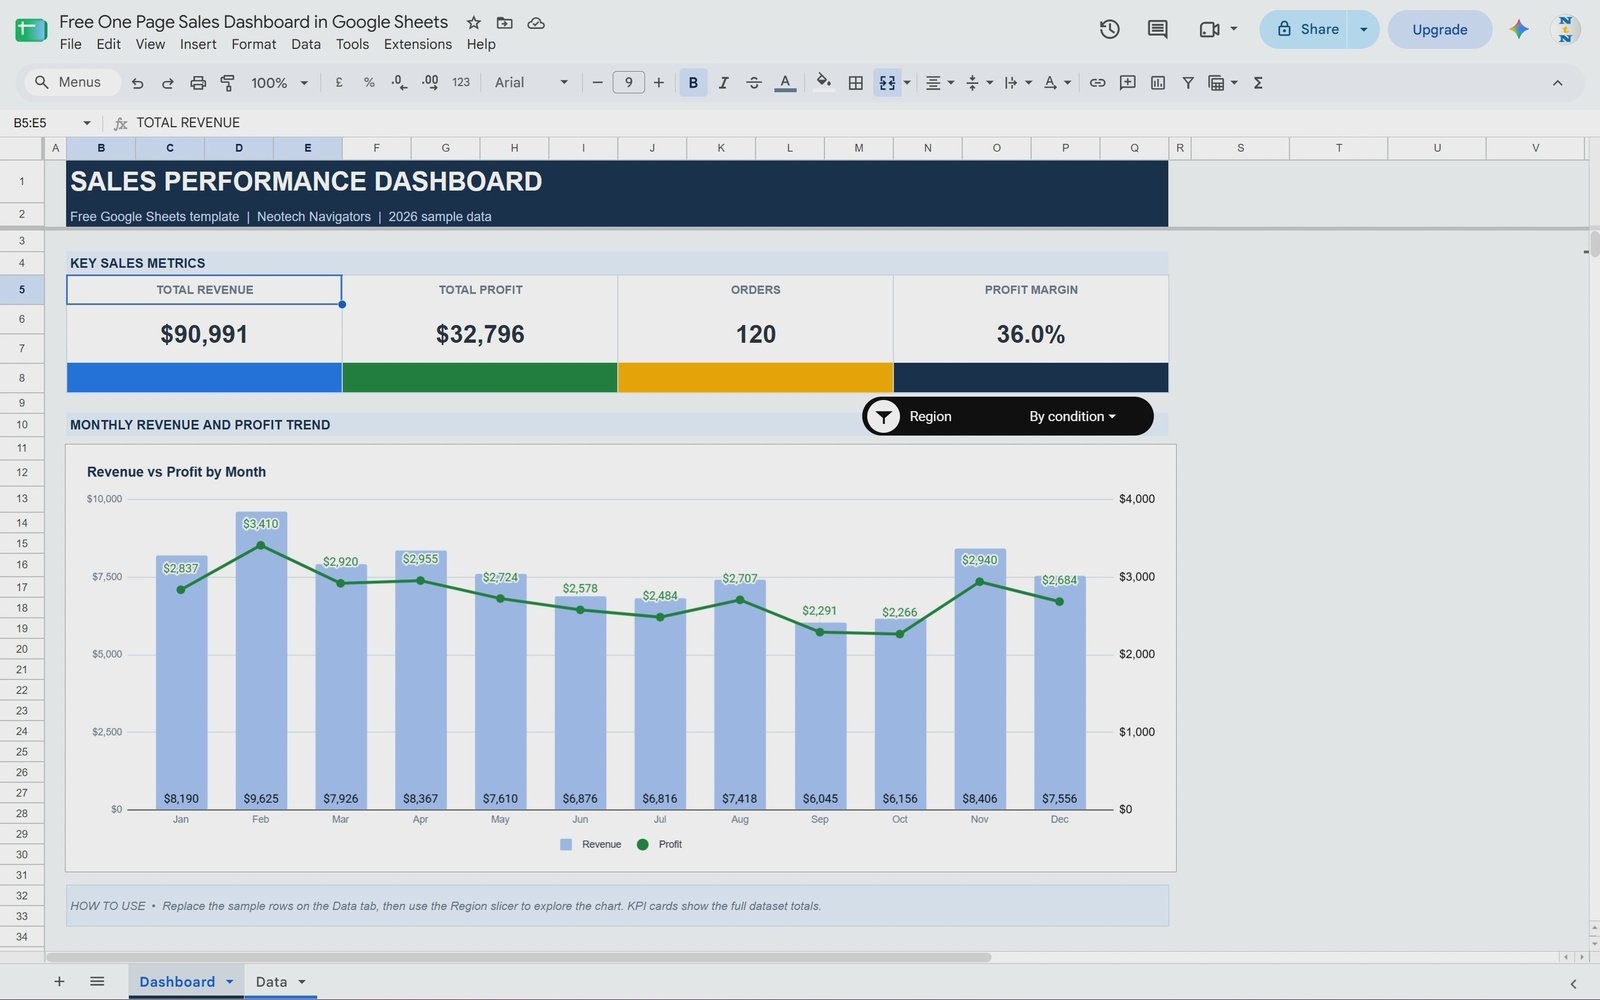
Built in Google Sheets, but worth including for Excel users because Sheets can download any file as .xlsx (File, Download, Microsoft Excel). It puts four KPI cards (Total Revenue, Total Profit, Orders, Profit Margin), a monthly Revenue vs Profit combo chart and a Region slicer on one screen, fed by 120 sample orders.
Prefer to stay in Sheets? See our list of free Google Sheets dashboard templates.
One honest caveat: when you export to Excel, formulas and charts come across, but a Sheets slicer will usually need to be rebuilt as an Excel slicer. There is a Practice Dashboard tab and a video tutorial if you want to rebuild it from scratch.
Best for: a first sales dashboard, or teams that share files in Google Drive. Free – get the one page sales dashboard.
4. KPI Performance Dashboard Template (Smartsheet)
Smartsheet’s free Excel dashboard templates page is the deepest third-party source we found, with eight Excel dashboards, most offered in blank and sample versions. The KPI Performance template tracks schedule, progress and budget status, uses bar charts to categorise risks and issues, and shows monthly and quarterly revenue.
It is project-flavoured despite the name, so read it as a project health page rather than a company KPI scorecard.
Best for: project leads preparing stakeholder check-ins. Free.
5. Project Management Dashboard Template (Smartsheet)
A one-page project view with a task timeline, pie charts for task status and priority, a budget chart comparing actual and planned cost, and a “pending items” area that tallies decisions, actions and change requests.
It is a good free answer for one project. It does not track resources, workload or a risk register, which is where the paid upgrade in the next section takes over.
Best for: weekly status meetings on a single project. Free.
6. Sales Management Dashboard Template (Smartsheet)
Ranks salespeople and shows performance by region, product and outlet, with stacked bar charts for the product-region-outlet mix. Unlike most free sales files it focuses on who sold what and where, not only on totals.
There is no target or conversion logic, so it answers “what happened” better than “are we on plan”.
Best for: quarterly sales reviews. Free.
7. Budget Dashboard Template (Smartsheet)
Categorises planned cost, actual cost and balance for labour and materials, with a one-screen budget overview. It is simple by design, which makes it easy to adapt to a department or event budget.
Best for: project and event budgets with two or three cost types. Free.
8. Data Quality Dashboard Template (Smartsheet)
An unusual one: it charts valid, invalid and missing records, with monthly validity percentages and quarterly issue counts. If you run a migration, an audit or a CRM clean-up, very few dashboards (free or paid) cover this job at all.
Best for: system migrations and data audits. Free.
9. Simple KPI Dashboard (Chandoo.org)
Chandoo’s Simple KPI Dashboard shows several metrics and how each tracked over time. Its real value is the tutorial alongside it: you learn the trend-and-indicator technique well enough to build your own version.
Best for: learning how a KPI page is put together. Free.
10. Interactive Project Dashboard (Chandoo.org)
A dynamic project status dashboard listed on Chandoo’s free templates page. It shows project status and progress at a glance, and the accompanying article explains the design choices step by step.
Best for: people who want an elegant layout to study and copy. Free.
Want the free production tracker by email?
Enter your email and we will send you the free Production Tracker in Excel (template #1 above). No payment and no card. You can unsubscribe at any time.
When does it pay to upgrade from a free Excel dashboard?
Free dashboards are excellent at one thing: showing a single topic on a single page with sample data. In our experience the same five limits push people to a paid file, usually within a month of real use:
- One page is not enough. You need separate pages for overview, trends, detail and data, with navigation between them.
- No time logic. Free files rarely calculate month-to-date, year-to-date and prior-year comparisons, so every month you rebuild the same pivots.
- No targets. Without target-vs-actual columns you can see results but not gaps.
- One department only. HR, sales and finance each need their own KPI definitions.
- No automation. Adding, editing or deleting records by hand in a table gets slow; VBA buttons and forms fix that.
If two or more of these apply, the time you spend patching a free file costs more than a one-time template. The ten upgrades below map directly onto those gaps.
10 paid upgrades for when free stops working
1. Project Management Dashboard in Excel – best overall upgrade
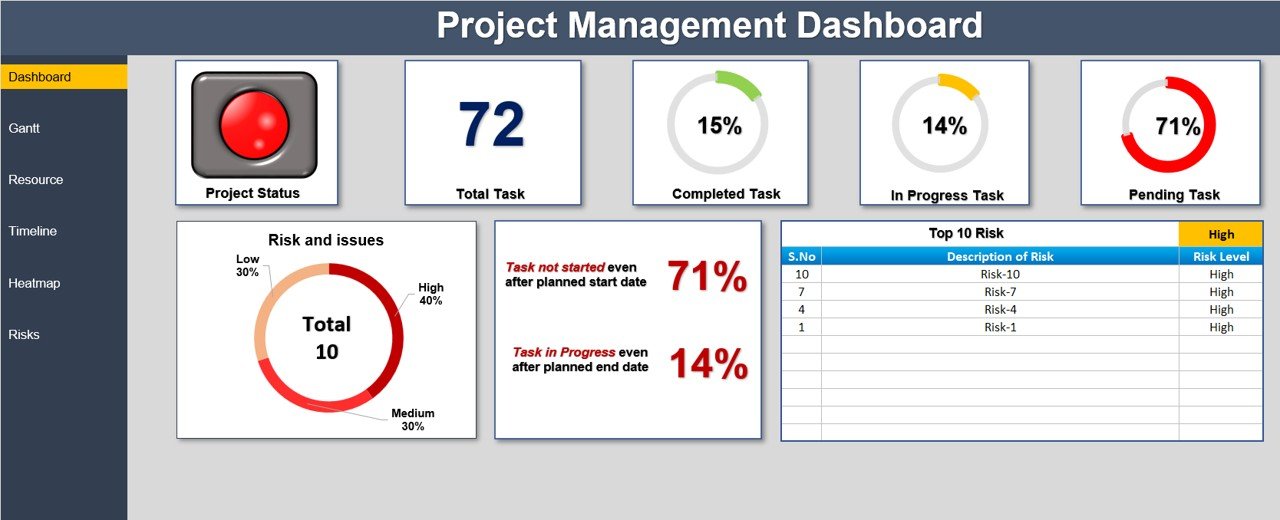
The natural step up from free templates #4, #5 and #10. It combines task status summaries, Gantt scheduling, resource workload views and a risk record with severity and ownership. You enter tasks, dates and assigned resources once, and progress and responsibilities update together.
What it adds over free: resource workload, a risk log and an interactive Gantt view, all in one file. It is also the NGT dashboard that already ranks in Google for “excel project management dashboard templates”.
Best for: one project with several people and real risks. $17.99 – view the project management dashboard.
2. KPI Dashboard Library (Excel), 15 templates – best value
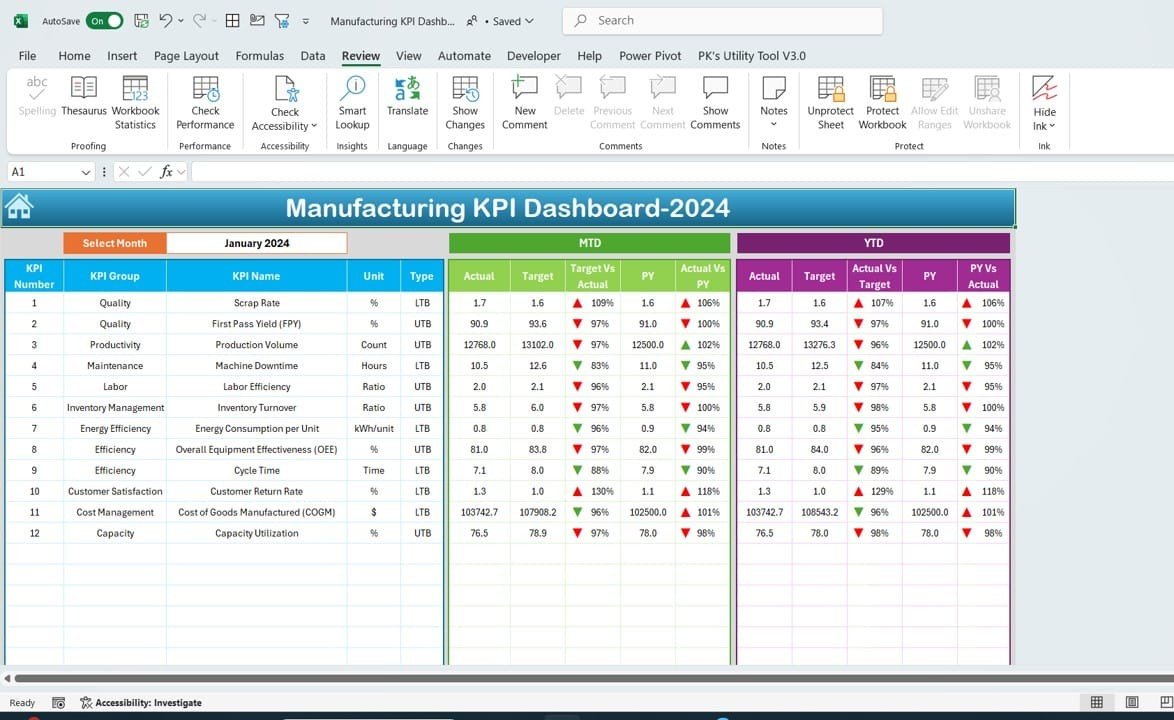
Fifteen Excel KPI dashboards covering manufacturing, IT, logistics, real estate, healthcare, insurance and more. Each one has MTD, YTD and prior-year tracking, target-vs-actual analysis, documented KPI definitions and conditional formatting, and runs fully offline with no add-ins.
What it adds over free: the time logic and target columns that no free file in our list has. Bought individually the 15 dashboards total $194.85; the bundle is $89.99, about $6 per dashboard.
Best for: analysts and consultants who report on several industries. $89.99 – view the KPI Dashboard Library.
3. Multiple Projects Management Dashboard in Excel
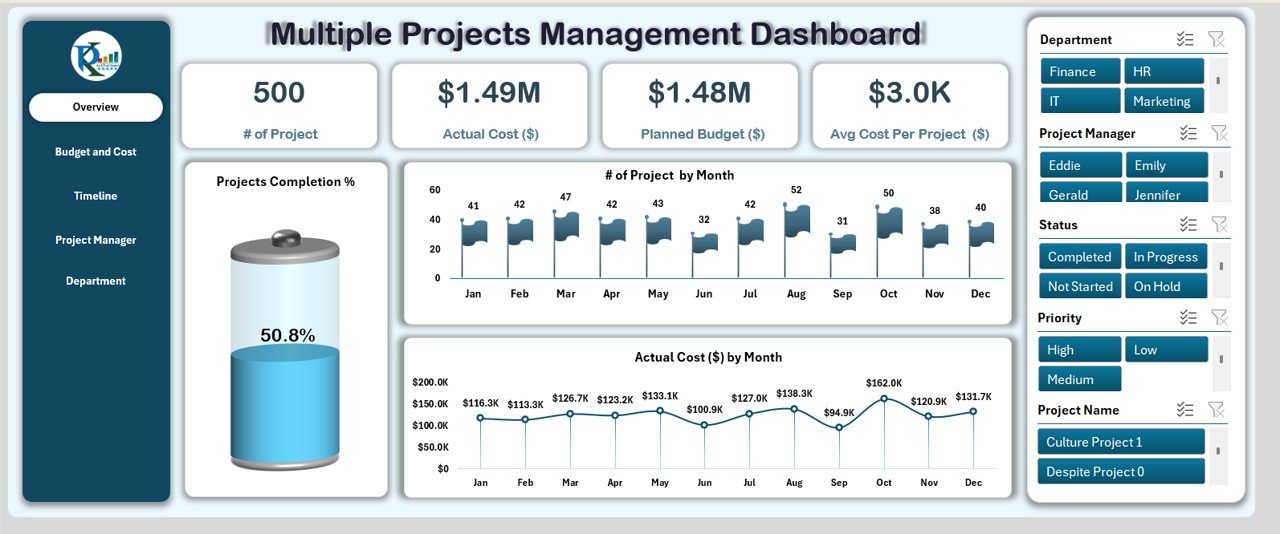
When one project becomes ten. It tracks every project in one place with battery, line and column charts, slicers by department, project manager and completion %, project durations, and actual vs planned cost per project.
What it adds over free: portfolio-level comparison of managers and departments, which Smartsheet’s portfolio sheet only summarises.
Best for: PMOs and agency owners. $17.99 – view the multiple projects dashboard.
4. Project Timeline Dashboard in Excel (VBA)

The automation pick. A dynamic timeline chart visualises milestones, while buttons let you add, update or delete records instead of editing the table by hand. A status pie (Completed, In Progress, Pending) and a priority doughnut (High, Medium, Low) refresh as records change.
What it adds over free: VBA record management, the single biggest time-saver none of the free files offer.
Best for: milestone-heavy projects updated by non-Excel people. $17.99 – view the project timeline dashboard.
5. Manufacturing Dashboard in Excel
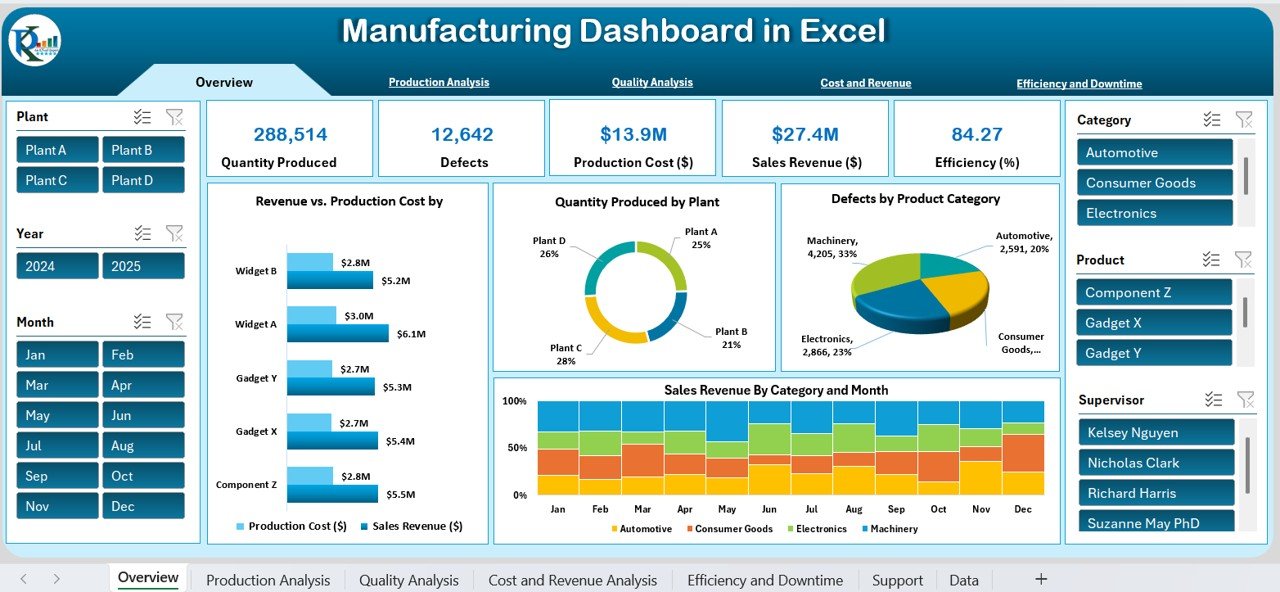
The direct upgrade from the free Production Tracker. It tracks 15+ manufacturing KPIs (OEE, throughput, first pass yield, downtime, MTBF, MTTR and scrap rate) across 7 analysis pages: production, efficiency, quality, downtime, inventory, data and support. It is native Excel with no macros and works in Excel 2016 through Microsoft 365.
What it adds over free: OEE and downtime analysis, which the free tracker deliberately leaves out.
Best for: plant and operations managers. $17.99 – view the manufacturing dashboard.
6. HR Performance Dashboard in Excel

Where the free attrition file stops at who left, this one covers the people who stay: productivity, performance reviews, attendance and engagement over time, training progress and team-level insights, with customisable metrics.
What it adds over free: formula-based HR KPIs you can edit without touching Power Pivot. Compare it with others in our HR dashboard templates in Excel ranked by use case.
Best for: HR managers in growing teams. $17.99 – view the HR performance dashboard.
7. Employee Performance Review Dashboard in Excel
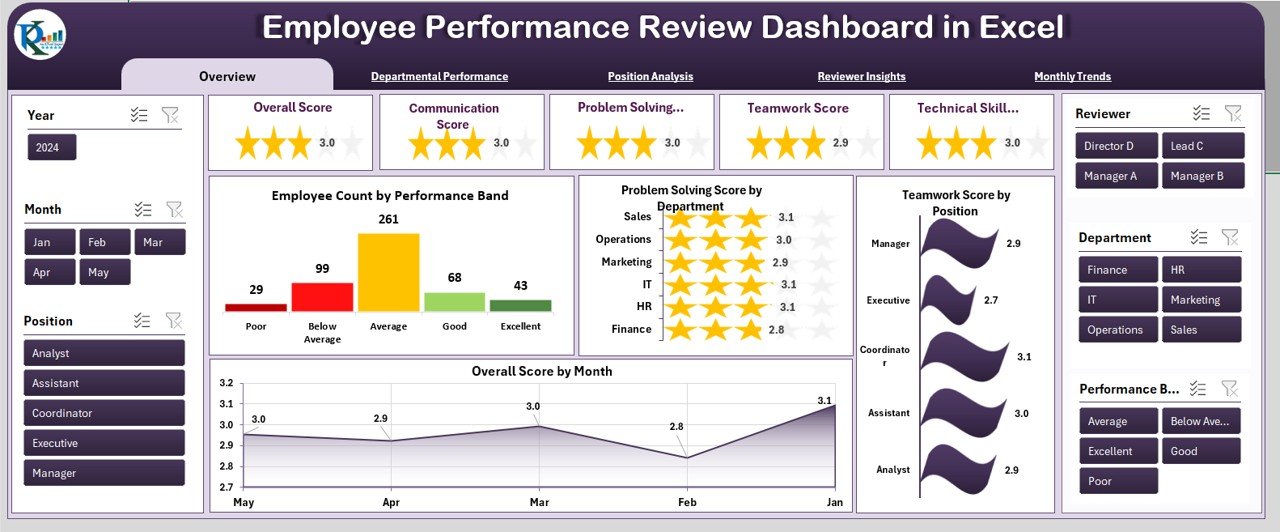
Built around review cycles: skill, teamwork and communication scores, reviewer-based analytics, monthly trends and department and role breakdowns, with a page navigator on every sheet.
What it adds over free: reviewer-level analysis, useful for spotting harsh or lenient reviewers before calibration meetings.
Best for: appraisal season. $17.99 – view the performance review dashboard.
8. Sales KPI Dashboard in Excel
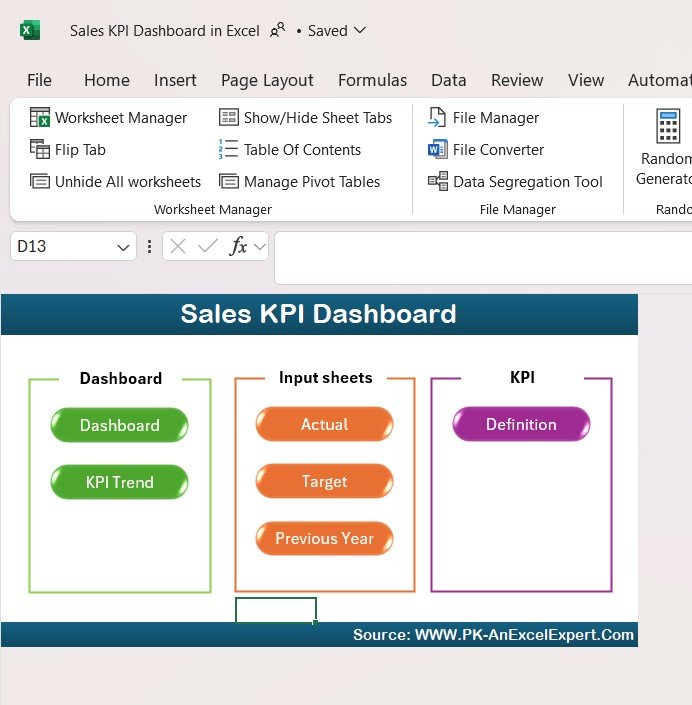
The step up from free templates #3 and #6. It monitors total sales, sales growth, conversion rate, average deal size and progress towards sales targets, with charts that update as you enter data.
What it adds over free: goal tracking, so you see the gap to plan and not just the total. For more options see the best sales dashboard templates for 2026.
Best for: sales managers with monthly targets. $12.99 – view the sales KPI dashboard.
9. Finance and Accounting Performance KPI Dashboard in Excel
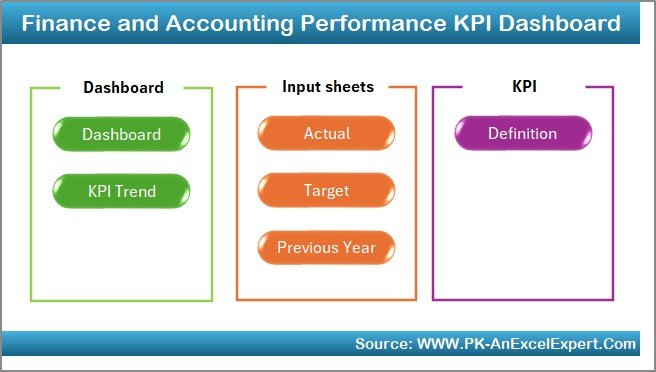
Replaces the free budget template (#7) once you need the whole finance picture: revenue and profit margin, costs and expenses, cash inflow and outflow, budget vs actual, and time-based comparisons.
What it adds over free: cash flow and margin KPIs alongside the budget view. See more in our finance dashboard templates for CFOs.
Best for: small-business owners and accountants. $12.99 – view the finance KPI dashboard.
10. Healthcare Dashboard in Excel

No free list covers clinics well, so this is the industry pick. It tracks patient data, revenue trends and costs, and doctor and department performance, with built-in charts and slicers.
What it adds over free: a healthcare data model ready to use, rather than adapting a generic sales file.
Best for: clinics and small hospitals. $17.99 – view the healthcare dashboard.
Not in your industry? Browse all Excel dashboard templates or the full range of Excel KPI dashboard templates.
How to choose between free and paid
| Your situation | Start with |
|---|---|
| Learning how dashboards are built | Free: Production Tracker (#1) or Chandoo Simple KPI Dashboard (#9) |
| One project, status meetings only | Free: Smartsheet Project Management Dashboard (#5) |
| One project with resources and risks | Paid: Project Management Dashboard in Excel, $17.99 |
| Several projects or managers | Paid: Multiple Projects Management Dashboard, $17.99 |
| Monthly reporting with MTD/YTD and targets | Paid: KPI Dashboard Library, $89.99 for 15 |
| Factory floor: output only | Free: Production Tracker (#1) |
| Factory floor: OEE and downtime | Paid: Manufacturing Dashboard in Excel, $17.99 |
Rule of thumb: if you can describe what you need in one sentence and one page, stay free. If you need the words “every month”, “by department” or “against target”, buy the template once and stop rebuilding.
When a template is NOT the right answer
- Many people editing at once. An Excel file on email or a shared drive breaks down past a handful of editors. Use Google Sheets, SharePoint co-authoring or a database-backed tool.
- Live data from several systems. If numbers must refresh from a CRM, ERP and ad platforms every hour, use Power BI or a BI tool with scheduled refresh rather than copy-paste into Excel.
- Row counts in the millions. An Excel worksheet holds 1,048,576 rows. Beyond a few hundred thousand, formulas slow down; use Power Pivot or Power BI.
- Audit-grade controls. Regulated finance or clinical reporting needs permissions, audit trails and validated systems that no spreadsheet template provides.
For everyone else, a free or one-time Excel dashboard is still the fastest, cheapest way to see your numbers. If you want to build your own instead, our Excel Pivot Tables & Dashboards course teaches the method step by step, and Microsoft’s own guide to creating a PivotTable covers the basics.
Frequently asked questions
Where can I download free Excel dashboard templates?
Reliable free sources in 2026 are NextGenTemplates’ free products, PK: An Excel Expert’s free dashboard downloads, Smartsheet’s free Excel dashboard templates page and Chandoo’s free Excel templates page. All four offer genuine .xlsx files. Microsoft’s old Create dashboards link now forwards to a Microsoft 365 sign-in page instead.
Are free Excel dashboard templates safe to download?
Files from established sites are generally safe, but check the extension. A .xlsx file cannot contain macros, so it is the safest choice. A .xlsm or .xlsb file can run VBA, so only enable macros for files from sources you trust, and keep Excel’s Protected View on for anything downloaded.
Does Microsoft Excel have built-in dashboard templates?
Excel offers templates under File, New, but the online dashboard gallery that many older articles link to now redirects to Microsoft 365 Create, which requires sign-in and focuses on Copilot prompts. For ready-made dashboards, the free sources in this list are quicker to use.
What is the best free Excel dashboard template for beginners?
The Production Tracker in Excel from NextGenTemplates. It is a plain .xlsx with no macros, ships with 52 sample shift entries, and includes a How to Build sheet with all 32 steps and formulas, so a beginner can both use it and learn how it was made.
Can I use a free Excel dashboard template for commercial work?
Usually yes for internal business use, but licences vary by source. Read the terms on each download page before reselling a template or embedding it in a product you sell. Using a dashboard to report on your own company’s data is the normal intended use.
Do free Excel dashboards work on Mac?
Most formula-and-chart dashboards work in Excel for Mac. Files built on Power Pivot and the Data Model, such as the free HR attrition dashboard, cannot be edited on Mac or in Excel on the web because Power Pivot is a Windows-only feature.
When should I pay for an Excel dashboard template?
Pay when you need several pages, month-to-date and year-to-date logic, target-vs-actual columns, more than one department, or VBA buttons for data entry. Those are the features free templates almost never include, and rebuilding them yourself takes longer than a one-time purchase.
How much do paid Excel dashboard templates cost?
On NextGenTemplates single Excel dashboards in this guide cost $12.99 to $17.99, paid once with no subscription. The KPI Dashboard Library bundles 15 Excel KPI dashboards for $89.99, compared with $194.85 if bought individually.
Can I turn a Google Sheets dashboard into an Excel dashboard?
Yes. In Google Sheets choose File, Download, Microsoft Excel (.xlsx). Formulas, formatting and most charts carry over. Sheets slicers and some Sheets-only functions may need to be rebuilt in Excel, so test the file before relying on it.
Is a free Excel dashboard better than Power BI?
For one person and one data source, an Excel dashboard is faster to set up and needs no extra software. Power BI is better for large data, scheduled refresh from several systems and sharing interactive reports across an organisation. Many teams start in Excel and move to Power BI later.
Get more Excel dashboard templates
Start free with the Production Tracker in Excel. When you need MTD, YTD and target tracking across several areas, the KPI Dashboard Library (Excel) gives you 15 dashboards for $89.99, the best value in this guide. Running projects? The Project Management Dashboard in Excel is $17.99, and our guide to project management dashboard templates compares more options. Quality teams can also see our quality control dashboard templates.
Prefer to see dashboards in action first? Watch walk-throughs and tutorials on our YouTube channel: youtube.com/@NextGenTemplates.