

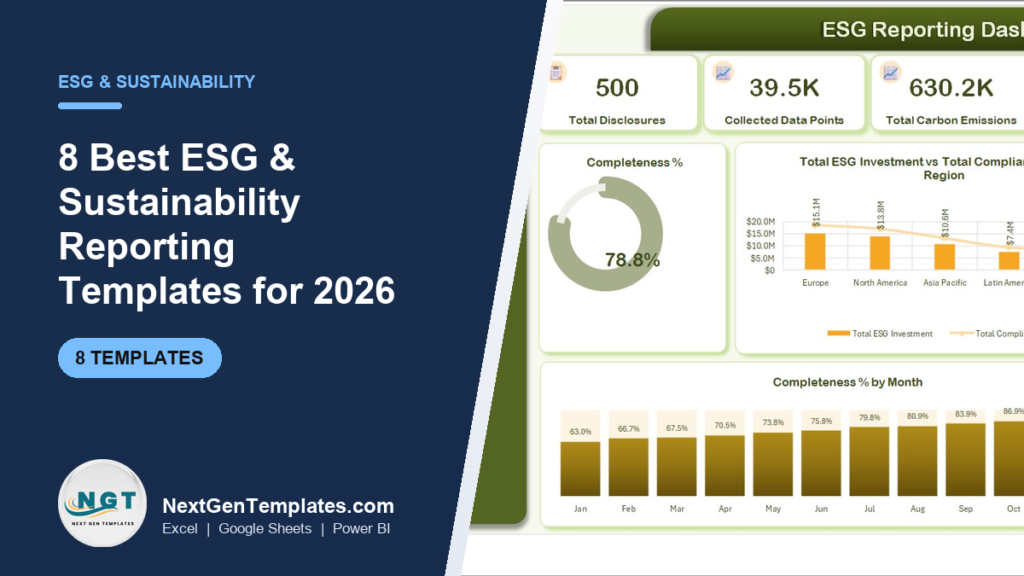
The best of the sustainability reporting templates for most ESG teams in 2026 is the ESG Reporting Dashboard ($17.99 in Excel or Power BI). It tracks disclosures, data completeness, carbon emissions, ESG investment and assurance status by business unit and region. Teams that report monthly KPIs against target should add an ESG KPI dashboard, from $9.99.
Last updated: October 2026
Key takeaways
- Our top pick is the ESG Reporting Dashboard: five pages that follow your disclosures from data collection to assurance, for $17.99.
- For one view of all three pillars, the Environmental, Social, and Governance (ESG) Dashboard covers Scope 1 and 2 emissions, diversity, safety and board independence.
- The ESG KPI Dashboard is the best value: monthly KPIs against target and last year, from $9.99 in Google Sheets.
- Specialist files cover environmental data only, carbon footprint, ESG compliance and fund-level ESG for investment firms.
- None of these files makes a report compliant or assured. They organise the internal data that feeds your report, for a one-time price of $8.99 to $17.99.
 Launch offer
SUMIFS, XLOOKUP, FILTER, LAMBDA and checking AI-written formulas, with real business projects. 11h 47m of video by PK, with practice files, quizzes and a capstone.
ESG and sustainability reporting templates compared
| Template | Format | Best For | Price |
|---|---|---|---|
| ESG Reporting Dashboard (Best overall) | Excel, Power BI | Running the disclosure cycle: completeness, quality and assurance status | $17.99 |
| Environmental, Social, and Governance (ESG) Dashboard | Excel, Google Sheets | All three pillars in one file, by region and industry | $9.99 to $17.99 |
| ESG KPI Dashboard (Best value) | Excel, Power BI, Google Sheets | Monthly ESG KPIs against target and last year | $9.99 to $12.99 |
| ESG Environmental Dashboard | Excel, Power BI, Google Sheets | Emissions, energy, water and waste by facility | $9.99 to $17.99 |
| Sustainability Reporting KPI Dashboard | Excel, Power BI, Google Sheets | Monthly, quarterly and annual sustainability KPIs | $9.99 to $12.99 |
| Carbon Footprint KPI Dashboard | Excel, Google Sheets | Carbon reduction targets and emissions per unit | $8.99 to $12.99 |
| ESG Compliance KPI Dashboard | Excel, Power BI | Compliance gaps against target and prior year | $11.99 to $12.99 |
| ESG Investment Firms Dashboard | Excel, Power BI | Fund managers: AUM, ESG score and compliance rate | $17.99 |
Why do ESG teams use spreadsheet templates instead of ESG software?
ESG reporting is a data collection problem before it is a reporting problem. Energy bills sit with facilities, headcount and safety figures sit with HR, board data sits with the company secretary and supplier scores sit with procurement. Someone has to pull it together every month or quarter, check it, chase the gaps and show leadership where things stand.
Dedicated ESG platforms such as Workiva, Persefoni or Sweep handle that at scale, but they are sold as annual contracts, usually priced on request and built for large companies with a disclosure team. A small or mid-sized business that owes its first sustainability report to a bank, a big customer or its board rarely needs that on day one. It needs a clean structure, consistent definitions and a dashboard it can show in a meeting.
That is the job these sustainability reporting templates do. Each one gives you a data sheet laid out the right way, a set of KPIs with formulas already built, and charts that update when you add a month. You stay in Excel, Google Sheets or Power BI, which your team already knows. If you are new to the metrics themselves, read our guide to 15 ESG KPIs to track in 2026 first; this post is about choosing the file.
How we picked these ESG templates
We started from every ESG, sustainability, carbon and environmental template in the NextGenTemplates catalogue, more than 60 files across Excel, Google Sheets and Power BI. Then we kept the ones that a sustainability or ESG reporting team would actually run, and dropped department-level variants that track one narrow topic.
- Reporting fit: does it cover what goes into a sustainability report, such as emissions, energy, water, workforce and governance data?
- Honest scope: does the product page say clearly what the file does and does not do? We favoured files that state they are not compliance tools.
- Formats: where a template exists in more than one format, we list all of them so you can pick the tool your team uses.
- Price: every pick is a one-time purchase. The Google Sheets editions are usually the cheapest way in.
The 8 best sustainability reporting templates for 2026
1. ESG Reporting Dashboard (Best overall)
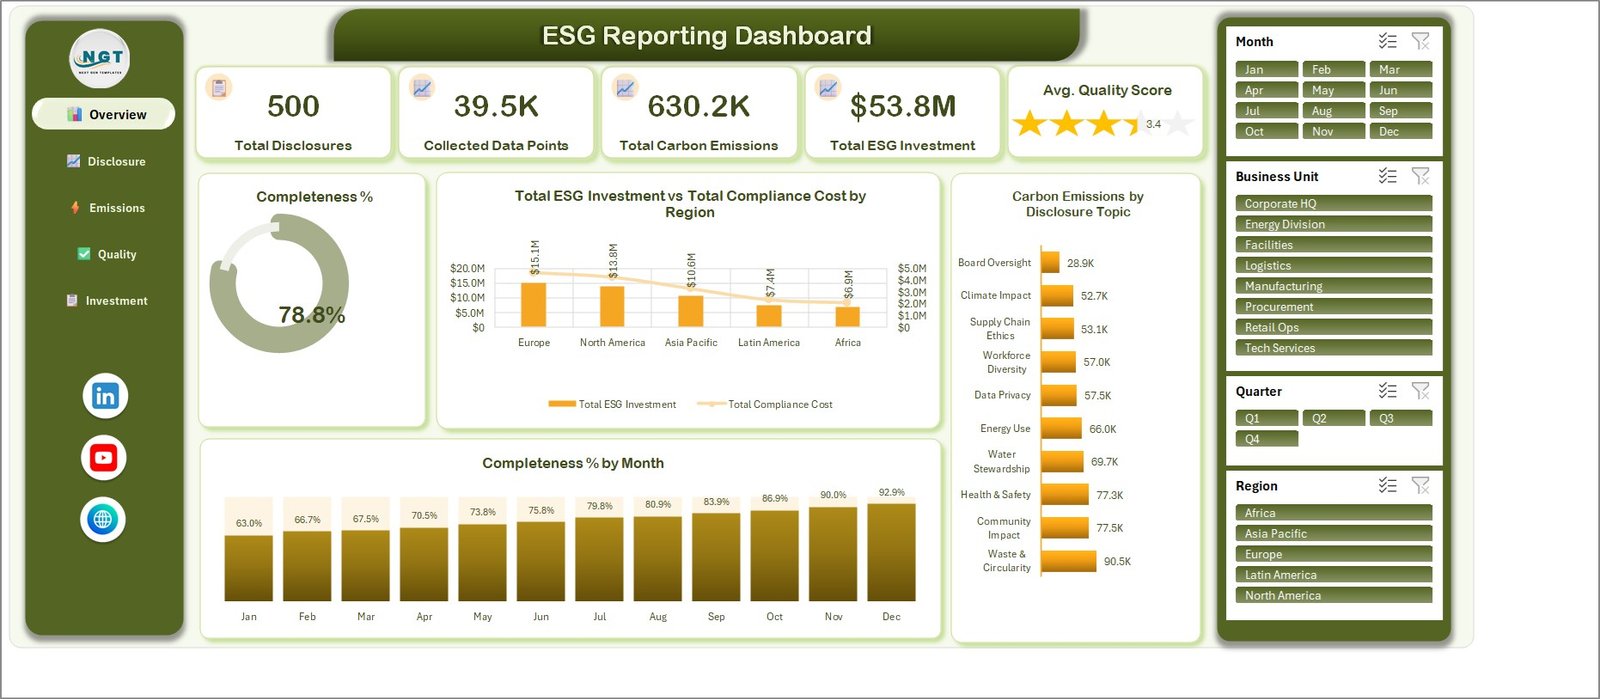
The ESG Reporting Dashboard in Excel is built around the reporting cycle rather than one metric. The Excel file has five pages (Overview, Disclosure Progress, Emissions Analysis, Quality Assurance and Investment Analysis), five KPI cards and 16 linked charts. The cards show total disclosures, collected data points, total carbon emissions, total ESG investment and an average data quality score out of 5. Four slicers for month, business unit, quarter and region filter every page at once.
All data goes into one flat sheet with 20 input columns, so there is a single place to check and correct. Framework names such as GRI or CSRD appear only as a label column for tagging your own rows, and the product page says plainly that the file is not a disclosure platform. We like that honesty. It is the right attitude for an internal tracking tool.
The ESG Reporting Dashboard in Power BI costs the same $17.99 and goes further: five analysis pages, a drillthrough page that lists the records behind any bar, two hover tooltip pages and 28 named measures, including Data Completeness %, Publication Rate %, Overdue Rate %, Audited Rate % and Emissions Reduction %.
Best for: the person who owns the annual ESG or sustainability report and needs to see which disclosures are late, incomplete or not yet assured. Price: $17.99 in Excel or Power BI.
2. Environmental, Social, and Governance (ESG) Dashboard
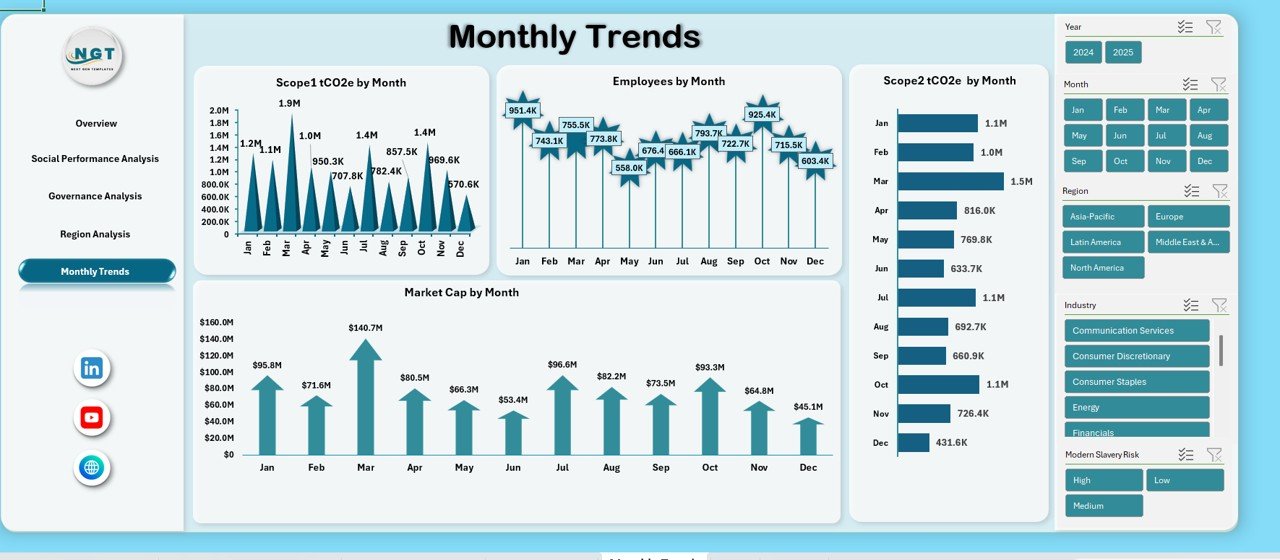
The Environmental, Social, and Governance (ESG) Dashboard in Excel puts all three pillars in one workbook. The environmental section tracks Scope 1 and Scope 2 emissions, total CO2e, energy use in MWh and water withdrawal. The social section covers workforce diversity, safety incidents, community investment and modern slavery risk exposure. The governance section shows board independence, the share of women on the board, supplier ESG scores and data privacy incidents.
You can compare results by region, industry and risk category, and a month-by-month trend shows whether things are improving. Pivot tables and charts refresh when you update the data, with no manual recalculation. It is the file to buy if a board or investor asks for a one-page ESG picture.
A Google Sheets edition costs $9.99. If you prefer a sheet-by-pillar layout, the Sustainability and ESG Dashboard in Google Sheets ($9.99) has separate Environmental, Social and Governance tabs, 16 chart views and a record lookup sheet.
Best for: leadership and board reporting across E, S and G. Price: $17.99 in Excel, $9.99 in Google Sheets.
3. ESG KPI Dashboard (Best value)

The ESG KPI Dashboard in Excel ($12.99) is the classic KPI format: pick a month and see each ESG metric as month-to-date and year-to-date actuals against target and against the same period last year. Environmental KPIs cover carbon footprint, waste, energy and water. Social KPIs cover employee well-being, diversity and inclusion, community engagement and human rights. Governance KPIs cover regulatory compliance, board diversity and anti-corruption.
You can rename, add or drop KPIs to match your own ESG strategy, which matters because no two companies report the same set. The same idea is available as the ESG KPI Dashboard in Google Sheets for $9.99, and in Power BI as the ESG KPI Dashboard in Power BI or the ESG (Environmental, Social, and Governance) KPI Dashboard in Power BI, both $11.99.
Best for: teams that set annual ESG targets and review progress every month. Price: $9.99 to $12.99.
Want the set instead of one file? The Energy and ESG Sustainability Bundle gives you 8 templates for $59.99 instead of $119.92, including the ESG KPI Dashboard, the ESG Environmental Dashboard and the Sustainability Reporting KPI Dashboard in Excel.
4. ESG Environmental Dashboard
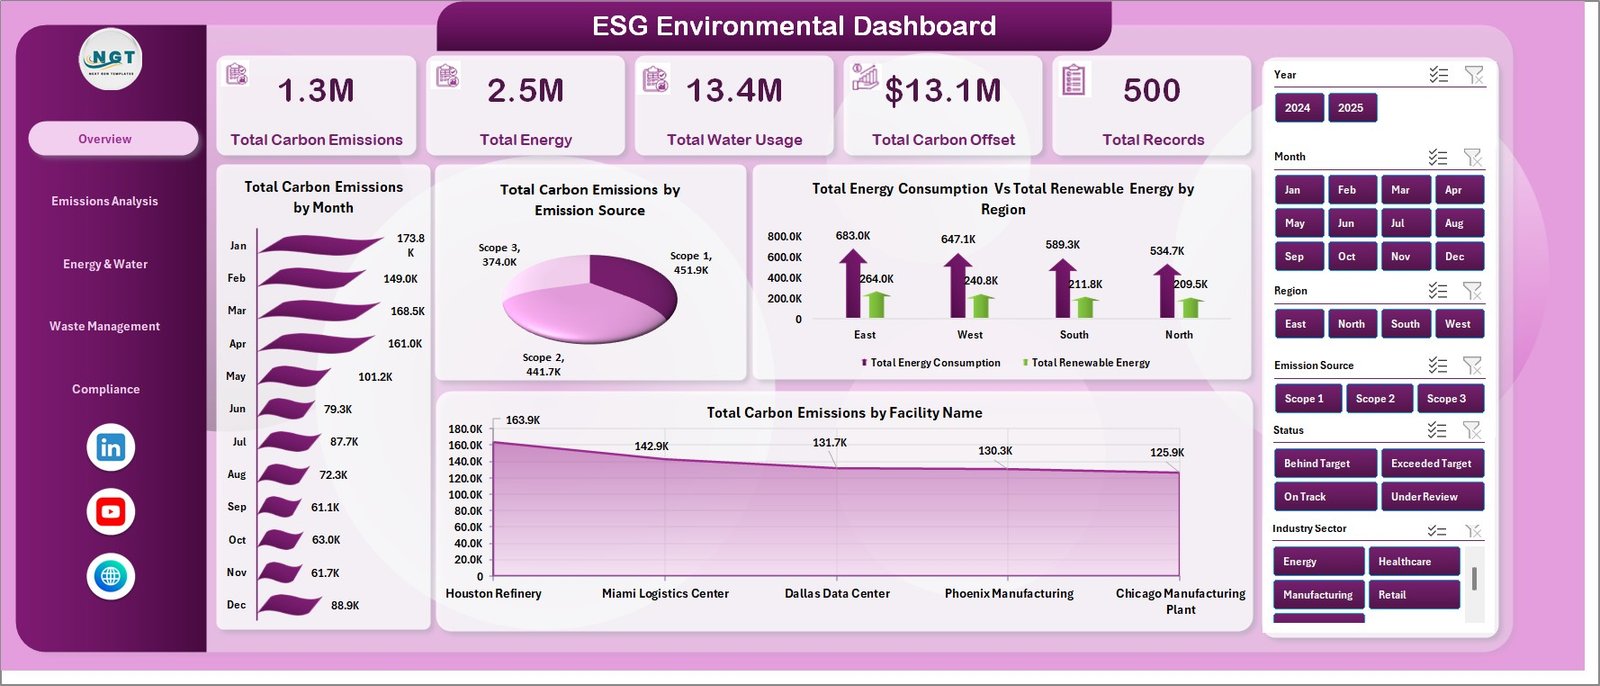
If the E in ESG is where most of your work sits, the ESG Environmental Dashboard in Excel goes deeper than the all-pillar files. It has five pages: an overview, emissions analysis, energy and water tracking, waste management and compliance monitoring. The overview cards show total carbon emissions, total energy, total water usage, total carbon offset and total records.
Slicers for emission source, facility name, industry sector, region and year let you narrow everything to one plant or one source in a click. It runs on pivot tables with no macros or VBA, which keeps IT teams happy. Multi-site manufacturers, property owners and logistics firms get the most from it, because they have many facilities to compare.
It costs $17.99 in Excel, $17.99 in Power BI and $9.99 in Google Sheets.
Best for: environmental and EHS managers with several facilities. Price: $9.99 to $17.99.
5. Sustainability Reporting KPI Dashboard
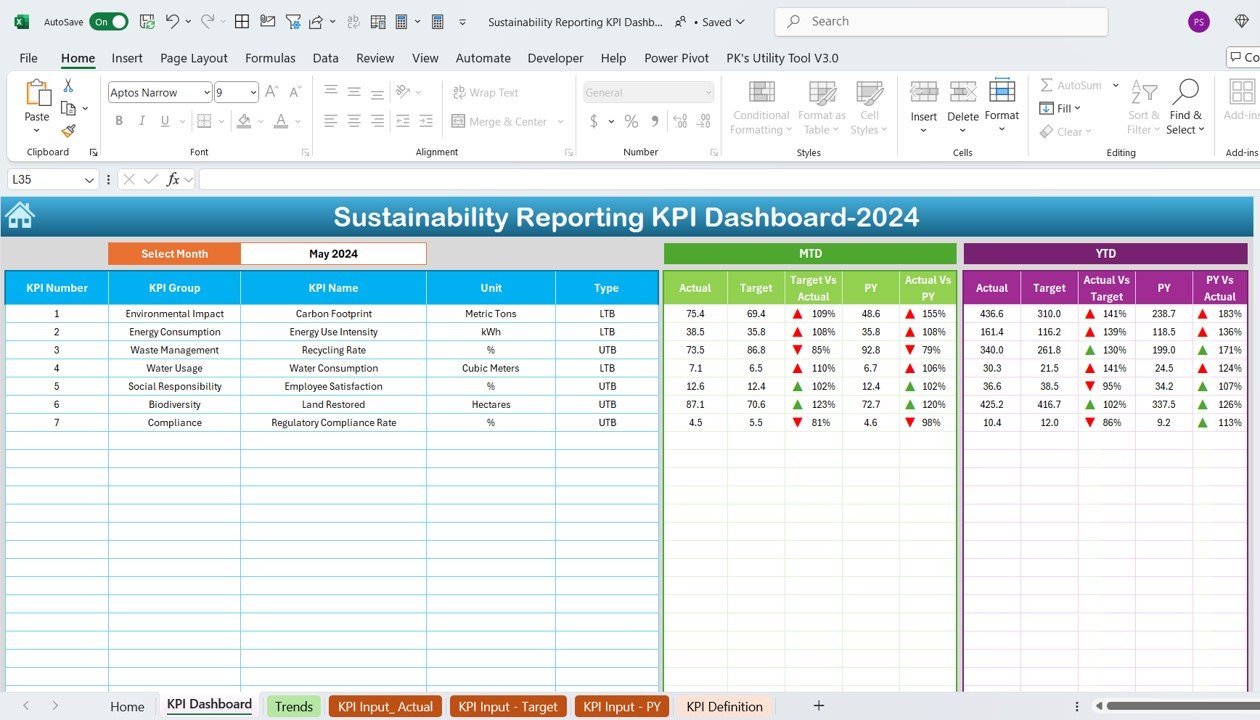
The Sustainability Reporting KPI Dashboard in Excel ($12.99) is aimed at the stakeholder report. It tracks carbon emissions, energy use, water consumption, waste reduction and community engagement, plus social measures such as employee engagement, diversity and inclusion, community outreach and labor rights compliance. You can review performance by month, quarter and year, which lines up well with a quarterly update and an annual report.
It is also sold as the Sustainability Reporting KPI Dashboard in Power BI ($11.99) and in Google Sheets ($9.99). A close sibling, the Sustainability Metrics KPI Dashboard, costs $9.99 in Google Sheets and $11.99 in Power BI.
Best for: CSR and sustainability teams that publish a yearly report with quarterly updates. Price: $9.99 to $12.99.
6. Carbon Footprint KPI Dashboard
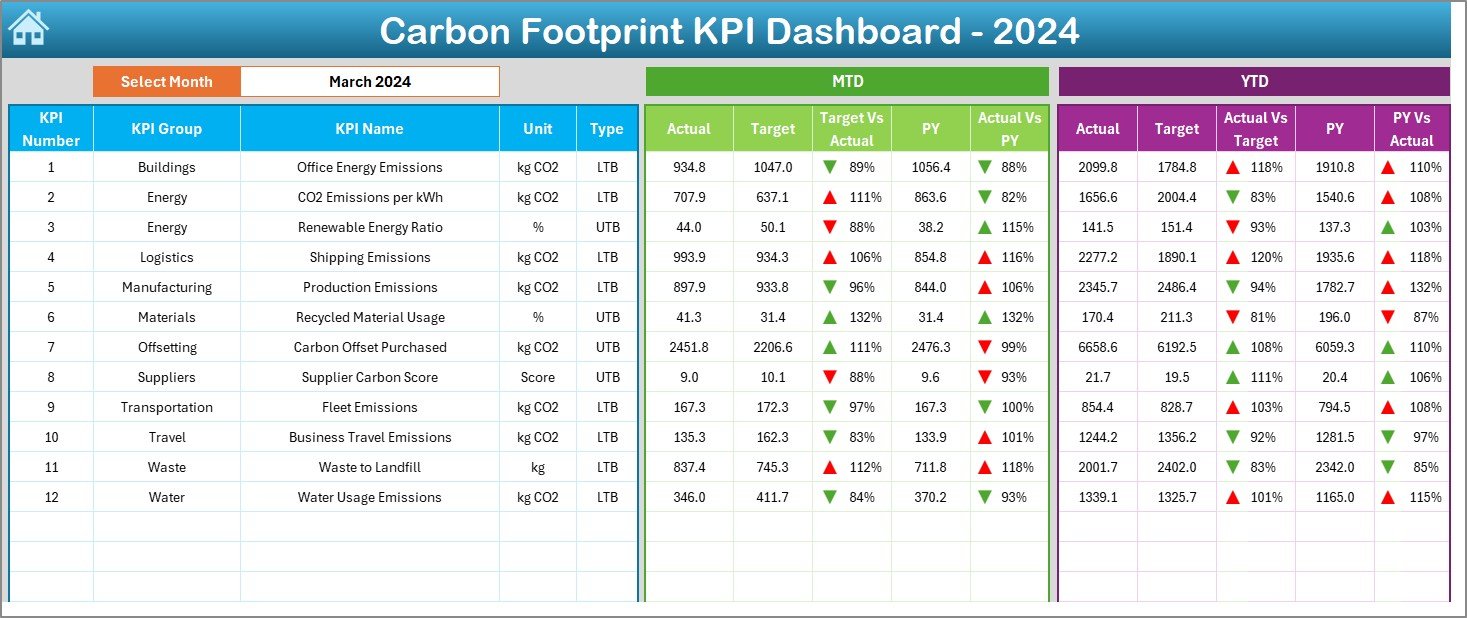
Many companies start their sustainability work with one number: carbon. The Carbon Footprint KPI Dashboard in Excel ($12.99) tracks KPIs such as carbon emissions per unit of production, energy consumption, transportation emissions and waste. Each KPI is shown month-to-date and year-to-date, against target and against last year, so you can see whether a reduction plan is on track.
It suits a business that has committed to a reduction target and needs to show progress to a customer or lender. The Google Sheets edition costs $8.99, the cheapest file in this list. Remember that the file reports the emissions you enter. It does not calculate them from fuel or electricity use.
Best for: companies with a carbon reduction target. Price: $8.99 to $12.99.
7. ESG Compliance KPI Dashboard
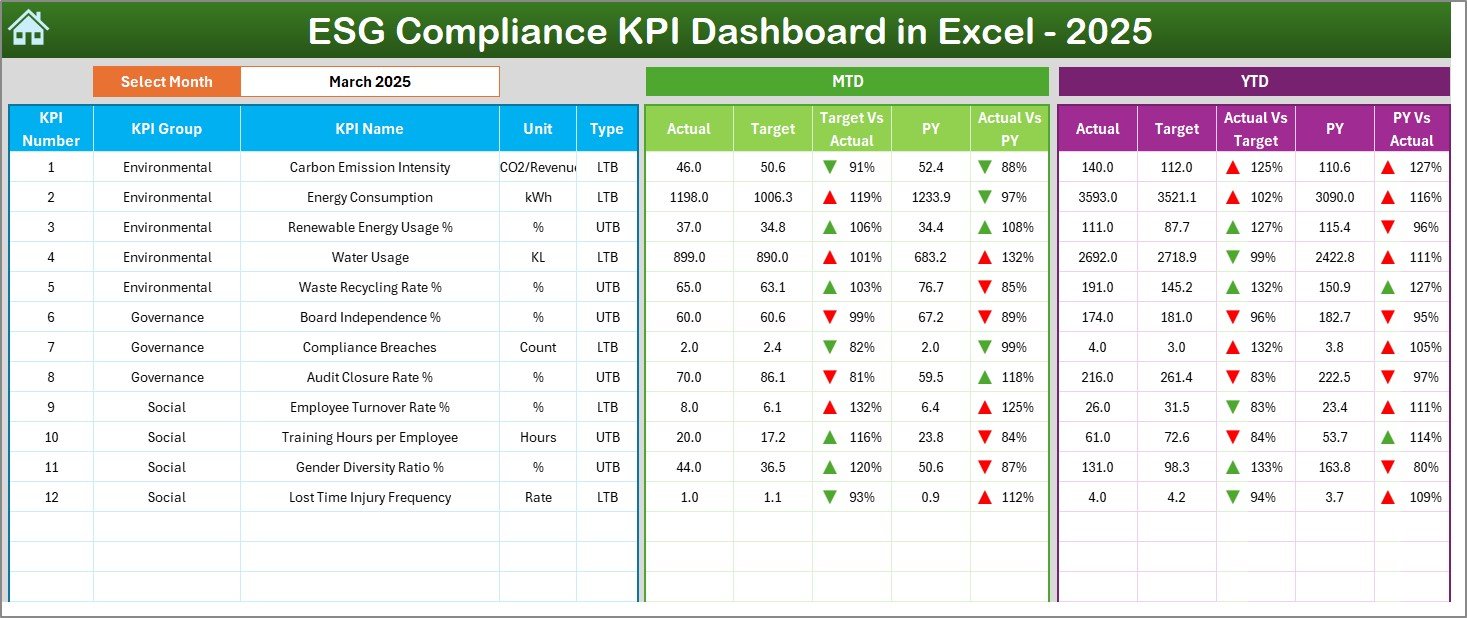
The ESG Compliance KPI Dashboard in Excel ($12.99) is for teams whose main question is “where are we falling short?”. Change the month and the whole dashboard updates. Each KPI is compared with target and the previous year, and arrows plus conditional formatting flag the gaps. Trend charts show MTD and YTD history, and a KPI definition sheet keeps formulas and units consistent, which helps when an auditor or reviewer asks how a number was worked out.
The Power BI edition costs $11.99. Despite the name, it tracks compliance with your own targets and policies. It does not check you against a regulation.
Best for: compliance officers and internal audit teams reviewing ESG commitments. Price: $11.99 to $12.99.
8. ESG Investment Firms Dashboard
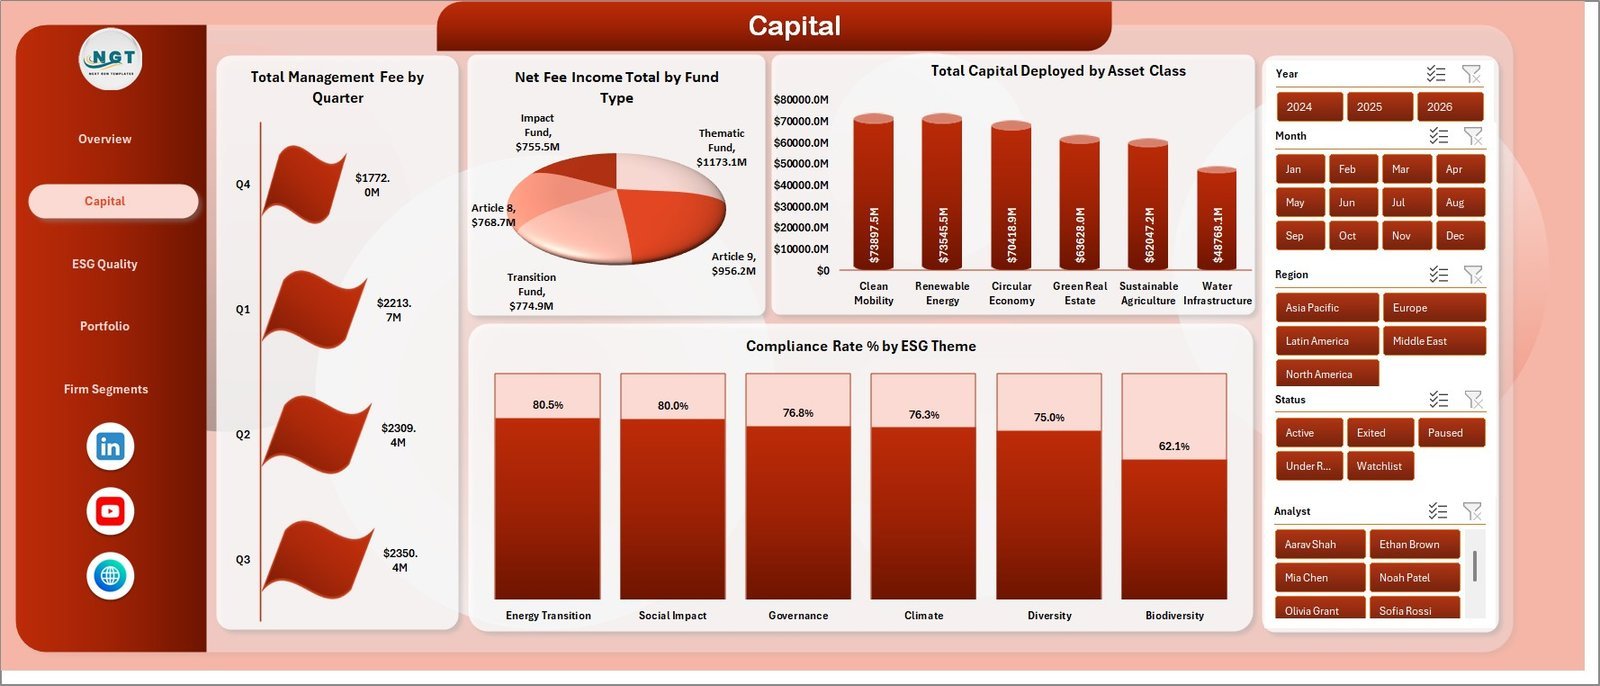
Asset managers report ESG differently: across a portfolio, not a company. The ESG Investment Firms Dashboard in Excel ($17.99) has five pages (Overview, Capital, ESG Quality, Portfolio and Firm Segments) and KPI cards for total AUM, capital deployed, management fees, net fee income and average ESG score. You can break results down by region, ESG theme, investment strategy, asset class, fund type and analyst, and see compliance rate and engagement counts.
It is also available as the ESG Investment Firms Dashboard in Power BI for $17.99. Finance leaders on the corporate side may prefer our CFO dashboard template stack.
Best for: ESG fund managers, investment analysts and portfolio operations teams. Price: $17.99 in Excel or Power BI.
Which ESG metrics should a sustainability report track?
Start with what your readers ask for. A lender may only want emissions and energy; a large customer may send a supplier questionnaire covering safety and labor practices; a board may want diversity and governance figures. Frameworks such as the GRI Standards list hundreds of possible disclosures, but most first reports cover a short core set. For emissions, the GHG Protocol Corporate Standard defines Scope 1 (direct), Scope 2 (purchased energy) and Scope 3 (value chain) emissions.
| Metric | Formula | Direction |
|---|---|---|
| Carbon intensity | Total tCO2e / Revenue in $ millions | Lower is better |
| Emissions reduction % | (Base year tCO2e minus Current tCO2e) / Base year tCO2e x 100 | Higher is better |
| Renewable energy share | Renewable MWh / Total MWh x 100 | Higher is better |
| Water intensity | Water withdrawn in cubic meters / Units produced | Lower is better |
| Waste diversion rate | Tons recycled, composted or reused / Total tons x 100 | Higher is better |
| TRIR | Recordable incidents x 200,000 / Total hours worked | Lower is better |
| Women on board % | Women directors / Total directors x 100 | Track against target |
| Board independence % | Independent directors / Total directors x 100 | Higher is better |
| Data completeness % | Data points collected / Data points required x 100 | Higher is better |
A worked example: a manufacturer emitted 5,600 tCO2e in its base year and 4,800 tCO2e this year on $60 million of revenue. Emissions are down about 14.3%, and carbon intensity is 80 tCO2e per $1 million of revenue. If revenue grew 20% over the same period, intensity fell even faster than total emissions, and that is the story the dashboard should make easy to tell. Track data completeness alongside it: a 14% drop means little if a third of the sites did not report.
For deeper metric guides, see our ESG KPIs guide, our energy management KPIs guide and our safety KPIs guide covering TRIR and LTIFR.
How do you choose the right ESG reporting template?
| If you are… | Start with |
|---|---|
| Preparing the annual ESG or sustainability report | ESG Reporting Dashboard |
| Giving the board one view of E, S and G | Environmental, Social, and Governance (ESG) Dashboard |
| Reviewing ESG targets every month | ESG KPI Dashboard |
| An environmental or EHS manager with several sites | ESG Environmental Dashboard |
| Writing a stakeholder report with quarterly updates | Sustainability Reporting KPI Dashboard |
| Working to a carbon reduction target | Carbon Footprint KPI Dashboard |
| Checking ESG commitments for gaps | ESG Compliance KPI Dashboard |
| Running ESG reporting for a fund or portfolio | ESG Investment Firms Dashboard |
| An office or workplace team cutting its own footprint | Office Sustainability Dashboard |
| A small CSR team that only needs a simple tracker | CSR and Sustainability Performance Tracker |
A common setup is one reporting file and one KPI file: the ESG Reporting Dashboard to run the disclosure cycle, and the ESG KPI Dashboard for the monthly review. Office and facility teams can start smaller with the Office Sustainability Dashboard in Google Sheets at $6.99, which covers energy, water, waste, travel and commuting emissions and seat use. They should also see our facility management templates. Waste-heavy operations will find more in our waste management dashboard templates, and public bodies in our government dashboard templates.
When a template is NOT the right answer
- You need an assured or regulatory filing. If you fall under CSRD, ISSB-based rules or a stock exchange requirement, you need assurance and often dedicated software. A spreadsheet can organise the data that feeds it, not replace it.
- You need carbon accounting. Turning fuel, electricity and travel data into Scope 1, 2 and 3 emissions takes emission factors and a method. These files report the results; they do not calculate them.
- You collect data from dozens of people. When many sites and suppliers submit data, a platform with workflows, approvals and audit trails saves time. A shared spreadsheet starts to creak.
- You need a written report document. If you are searching for a Word layout for the narrative report itself, these dashboards are the evidence behind it, not the document.
For most small and mid-sized companies preparing a first or second sustainability report, a template is the quickest way to get organised without another subscription. Want to try a free file first? See our free Excel dashboard templates and free Power BI dashboard templates. Every paid file here is fully editable; our guide to editable vs locked templates explains why that matters. Operations leaders can also browse our COO operations dashboard stack.
Frequently asked questions
What are sustainability reporting templates?
They are ready-made Excel, Google Sheets or Power BI files that turn your environmental, social and governance records into a single report. You type or paste your own figures into a data sheet, and the KPI cards, charts and monthly comparisons update. They organise the internal tracking behind a sustainability report. They do not write or file the report for you.
Which ESG template should I buy first?
If you manage the disclosure process itself, start with the ESG Reporting Dashboard at $17.99 in Excel or Power BI. It tracks disclosures, data completeness, quality scores and assurance status by business unit and region. If you want monthly ESG KPIs against target, start with the ESG KPI Dashboard from $9.99 in Google Sheets.
Is there an ESG dashboard template in Excel?
Yes, several. The Environmental, Social, and Governance (ESG) Dashboard, the ESG Reporting Dashboard and the ESG Environmental Dashboard each cost $17.99 in Excel. The ESG KPI Dashboard, the ESG Compliance KPI Dashboard, the Sustainability Reporting KPI Dashboard and the Carbon Footprint KPI Dashboard each cost $12.99 in Excel.
Do these templates make my report GRI, CSRD or ISSB compliant?
No. They are internal reporting workbooks. They do not implement GRI, SASB, CSRD, ESRS, TCFD or ISSB rules, and nothing they produce is an assured disclosure. Framework names appear only as labels you can tag your own rows with. Use the files to organise and review your data, then work with your adviser or assurance provider on the filing.
Do the templates calculate Scope 1, 2 and 3 emissions?
No. They report emissions figures you enter. Calculating Scope 1, 2 and 3 emissions needs activity data and emission factors, as set out in the GHG Protocol. Work those out in your carbon accounting process or with a consultant, then load the monthly totals into the dashboard to see trends by site, region or source.
How do you calculate carbon intensity?
Divide total emissions in tonnes of CO2e by a business measure such as revenue in millions of dollars, units produced or floor area. A company that emits 4,800 tCO2e on $60 million of revenue has an intensity of 80 tCO2e per $1 million. Intensity lets you compare years even when the business grows.
Is there a sustainability dashboard in Google Sheets?
Yes. The ESG KPI Dashboard, the ESG Environmental Dashboard, the Environmental, Social, and Governance (ESG) Dashboard, the Sustainability Reporting KPI Dashboard and the Sustainability and ESG Dashboard each cost $9.99 in Google Sheets. The Carbon Footprint KPI Dashboard costs $8.99 and the Office Sustainability Dashboard $6.99.
Is there a bundle of ESG and sustainability templates?
Yes. The Energy and ESG Sustainability Bundle costs $59.99 for 8 templates worth $119.92 bought one by one. It includes the ESG KPI Dashboard, the ESG Environmental Dashboard and the Sustainability Reporting KPI Dashboard in Excel, plus energy, utility and solar dashboards and one Power BI energy report.
Who are ESG templates for?
Sustainability managers, ESG analysts, CSR teams, finance teams that own the annual report, and consultants who prepare ESG reviews for clients. They suit small and mid-sized companies that need a clear monthly view of ESG data without buying an enterprise platform. Investment teams have a separate file for fund-level ESG reporting.
Are these sustainability reporting templates a one-time purchase?
Yes. Prices run from $6.99 to $17.99 per file, or $59.99 for the bundle, with no subscription and no per-user fee. You download the file, change the metrics, sites and business units to match your own, and keep it.
Get your ESG and sustainability reporting template
Start with the ESG Reporting Dashboard ($17.99 in Excel or Power BI) to run your disclosure cycle in one file. Add the ESG KPI Dashboard from $9.99 for the monthly target review, or take the Energy and ESG Sustainability Bundle for $59.99 and get 8 templates at half the single-file price. Each one is a one-time purchase you can edit and keep. Step-by-step walkthroughs are on our YouTube channel.