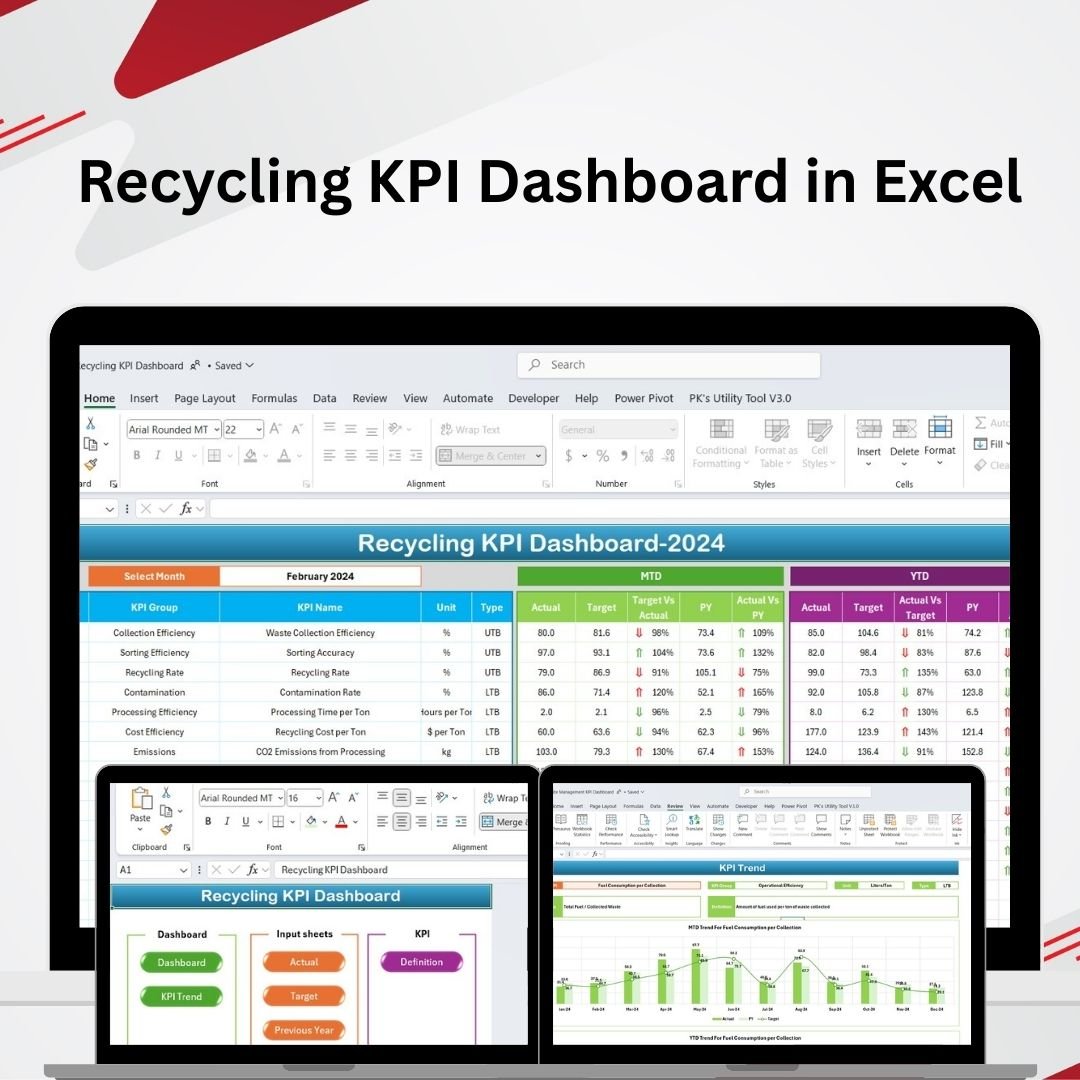

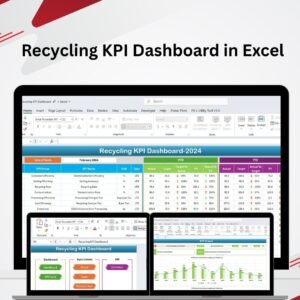
The Recycling KPI Dashboard in Excel is a robust tool designed for organizations in the recycling industry to track, analyze, and optimize key performance indicators (KPIs). Whether you’re managing waste diversion, tracking recycling rates, or analyzing operational efficiency, this dashboard offers a comprehensive view of your recycling efforts, helping you ensure sustainability and improve recycling outcomes.
With real-time tracking, dynamic charts, and customizable features, this Excel dashboard is ideal for waste management companies, recycling facilities, municipalities, and sustainability managers. It helps you monitor progress, identify inefficiencies, and make data-driven decisions to optimize your recycling processes and enhance environmental impact.
Key Features of the Recycling KPI Dashboard in Excel:
📊 Comprehensive KPI Tracking
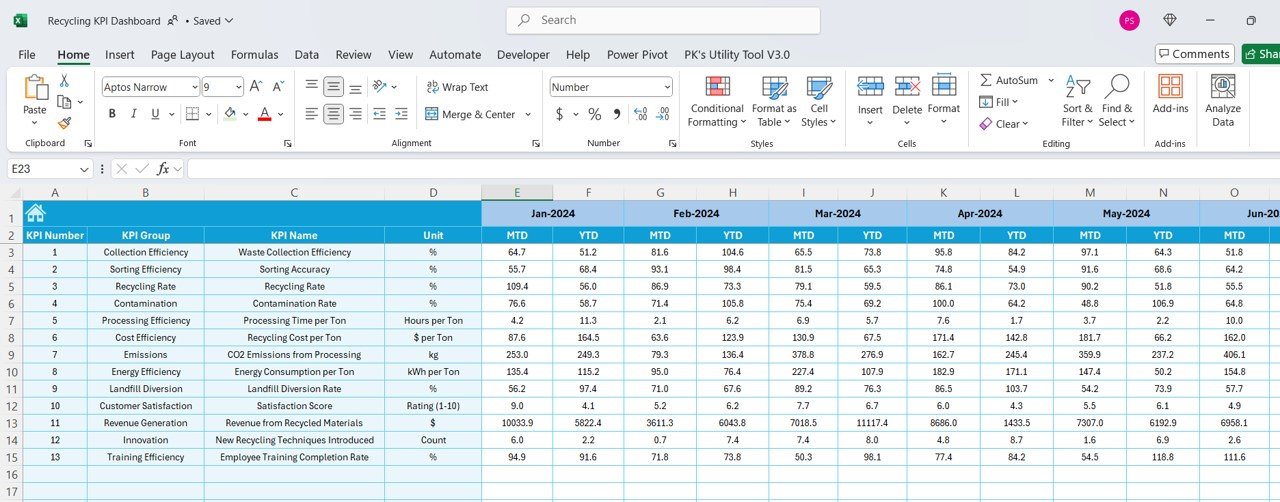
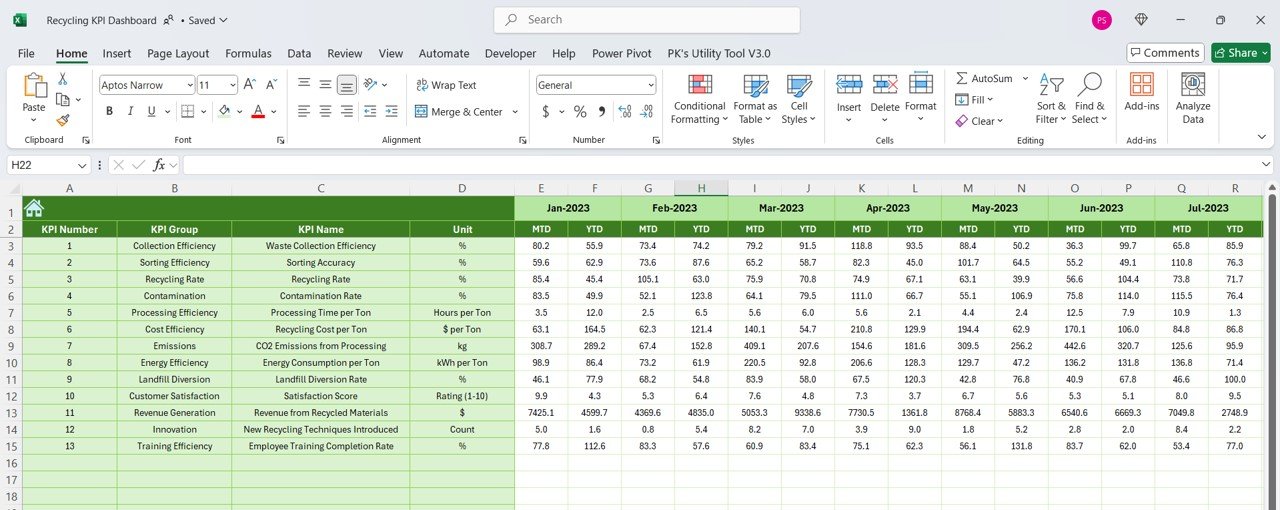
Track essential recycling KPIs such as recycling rates, material recovery, waste diversion, cost per ton, and operational efficiency—all in one dashboard.
📈 Real-Time Performance Monitoring
Monitor your recycling performance in real-time, ensuring that you can identify inefficiencies and areas for improvement as they arise.
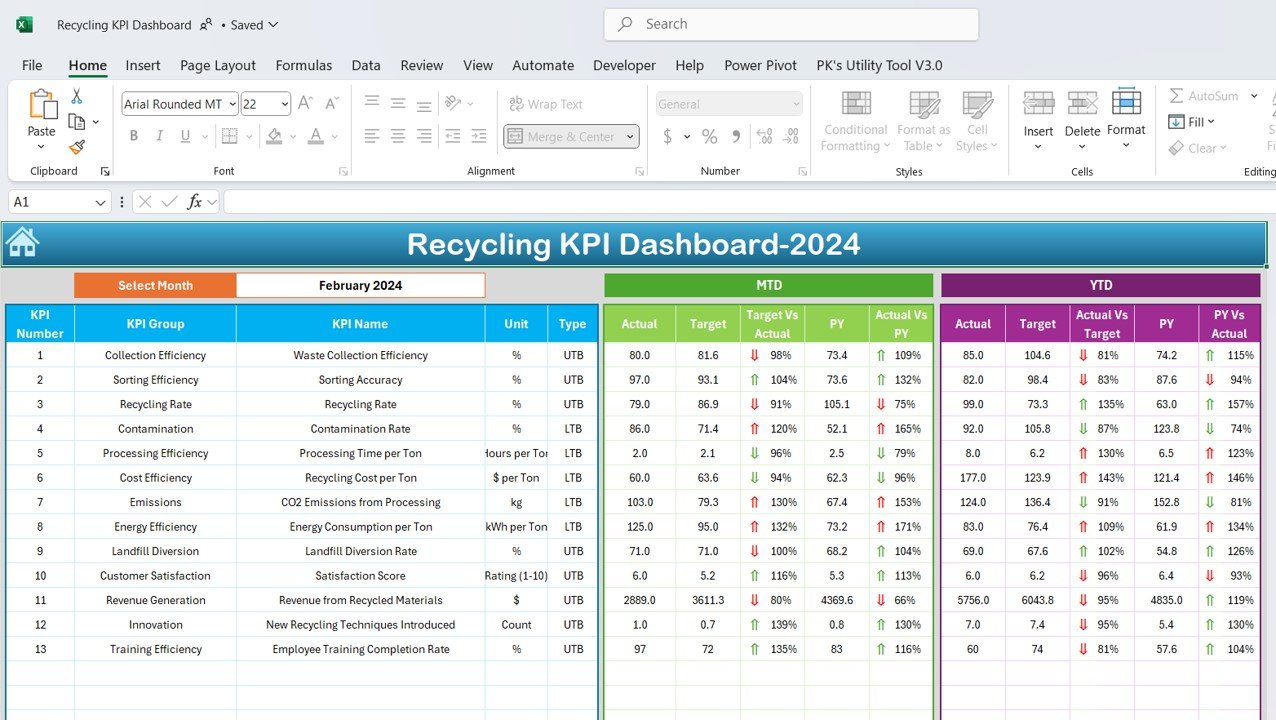
📅 Month-to-Date (MTD) and Year-to-Date (YTD) Tracking
Track recycling performance over different periods, comparing current data to historical performance to measure growth, identify trends, and optimize processes.
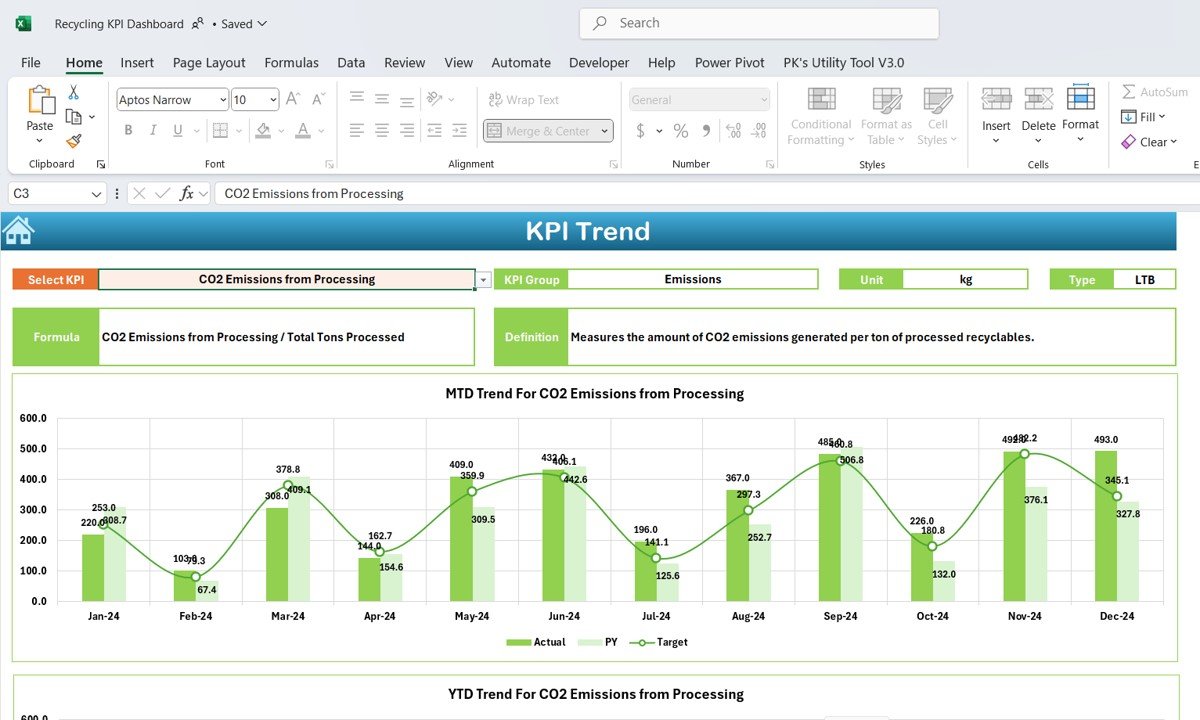
🎯 Goal Setting and Performance Comparison
Set specific recycling goals for each KPI and compare actual performance against these targets, ensuring that your recycling operations align with environmental and business objectives.
🛠 Customizable Inputs
Easily input data such as collected material volumes, recycling rates, costs, and recovery metrics, while customizing the dashboard to suit your specific recycling operation needs.
🔔 Conditional Formatting Alerts
Get real-time alerts using color-coded indicators to highlight areas that require attention, such as low recycling rates, high costs, or missed diversion goals.
🌍 Sustainability and Environmental Insights
Gain insights into your sustainability efforts, including material recovery rates and waste diversion, helping you meet environmental standards and improve your recycling outcomes.
🚀 Why You’ll Love the Recycling KPI Dashboard in Excel:
✅ Increase Recycling Rates – Track the percentage of waste diverted from landfills to recycling and other sustainable processes.
✅ Optimize Operational Efficiency – Measure the cost per ton, material recovery rates, and operational processes to streamline recycling efforts and reduce waste.
✅ Improve Waste Diversion – Monitor your waste diversion performance and ensure that your recycling efforts align with environmental and business goals.
✅ Enhance Sustainability – Measure progress toward sustainability goals by tracking the effectiveness of your recycling programs and efforts.
✅ User-Friendly Interface – The dashboard is simple to use, even for non-technical staff, making it easy to input data and track performance.
✅ Fully Customizable – Tailor the dashboard to fit your specific recycling operation needs, whether you are tracking material types, recycling centers, or overall performance.
What’s Inside the Recycling KPI Dashboard in Excel:
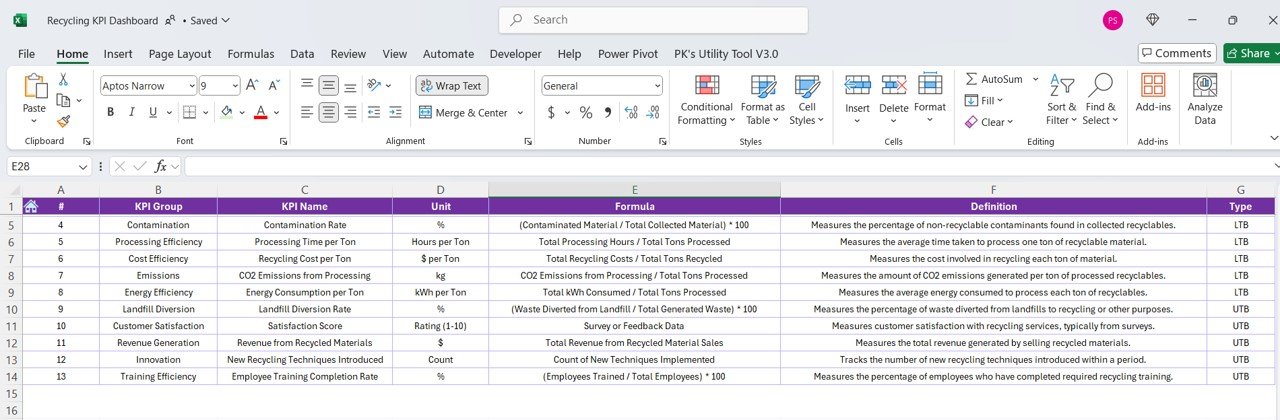
- Recycling Rate KPI: Track the percentage of recyclable materials diverted from landfills to recycling processes.
- Material Recovery KPI: Measure how much recyclable material is recovered from waste, ensuring efficient recycling practices.
- Waste Diversion KPI: Track the total amount of waste diverted from landfills through recycling, composting, or other methods.
- Cost Per Ton KPI: Measure the operational cost per ton of recycling material, helping to optimize cost efficiency and reduce expenses.
- Operational Efficiency KPI: Monitor the efficiency of your recycling processes, including equipment usage, labor costs, and throughput rates.
- Customer Engagement KPI: Measure the effectiveness of public or community recycling programs through participation rates and awareness levels.
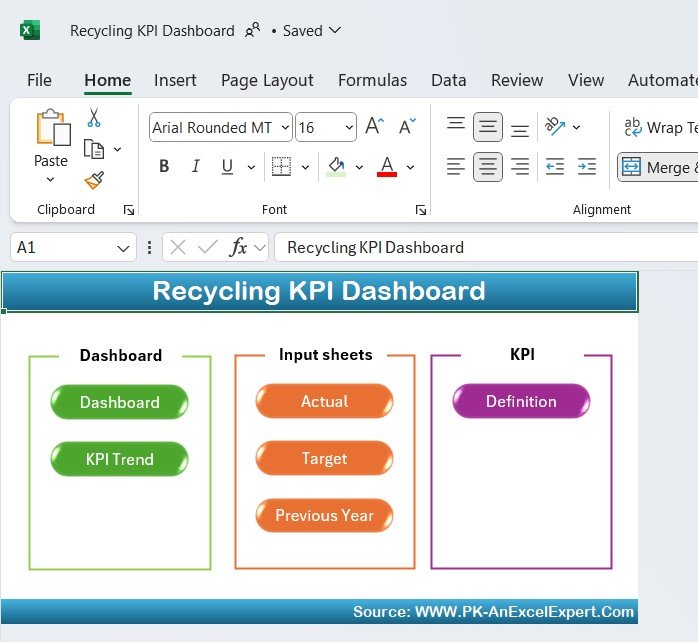
How to Use the Recycling KPI Dashboard in Excel:
1️⃣ Download the Template – Instantly access your Excel file upon purchase.
2️⃣ Input Your Data – Enter material recovery, recycling rates, operational costs, and other performance data into the provided fields.
3️⃣ Set Sustainability Targets – Define specific KPIs for waste diversion, recycling rates, and recovery metrics to guide your recycling initiatives.
4️⃣ Track Performance – Monitor your recycling performance in real-time and identify areas for improvement to meet sustainability goals.
5️⃣ Generate Reports – Use the dashboard to generate detailed performance reports for internal reviews, management meetings, or regulatory compliance.
Who Can Benefit from the Recycling KPI Dashboard in Excel:
- Recycling Facilities
- Waste Management Companies
- Environmental Consultants
- Municipalities
- Sustainability Managers
- Operations Managers
- Business Owners
- Regulatory Affairs Teams
The Recycling KPI Dashboard in Excel is the ideal solution for businesses and organizations in the recycling industry looking to streamline their operations, track key performance metrics, and improve sustainability efforts.
Click here to read the Detailed blog post
https://www.pk-anexcelexpert.com/recycling-kpi-dashboard-in-excel/
Visit our YouTube channel to learn step-by-step video tutorials
Youtube.com/@PKAnExcelExpert


Reviews
There are no reviews yet.