

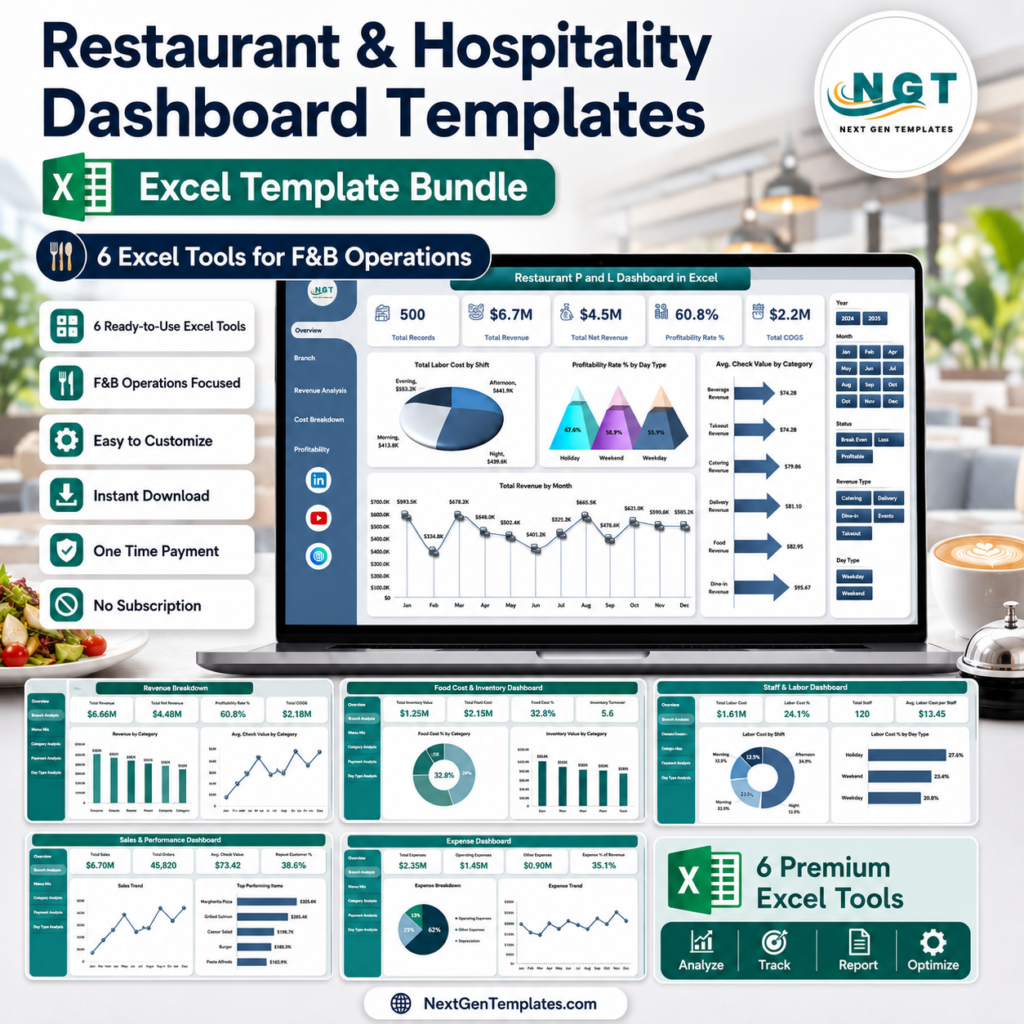
Restaurant and hospitality operators live in a daily tension between guest experience and margin control. Rooms can sell out while ancillary revenue underperforms. Dining rooms can look busy while food cost, labor cost, waste, and discounting quietly erode profitability. That is why restaurant and hospitality dashboard templates have become practical operating tools, not just finance reports.Restaurant Hospitality Dashboard Templates
The pressure is real. The National Restaurant Association’s 2026 State of the Restaurant Industry projects U.S. restaurant industry sales of $1.55 trillion in 2026, while BLS data published through FRED showed food services and drinking places employment at 12.3467 million people in June 2026. Large revenue, large teams, thin execution windows: F&B leaders need reporting that turns raw activity into decisions quickly.
This roundup compares six NextGenTemplates tools for restaurants, hotels, food service teams, and F&B operators. The title focuses on Excel because most small and mid-sized teams still run planning in spreadsheets, but this list also includes two Power BI versions for teams that prefer interactive BI reporting and publishing.
Key Features of These Restaurant and Hospitality Dashboard Templates
The best F&B dashboard templates have one job: help managers see what changed, where it changed, and what action should follow. Across the six tools below, the strongest features are practical rather than decorative.
- Executive KPI cards: Revenue, net revenue, COGS, profitability rate, bookings, room revenue, F&B revenue, guest satisfaction, and year-to-date KPI progress.
- Operational filters: Slicers and filters for branch, property, room type, channel, department, product category, region, month, season, and loyalty segment.
- Purpose-built pages: Separate views for overview, revenue analysis, cost breakdown, branch or property performance, booking trends, guest analysis, KPI trend, and target comparison.
- Spreadsheet-friendly workflows: Excel versions use structured data sheets, pivot tables, charts, and slicers so teams can refresh reporting without rebuilding the workbook.
- BI-ready options: Power BI versions support richer interaction, DAX measures, and shareable reports for teams already using Microsoft Power BI.
 Launch offer
From your first Pivot Table to the Data Model, DAX, Power Query and a one-page KPI dashboard. 11h 51m of video by PK, with practice files, quizzes and a capstone.
Dashboard Pages and Operating Areas Explained
A restaurant or hotel dashboard should not force every stakeholder into the same page. General managers need a fast health check. Finance teams need margin and cost visibility. Operations leaders need branch, department, and channel views. These templates split the work into focused reporting areas.
Overview pages summarize the current state with top-line KPIs, charts, and filters. Revenue pages break performance down by room revenue, F&B revenue, booking channel, shift, item category, or department. Cost and P&L pages highlight COGS, labor, waste, expenses, and profitability rate. Property and branch pages compare locations so leaders can see whether a problem is company-wide or local. Trend pages add month-by-month context, which is essential when seasonality drives guest volume, staffing, and purchasing.Restaurant Hospitality Dashboard Templates
Restaurant & Hospitality Dashboard Templates vs. Generic Spreadsheets vs. Paid Restaurant SaaS – Feature Comparison
| Option | Best fit | Tradeoff |
|---|---|---|
| Ready Excel or Power BI templates | Teams that want fast KPI reporting, editable data, and a low setup burden | Requires consistent data entry and periodic refresh discipline |
| Generic spreadsheets | Very small teams tracking only a few metrics | Usually lacks visual design, slicers, KPI definitions, and multi-page analysis |
| Restaurant or hotel SaaS platforms | Organizations needing live POS/PMS integrations, workflow automation, and user permissions | Higher subscription cost, longer onboarding, and less control over custom workbook logic |
Explore Relevant Templates
| Template | Platform | Use it for |
|---|---|---|
| Hotel and Hospitality Revenue Dashboard in Excel | Excel | Hotel revenue, room revenue, booking trends, guest satisfaction, property performance, and channel analysis. |
| Hotel and Hospitality Revenue Dashboard in Power BI | Power BI | Interactive hotel revenue reporting with property, booking, guest, and seasonal filters. |
| Restaurant P and L Dashboard in Power BI | Power BI | Branch P&L, revenue analysis, COGS, labor, waste, expenses, and profitability trends. |
| Restaurant P and L Dashboard in Excel | Excel | Restaurant owners and finance teams that want a workbook-based P&L dashboard with pivot refresh. |
| Food and Beverage Dashboard in Excel | Excel | F&B sales, costs, margins, departments, product categories, regions, and monthly trends. |
| Restaurants & Food Services KPI Dashboard in Excel | Excel | MTD/YTD KPI tracking, actual vs. target reporting, previous-year comparison, and KPI definitions. |
Hotel and Hospitality Revenue Dashboard in Excel
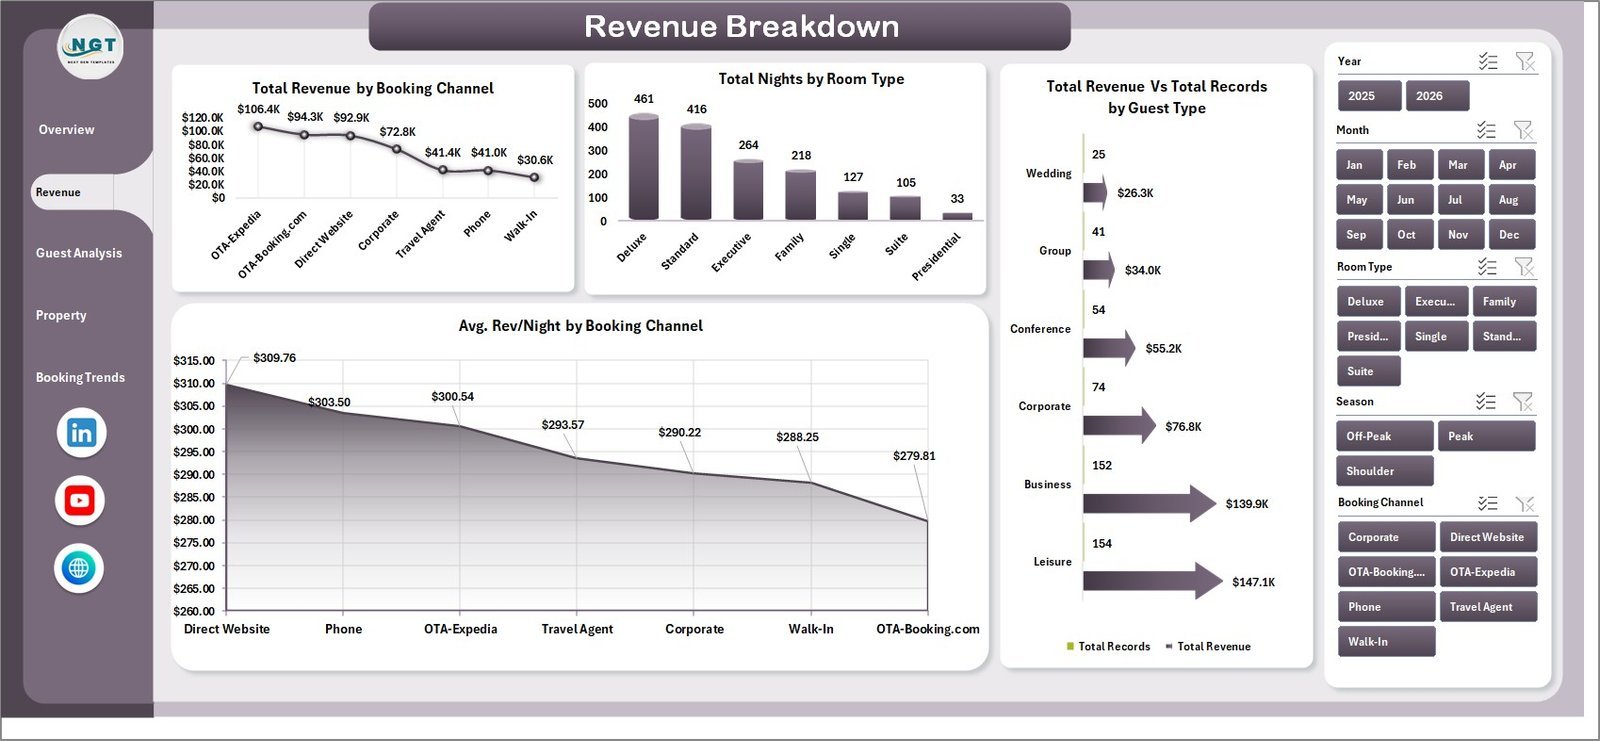
This Excel dashboard is the best starting point for hotel teams that want revenue reporting without moving into a full BI stack. It includes pages for overview, revenue breakdown, guest analysis, property performance, and booking trends, with slicers for property, room, booking channel, season, and loyalty segment.Restaurant Hospitality Dashboard Templates
View the Hotel and Hospitality Revenue Dashboard in Excel
Hotel and Hospitality Revenue Dashboard in Power BI
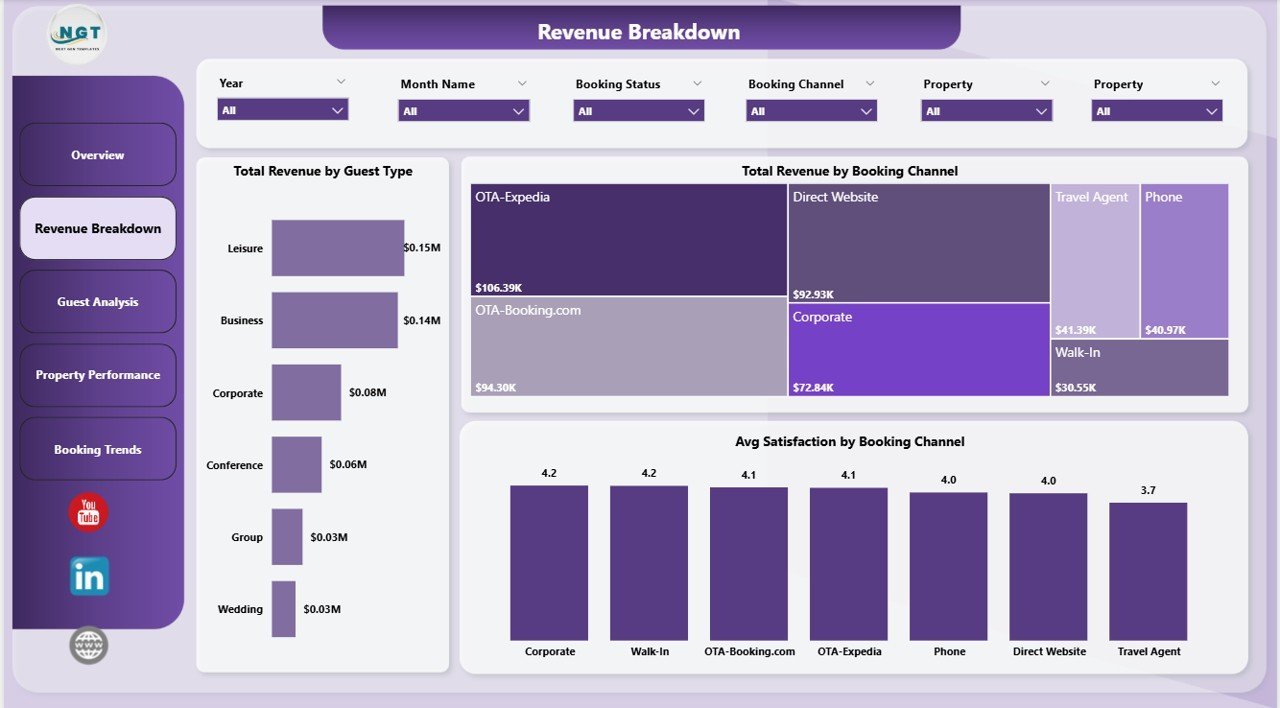
Use the Power BI version when hotel leadership wants richer interactivity, shared reports, and BI-style exploration. It tracks room revenue, spa revenue, F&B revenue, total bookings, guest performance, property comparisons, and booking trends in a polished Power BI report.
View the Hotel and Hospitality Revenue Dashboard in Power BI
Restaurant P and L Dashboard in Power BI
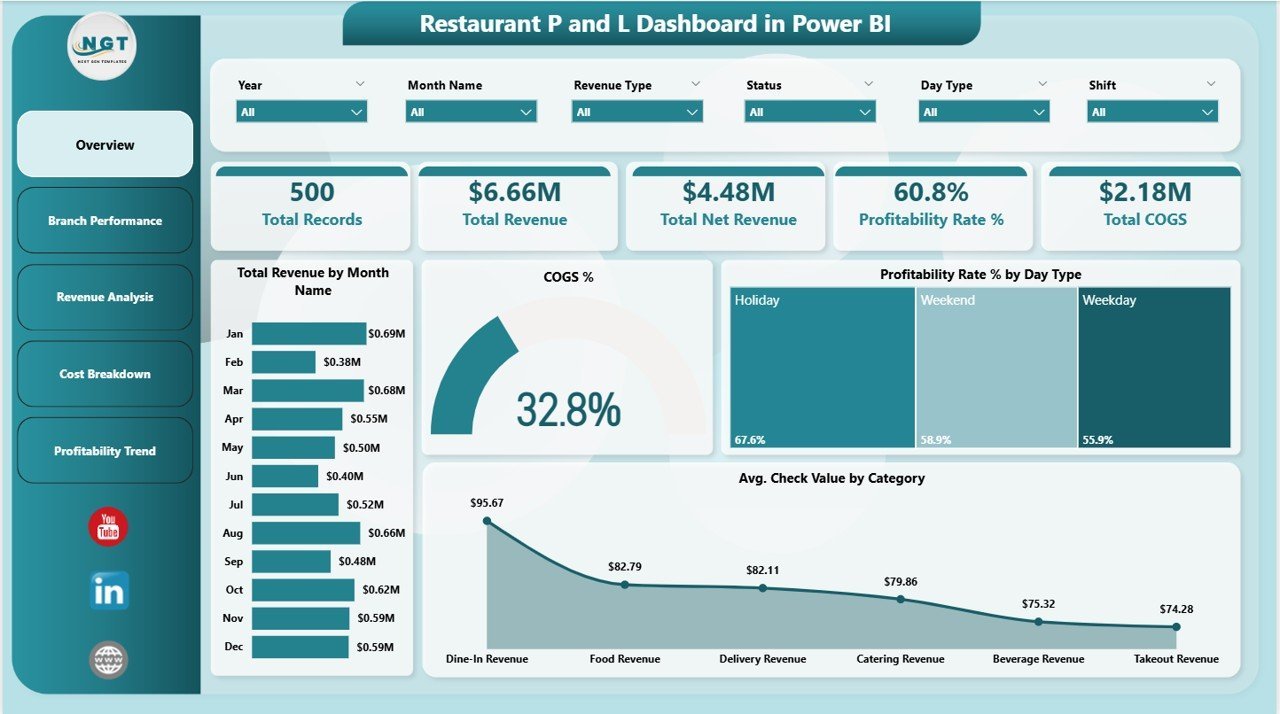
This template is built for restaurant groups that need to compare branches, track profitability, and drill into revenue and cost drivers. The five-page report covers overview, branch performance, revenue analysis, cost breakdown, and profitability trends.Restaurant Hospitality Dashboard Templates
View the Restaurant P and L Dashboard in Power BI
Restaurant P and L Dashboard in Excel
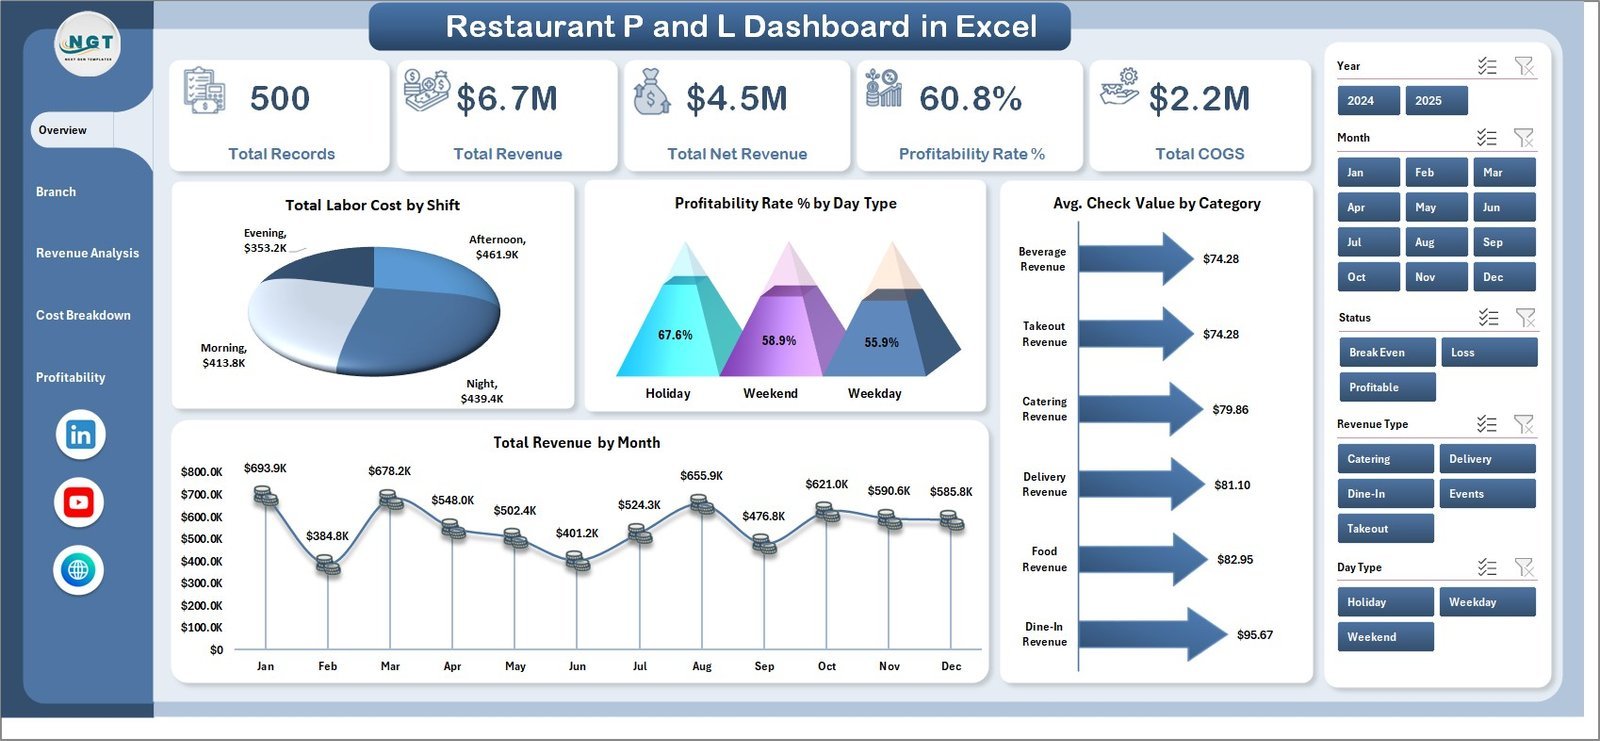
The Excel version is ideal when the accounting or ownership team already works in workbooks. It keeps the core P&L views, KPI cards, data sheet, support sheet, and pivot-based refresh process in a familiar Excel environment.
View the Restaurant P and L Dashboard in Excel
Food and Beverage Dashboard in Excel
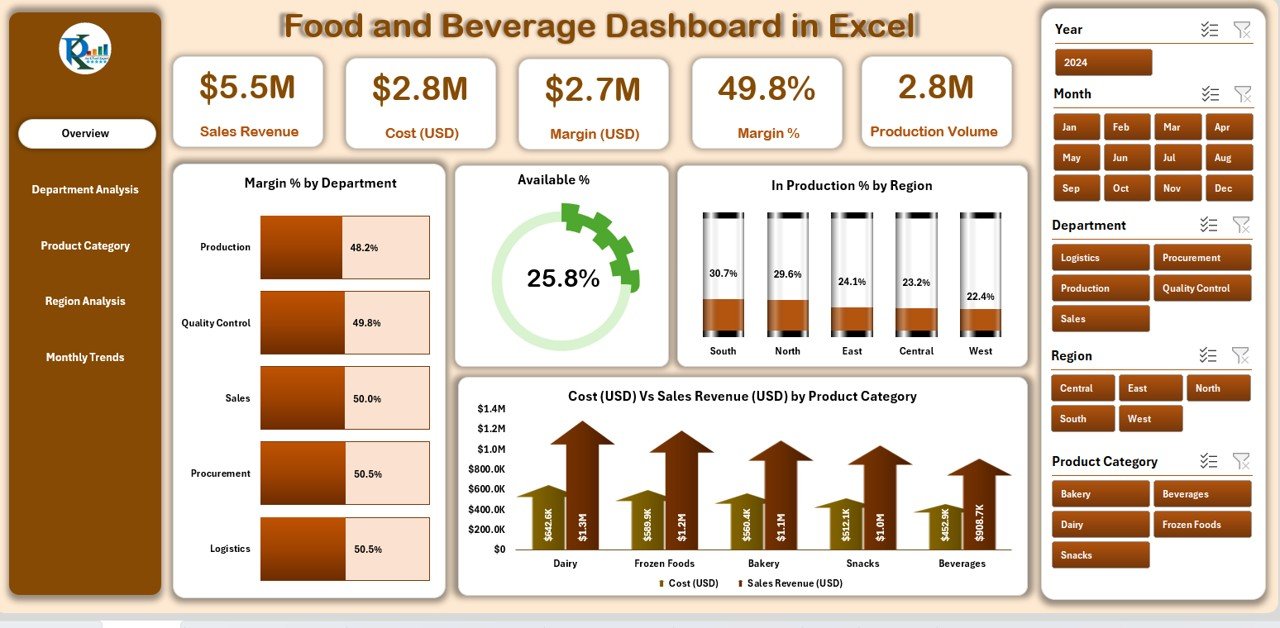
This is the broadest F&B operations template in the set. It works well for teams tracking product categories, departments, regions, costs, sales, margins, and monthly performance across food and beverage operations.Restaurant Hospitality Dashboard Templates
View the Food and Beverage Dashboard in Excel
Restaurants & Food Services KPI Dashboard in Excel

This KPI workbook is useful when leadership wants a scorecard rather than a detailed P&L model. It includes MTD and YTD tracking, target comparison, previous-year comparison, trend analysis, and KPI definition sheets.Restaurant Hospitality Dashboard Templates
View the Restaurants & Food Services KPI Dashboard in Excel
Running operations beyond the kitchen, such as rotas, equipment maintenance and stock? Compare these with our operations manager tools: 8 Excel, Sheets and Power BI templates.
Who Should Use These Templates
These dashboards are built for restaurant owners, hotel revenue managers, F&B directors, finance analysts, catering businesses, multi-branch operators, and consultants who need a faster way to present operational performance. Excel versions are best for teams that want direct control of the workbook. Power BI versions are best for teams that already use Microsoft BI, need interactive reports, or want to publish dashboards to stakeholders.Restaurant Hospitality Dashboard Templates
Real-World Use Cases
- Weekly leadership meetings where managers review sales, COGS, net revenue, and profitability by location.
- Monthly hotel revenue reviews comparing properties, booking channels, room types, and guest segments.
- F&B category reviews where teams decide which product lines deserve menu attention, pricing updates, or purchasing changes.
- KPI scorecards for franchise owners, cafe chains, catering operators, and food service management teams.Restaurant Hospitality Dashboard Templates
Advantages
The main advantage is speed. A ready dashboard gives teams a reporting structure, visual layout, KPI logic, and analysis flow without starting from a blank workbook. The second advantage is consistency: once the same metrics appear every week or month, leaders can compare performance instead of debating which spreadsheet is correct. The third advantage is flexibility because the Excel files can be edited, extended, and adapted to local reporting needs.
Opportunities for Improvement
Templates still depend on clean inputs. Before relying on any dashboard, standardize branch names, category names, date formats, and cost classifications. Larger companies may also want to connect dashboards to POS, PMS, accounting, or inventory systems. The Excel templates are excellent for owner-led and analyst-led reporting, while Power BI or SaaS integrations may be better once data volume, governance, and access control become more complex.Restaurant Hospitality Dashboard Templates
Best Practices for F&B Dashboard Reporting
Start with a small KPI set: revenue, net revenue, COGS, labor, profitability, guest satisfaction, and one or two operational drivers. Add more metrics only when they change decisions. For Excel dashboards, use structured tables, refresh pivots consistently, and document KPI definitions. Microsoft’s guidance on Excel slicers is useful because slicers help managers filter tables and PivotTables without editing formulas. For BI teams, Microsoft’s Power BI Desktop quickstart explains the basic connect-load-report workflow.
Run catering for airlines rather than restaurants? Our guide to the best airline operations dashboard templates ranks an airline catering KPI scorecard that tracks meal cost, wastage and on-time delivery.
FAQ
What are restaurant and hospitality dashboard templates?
They are prebuilt Excel or Power BI files that turn restaurant, hotel, or F&B operating data into KPI cards, charts, tables, and filters for management reporting.Restaurant Hospitality Dashboard Templates
Which template is best for restaurant profitability?
The Restaurant P and L Dashboard in Excel is best for workbook-based profitability tracking, while the Power BI version is better for interactive branch analysis and shared reporting.
Which template is best for hotel revenue management?
The Hotel and Hospitality Revenue Dashboard in Excel is best for spreadsheet users. The Power BI version is stronger when hotel teams need richer filtering, publishing, and interactive exploration.
Can these templates replace restaurant SaaS?
They can replace manual reporting for many small and mid-sized teams, but they do not replace live POS, PMS, payroll, or inventory integrations that dedicated SaaS platforms may provide.
Are Excel dashboards still useful for F&B operations?
Yes. Excel remains useful when teams need editable models, fast deployment, familiar workflows, and a lower-cost alternative to custom BI development.Restaurant Hospitality Dashboard Templates
About the Author
Built by PK – Microsoft Certified Professional with 15+ years of Excel, Google Sheets, and Power BI experience. Founder of NextGenTemplates, reaching 300K+ subscribers across YouTube channels. Every template is hand-built and tested before release. Explore more tutorials on the NextGenTemplates YouTube channel.
Conclusion
Restaurant and hospitality dashboard templates help F&B teams make better decisions with the data they already collect. If your biggest need is ownership-level reporting, start with an Excel workbook. If your team needs shared, interactive reporting, choose the Power BI versions. Either way, the right dashboard should make revenue, costs, margins, branches, properties, and trends easier to act on every week.Restaurant Hospitality Dashboard Templates
Pair these dashboards with our explainer on the 12 restaurant KPIs to track in 2026, covering Prime Cost, RevPASH and the formulas behind each metric.