


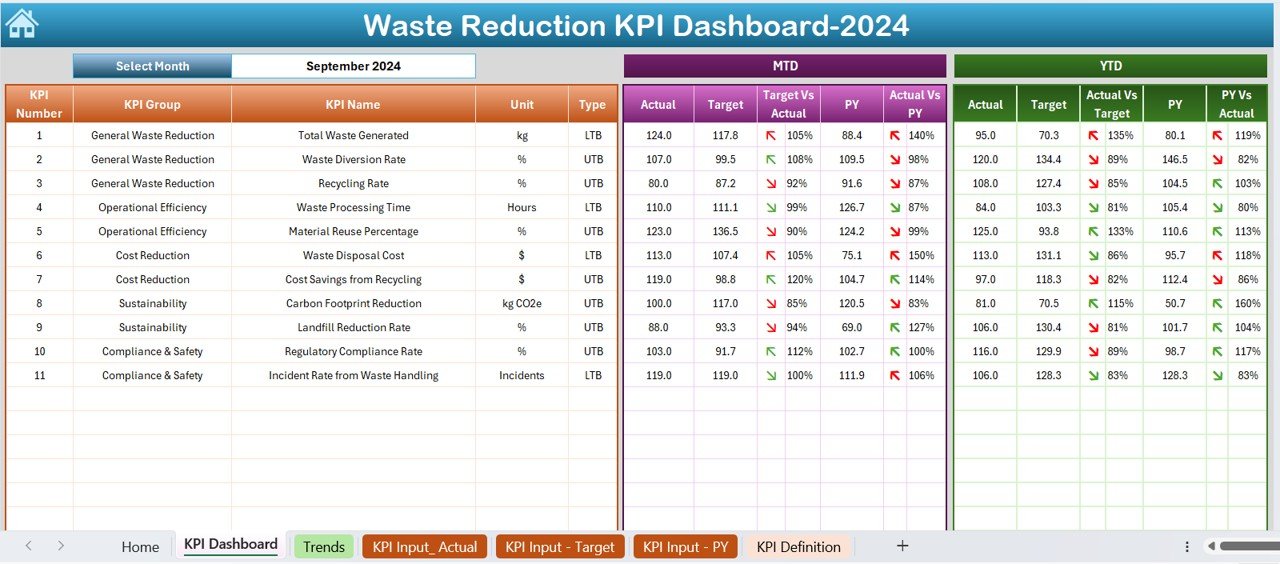
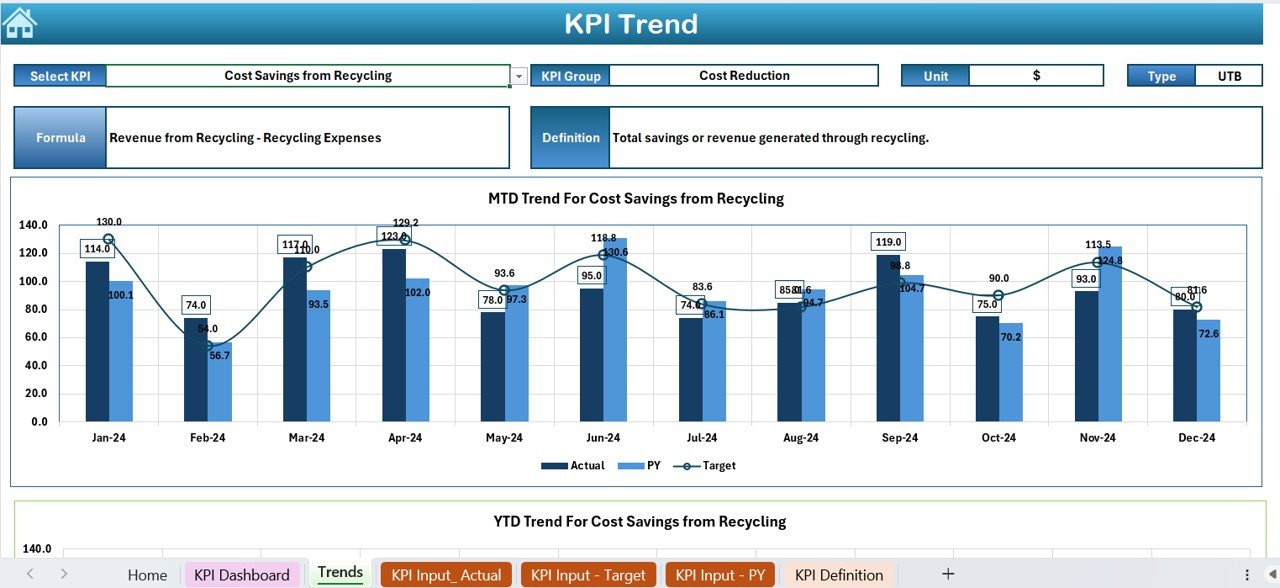
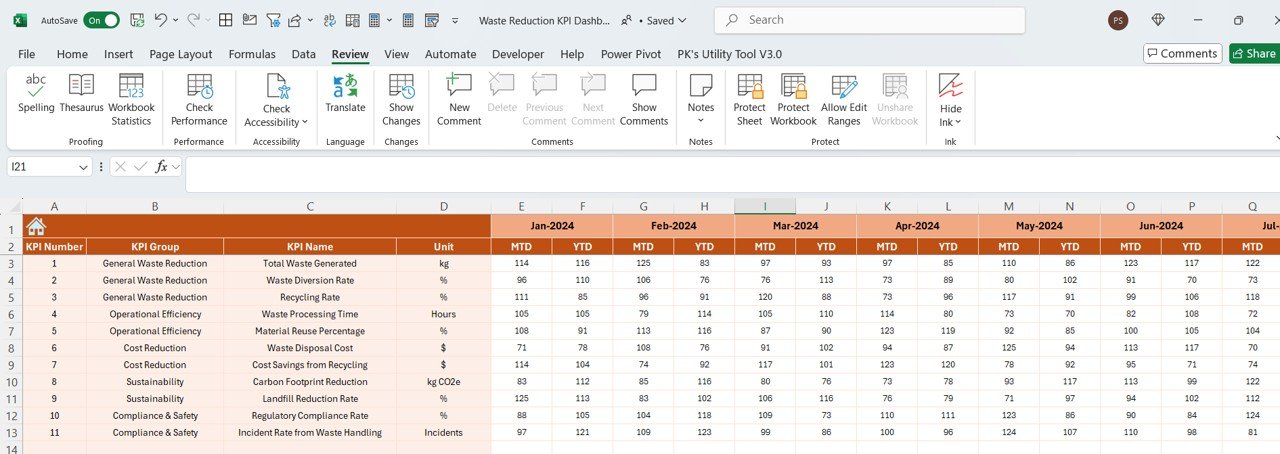
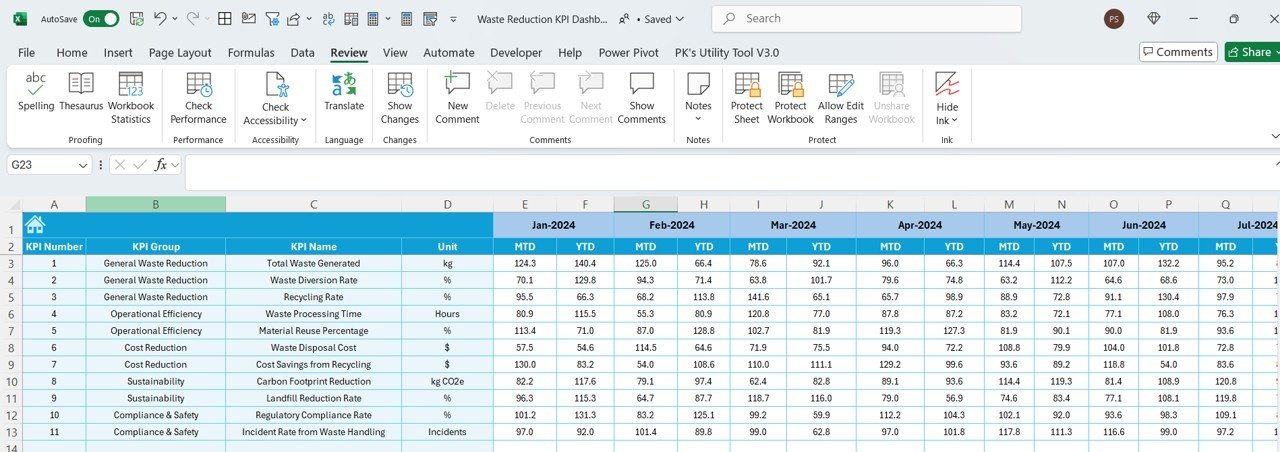


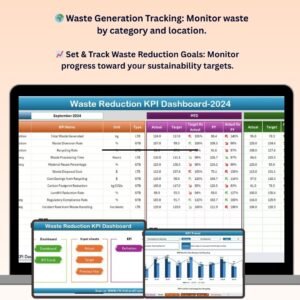
The Waste Reduction KPI Dashboard in Excel is an essential tool for organizations and businesses that are committed to sustainability and reducing waste. This Excel-based dashboard allows you to monitor key performance indicators (KPIs) related to waste reduction efforts, track recycling rates, assess resource efficiency, and measure the impact of waste reduction strategies.
With this dashboard, you can track and visualize waste data across different departments or locations, set reduction goals, and monitor progress in real-time. It’s perfect for businesses aiming to meet sustainability targets, improve resource management, and reduce environmental impact.
Key Features of the Waste Reduction KPI Dashboard in Excel
🌍 Waste Generation Tracking
Track the amount of waste generated across various categories such as paper, plastics, metals, and organic waste. Monitor waste generation by department or location to identify high-waste areas and take corrective actions.
📈 Waste Reduction Goals & Targets
Set specific waste reduction goals and track progress over time. Measure the success of your waste reduction strategies and make data-driven decisions to improve efficiency and reduce waste.
🔄 Recycling and Resource Efficiency Metrics
Monitor recycling rates and the effectiveness of resource management. Track how much material is being recycled versus disposed of and identify areas for improvement in your waste diversion efforts.
📊 Real-Time Data & Visual Reports
Visualize your waste reduction performance with real-time tracking and dynamic charts. The interactive reports help you easily identify trends, track goals, and evaluate the effectiveness of your waste reduction strategies.
⚙️ Customizable KPIs & Metrics
The dashboard is fully customizable, allowing you to track KPIs that are most relevant to your business or organization. Add custom categories, adjust metrics, and tailor the dashboard to fit your sustainability goals.
📅 Time-Based Tracking & Reporting
Monitor waste reduction progress over different time periods (daily, weekly, monthly, or yearly). Assess the effectiveness of long-term strategies and identify seasonal trends in waste generation.
Why You’ll Love the Waste Reduction KPI Dashboard in Excel
✅ Optimize Waste Reduction Efforts
Track and assess waste generation and recycling data to improve resource efficiency and achieve your sustainability goals.
✅ Set & Monitor Waste Reduction Goals
Easily set specific waste reduction targets and monitor your progress towards achieving them, ensuring that your organization meets its sustainability commitments.
✅ Measure Recycling Effectiveness
Evaluate your recycling rates and resource efficiency to optimize waste diversion efforts. Ensure that your organization is meeting its environmental objectives.
✅ Real-Time Performance Monitoring
Stay updated with real-time performance tracking. Use visual charts to quickly identify waste trends, evaluate the success of waste reduction strategies, and adjust your efforts accordingly.
✅ Fully Customizable for Your Needs
Tailor the dashboard to fit your company’s waste reduction initiatives. Add new KPIs, adjust metrics, and modify categories to suit your specific objectives.
What’s Inside the Waste Reduction KPI Dashboard in Excel?
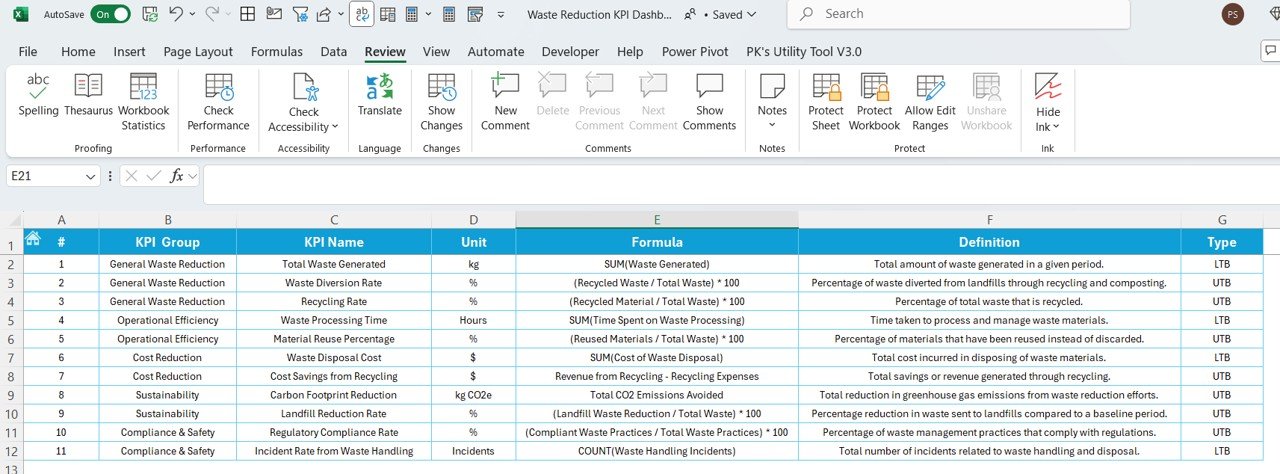
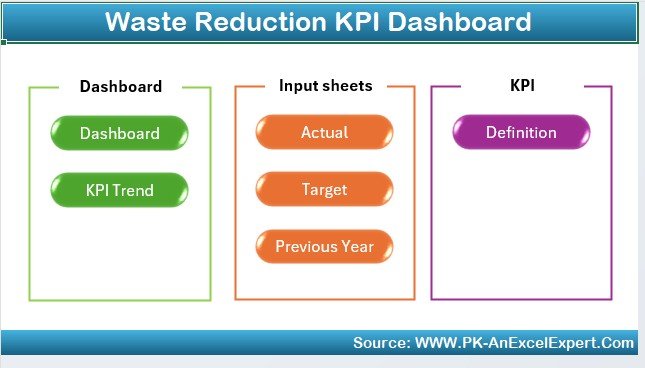
- Waste Generation Tracker: Track waste amounts by category, department, or location.
- Recycling & Resource Efficiency Metrics: Monitor recycling rates and waste diversion effectiveness.
- Goal Setting & Tracking: Set waste reduction targets and track progress.
- Time-Based Performance Analysis: Monitor data over different periods to evaluate trends and effectiveness.
- Customizable KPIs & Categories: Tailor the dashboard to reflect your unique waste reduction goals.
- Real-Time Data Visualization: Use charts and reports to visualize and analyze waste reduction performance.
How to Use the Waste Reduction KPI Dashboard in Excel
1️⃣ Download the Template: Get immediate access to the Waste Reduction KPI Dashboard in Excel.
2️⃣ Set Up Waste Categories: Customize the dashboard by adding waste categories, departments, or locations specific to your business.
3️⃣ Track Waste Generation & Recycling: Monitor waste amounts, recycling rates, and resource efficiency.
4️⃣ Set & Monitor Goals: Set specific waste reduction targets and track your progress toward achieving them.
5️⃣ Visualize & Analyze: Use charts and reports to assess trends, evaluate strategies, and adjust your waste reduction initiatives.
Who Can Benefit from the Waste Reduction KPI Dashboard in Excel?
🔹 Sustainability Managers & Environmental Officers
🔹 Operations & Facility Managers
🔹 Waste Management Companies
🔹 Corporate Social Responsibility (CSR) Teams
🔹 Nonprofit Organizations Focused on Sustainability
🔹 Small & Medium Enterprises (SMEs) & Large Corporations
🔹 Educational Institutions with Sustainability Initiatives
Ensure that your business is meeting its waste reduction goals and sustainability objectives with the Waste Reduction KPI Dashboard in Excel. Track waste generation, monitor recycling efforts, and optimize resource usage to create a greener future.
Click here to read the Detailed blog post
Visit our YouTube channel to learn step-by-step video tutorials
Youtube.com/@PKAnExcelExpert






























Reviews
There are no reviews yet.