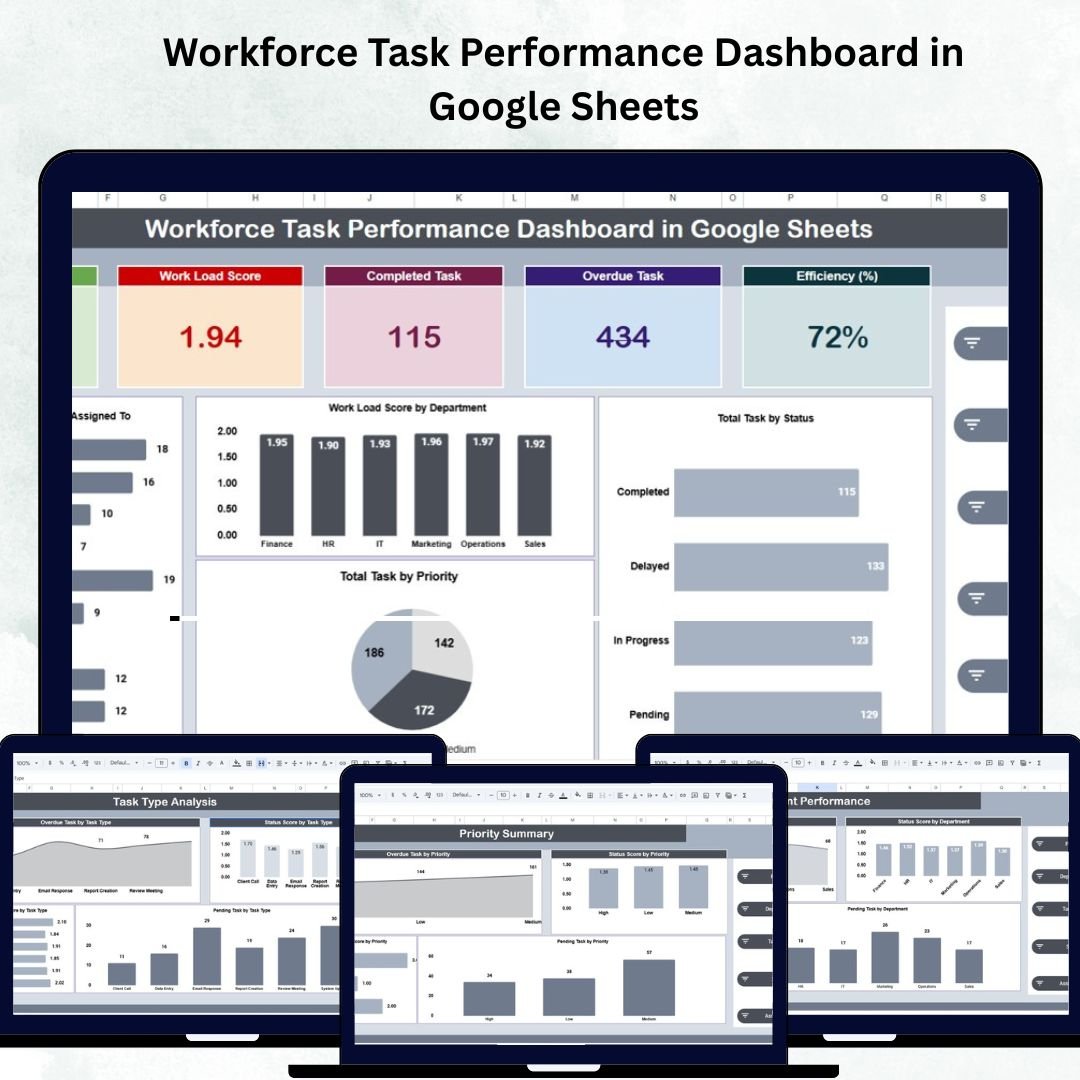
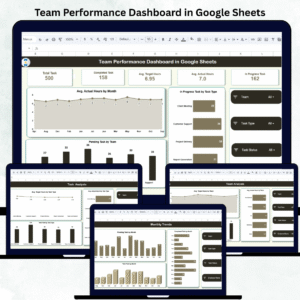
In a fast-paced business environment, keeping track of team productivity and task completion is crucial. The Workforce Task Performance Dashboard in Google Sheets provides a powerful, ready-to-use tool to help organizations monitor employee workload, task progress, and efficiency metrics — all in one place.Workforce Task Performance Dashboard in Google Sheets
This intuitive dashboard is designed for managers, team leads, and HR professionals who want a data-driven way to visualize workforce performance, identify bottlenecks, and improve overall operational efficiency. With real-time collaboration and automatic updates, it transforms complex task data into clear insights that drive productivity and accountability.Workforce Task Performance Dashboard in Google Sheets
🔑 Key Features of the Workforce Task Performance Dashboard in Google Sheets
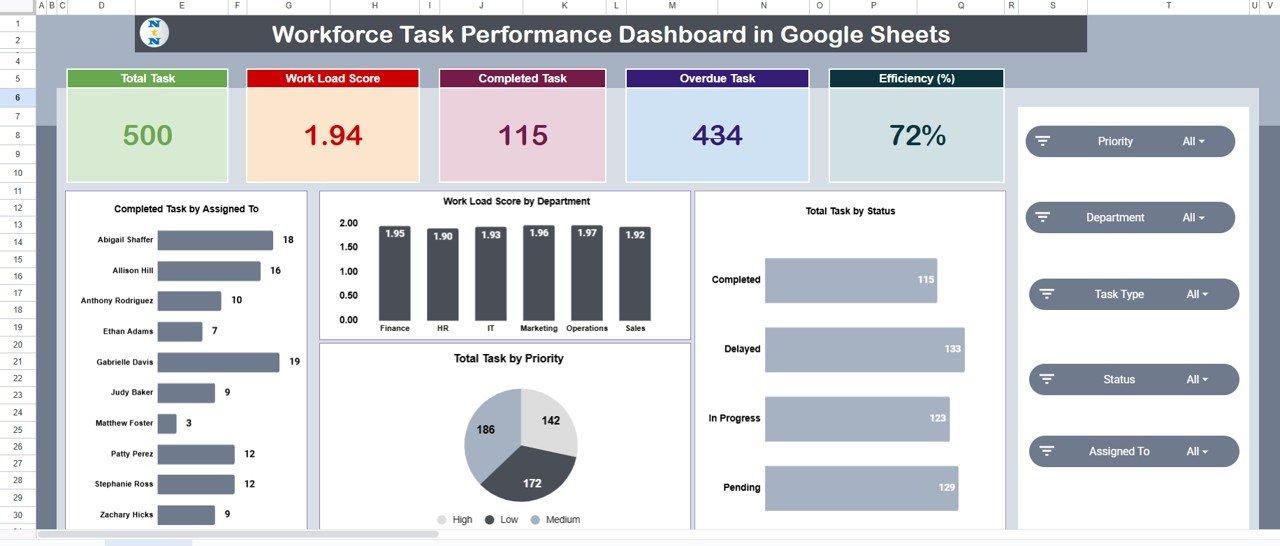
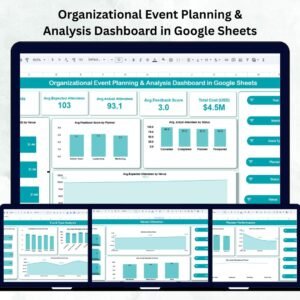
🏠 1. Overview Sheet Tab
The Overview Sheet acts as the central control hub of the dashboard, offering an instant snapshot of overall workforce performance.Workforce Task Performance Dashboard in Google Sheets
Key Metrics (Cards):
-
📋 Total Tasks: The total number of tasks assigned across all departments.
-
💼 Work Load Score: Aggregated workload intensity for the entire organization.
-
✅ Completed Tasks: Count of tasks successfully completed within deadlines.
-
⏰ Overdue Tasks: Tasks pending beyond their due dates.
-
⚡ Efficiency (%): Ratio of completed tasks to total assigned tasks.
Charts Included:
-
📊 Completed Tasks by Assigned To – Reveals top-performing employees.
-
🏢 Work Load Score by Department – Highlights task distribution across teams.
-
⏱️ Total Tasks by Status – Displays proportions of Pending, In Progress, and Completed tasks.
-
🔺 Total Tasks by Priority – Shows task urgency distribution by High, Medium, and Low priorities.
This sheet gives managers a holistic overview of workforce activity at a glance.
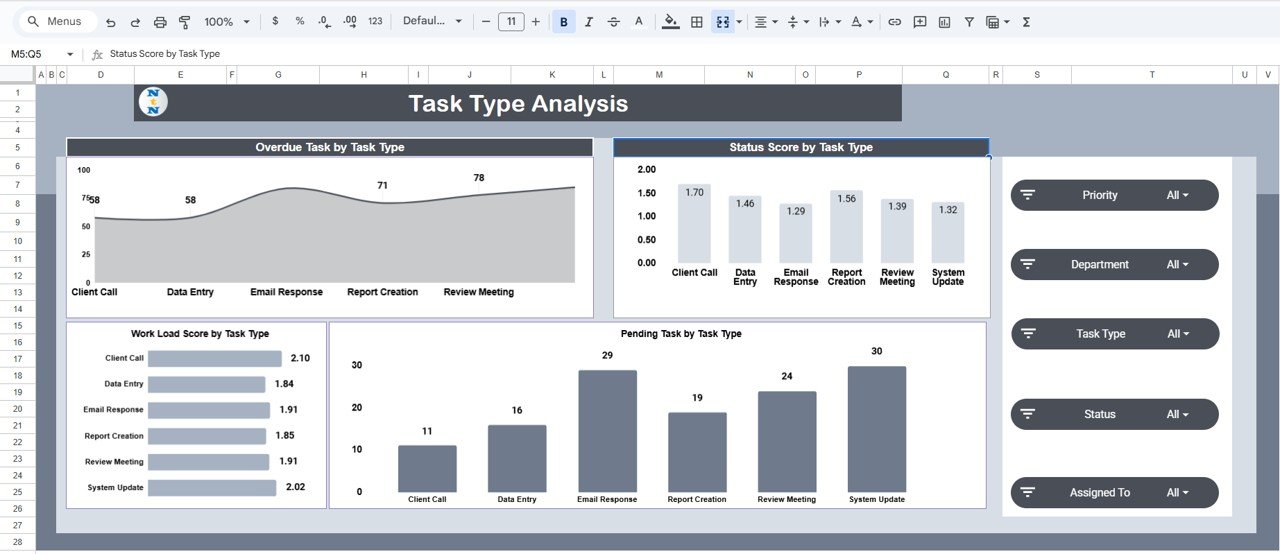
📋 2. Task Type Analysis
Understand performance based on different task categories.
Charts Include:
-
🚨 Overdue Tasks by Task Type – Detects categories causing the most delays.
-
📈 Status Score by Task Type – Visualizes completion vs pending performance.
-
⚙️ Work Load Score by Task Type – Evaluates which task types consume more effort.
-
🕒 Pending Tasks by Task Type – Lists outstanding tasks requiring attention.
Ideal for operations, project, or admin managers aiming to identify weak areas in task execution.
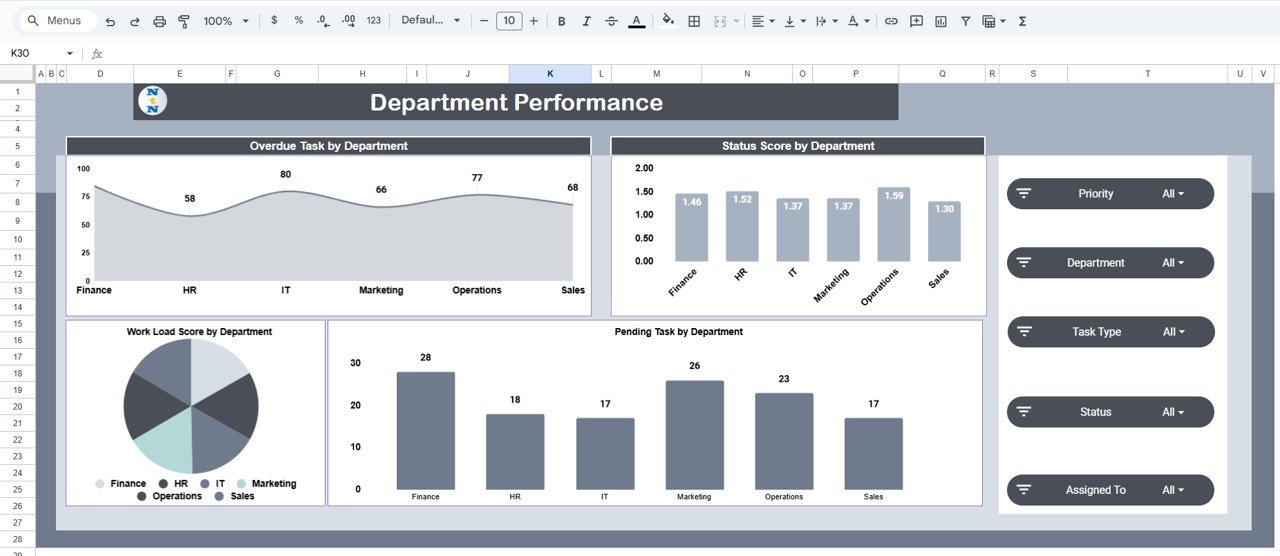
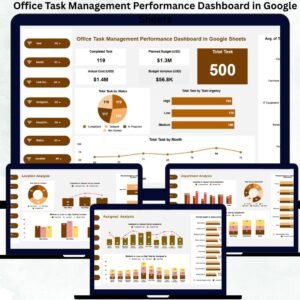
🏢 3. Department Performance
Gain a comprehensive view of each department’s workload and completion rates.
Charts Include:
-
🏗️ Overdue Tasks by Department – Pinpoints underperforming teams.
-
✅ Status Score by Department – Compares task completion efficiency across departments.
-
⚖️ Work Load Score by Department – Reveals imbalances in workload distribution.
-
📌 Pending Tasks by Department – Helps redistribute resources for better balance.
This analysis empowers leadership to allocate resources effectively and improve productivity across teams.
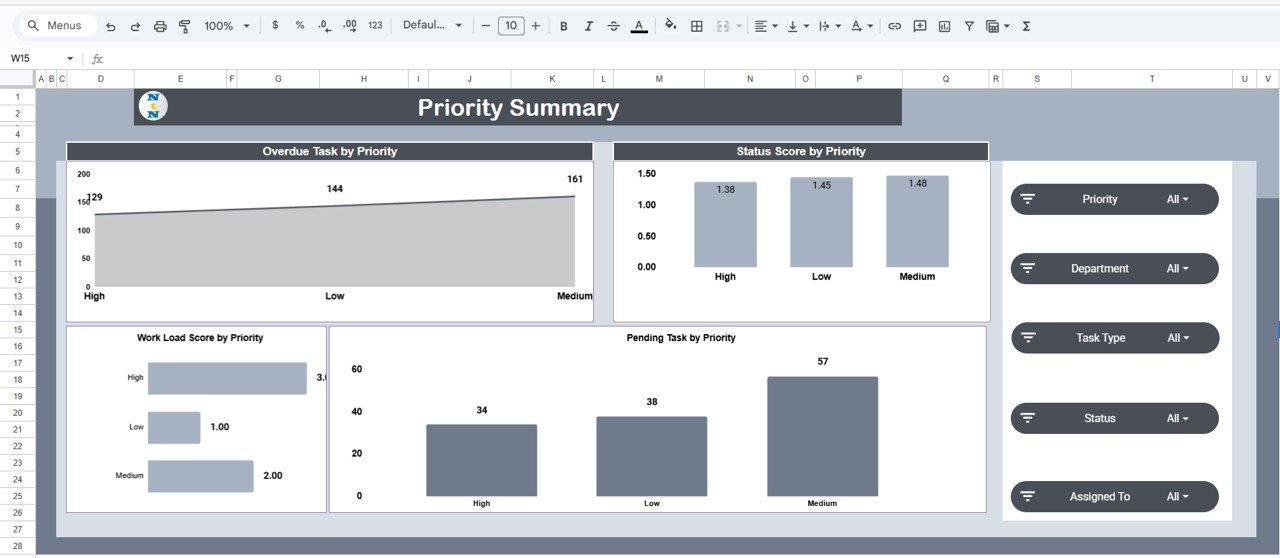
🔝 4. Priority Summary
Evaluate task performance based on urgency and importance.
Charts Include:
-
⚠️ Overdue Tasks by Priority – Identify missed deadlines in high-priority tasks.
-
📊 Status Score by Priority – Analyze success rates by urgency level.
-
⏱️ Pending Tasks by Priority – Focus attention on urgent uncompleted work.
-
💡 Work Load Score by Priority – Monitor how workload aligns with task importance.
This section helps teams manage priorities and minimize delays on critical projects.
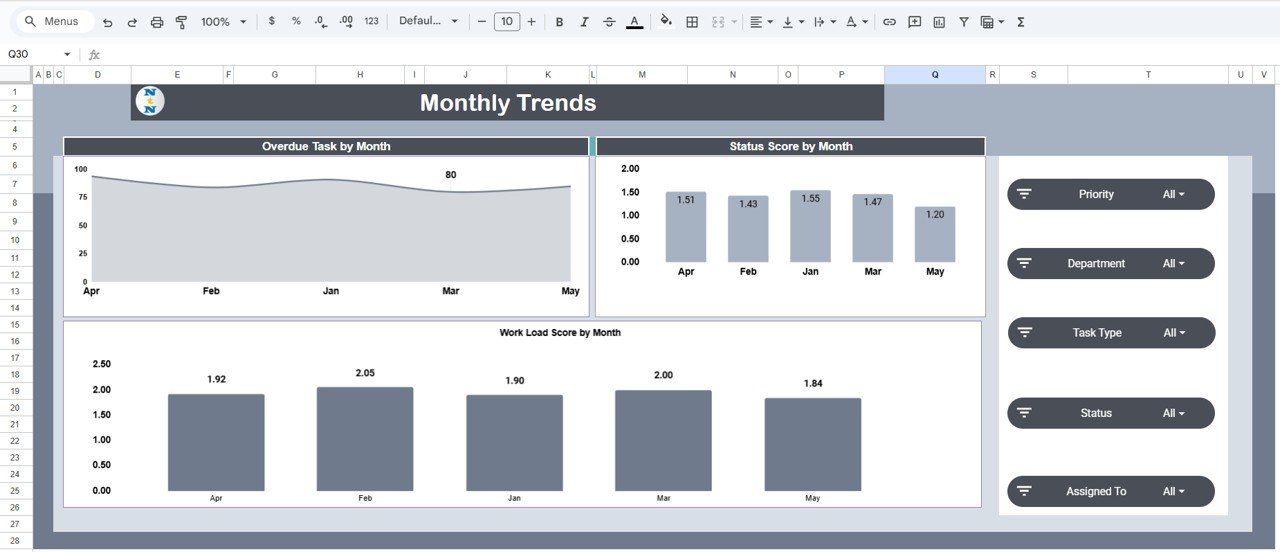
📅 5. Monthly Trends
Track long-term performance and workload trends.
Charts Include:
-
📈 Overdue Tasks by Month – Uncover recurring delay patterns.
-
🕓 Status Score by Month – Measure monthly task completion efficiency.
-
📊 Work Load Score by Month – Observe how workload fluctuates across months.
This time-based analysis supports performance forecasting and resource planning.
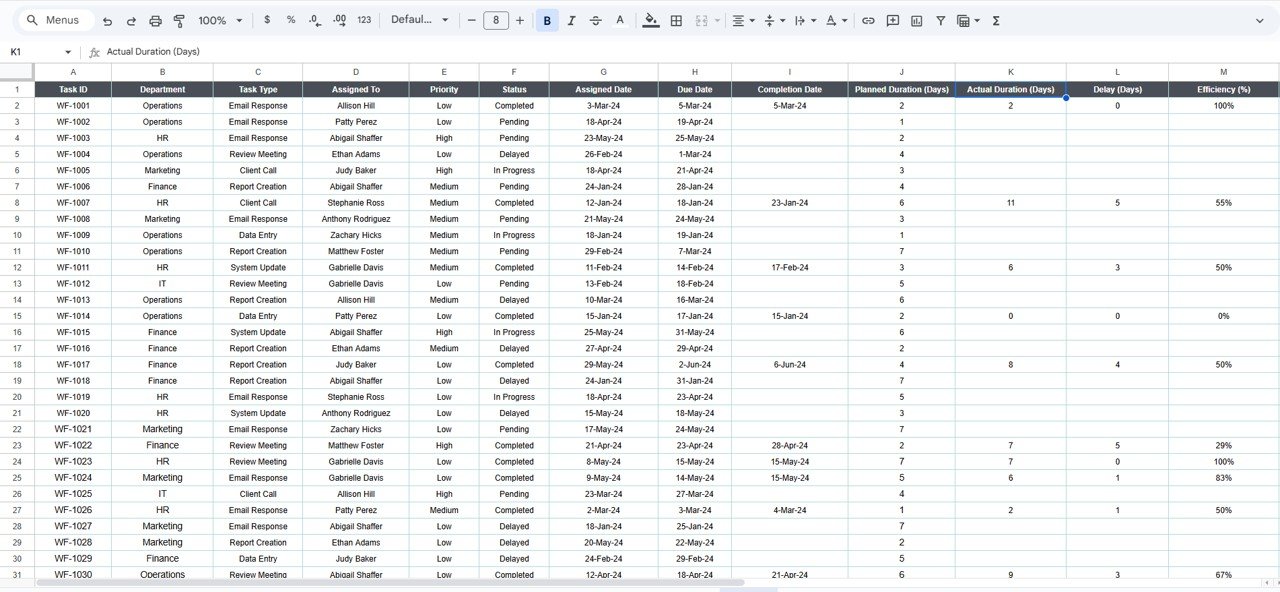
📄 6. Data Sheet Tab
The backbone of the dashboard — all visuals and metrics are automatically generated from this sheet.
Fields Include:
-
Task ID
-
Assigned To
-
Department
-
Task Type
-
Priority
-
Start Date / Due Date
-
Status
-
Completion Date
Enter or update data here, and the entire dashboard updates instantly.
🌟 Advantages of Using the Dashboard
-
📊 Comprehensive Monitoring: Track productivity across people, departments, and task types.
-
⏱️ Real-Time Insights: Automatic updates for faster decision-making.
-
⚡ Improved Efficiency: Quickly identify overdue tasks and workload bottlenecks.
-
💡 Data-Driven Decisions: Base performance reviews on accurate analytics.
-
🌍 Cloud Collaboration: Share access with managers and teams for transparency.
-
🧭 Customizable & Scalable: Add new KPIs, charts, or departments easily.
💡 Best Practices
✅ Update Data Consistently: Keep records current for accurate performance insights.
✅ Monitor Core KPIs: Track Efficiency %, Work Load Score, and Overdue Tasks closely.
✅ Balance Workload: Use departmental charts to prevent employee burnout.
✅ Review Monthly Trends: Identify performance dips early to plan interventions.
✅ Encourage Accountability: Use visual data to promote transparency and recognition.
👨💼 Who Can Use This Dashboard
💼 Managers: Monitor productivity, efficiency, and workload in real time.
👩💻 Team Leads: Assess performance and reassign workloads effectively.
🏢 HR & Operations Teams: Measure staff output and identify training needs.
📊 Executives: Gain insights into team dynamics and project outcomes.
🚀 How This Dashboard Helps Organizations
-
Enhances productivity through clear visibility of task performance.
-
Promotes team accountability with transparent workload tracking.
-
Simplifies data reporting through automated charts.
-
Enables proactive management of overdue or delayed tasks.
-
Supports data-driven workforce optimization.Workforce Task Performance Dashboard in Google Sheets
🔗 Click here to read the detailed blog post Workforce Task Performance Dashboard in Google Sheets
Watch the step-by-step video Demo:


Reviews
There are no reviews yet.