



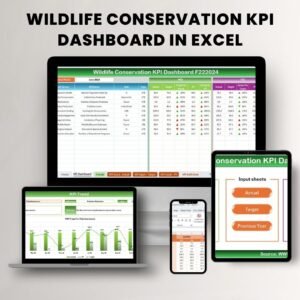
The Wildlife Conservation KPI Dashboard in Excel is an essential tool for environmental organizations, wildlife managers, and conservationists focused on monitoring and improving wildlife conservation efforts. This comprehensive Excel-based dashboard allows you to track key performance indicators (KPIs) related to wildlife preservation, habitat protection, species health, and conservation funding. With this tool, you can streamline data collection, monitor progress, and measure the success of your conservation projects.
From monitoring endangered species to tracking conservation funding and habitat restoration, this dashboard provides a clear overview of your organization’s wildlife conservation efforts. By tracking these metrics, you can make data-driven decisions, optimize resources, and ensure that conservation goals are met effectively.

Key Features of the Wildlife Conservation KPI Dashboard in Excel
🌍 Species Health & Population Tracking
Track the population status and health of species under conservation efforts. Monitor trends in species populations over time, assess risks, and measure the success of conservation strategies.
🦏 Habitat Conservation Monitoring
Monitor the health and status of protected habitats. Track habitat quality, restoration progress, and threats to habitats to ensure effective conservation of natural environments.
💰 Conservation Funding & Budget Tracking
Track the funding allocated to conservation projects and ensure that resources are being used effectively. Monitor expenses, funding gaps, and future financial needs for sustainability.
📈 Conservation Progress & Trends
Track the progress of your conservation initiatives over time. Use dynamic charts to visualize changes in species populations, habitat health, and conservation efforts.
📅 Time-Based Performance Analysis
Monitor KPIs over different periods—daily, weekly, monthly, or annually. Track conservation efforts and assess their effectiveness over various time frames.
⚙️ Customizable & Scalable Dashboard
Easily customize the dashboard to track additional metrics and tailor it to your specific conservation projects. Scale it to suit small or large-scale wildlife conservation initiatives.
Why You’ll Love the Wildlife Conservation KPI Dashboard in Excel
✅ Monitor Conservation Progress
Keep track of the health of endangered species, protected habitats, and conservation programs in one place. The dashboard provides an overview of your organization’s impact.
✅ Optimize Conservation Resources
Track funding, expenses, and resource allocation to ensure that your projects are well-funded and efficiently executed, maximizing conservation efforts.
✅ Improve Decision Making
Use data-driven insights to make informed decisions about where to focus conservation resources, whether it’s species protection, habitat restoration, or community engagement.
✅ Enhance Accountability & Transparency
By tracking KPIs and progress, you ensure transparency in your conservation efforts, improving accountability to stakeholders, donors, and the public.
✅ Customizable for Any Conservation Project
Customize the dashboard to reflect the unique needs of your wildlife conservation initiatives. Track any additional data points or metrics that are crucial for your project.
What’s Inside the Wildlife Conservation KPI Dashboard in Excel?
Species Health & Population Tracking: Monitor species population data and health status.
Habitat Conservation Monitoring: Track habitat conditions and restoration progress.
Conservation Funding & Budget Tracking: Monitor funding, expenses, and financial requirements.
Conservation Progress & Trends: Use charts to track long-term progress and trends.
Time-Based Analysis: Track conservation efforts over various time periods.
Customizable Features: Adapt the dashboard to your specific conservation goals and metrics.
How to Use the Wildlife Conservation KPI Dashboard in Excel
1️⃣ Download the Template: Get access to the Wildlife Conservation KPI Dashboard in Excel instantly.
2️⃣ Input Your Data: Enter data for species health, habitat conservation, and funding status.
3️⃣ Track KPIs & Progress: Monitor the status of key conservation indicators, such as species population and habitat restoration.
4️⃣ Analyze Trends & Data: Use time-based analysis to track the effectiveness of your conservation programs.
5️⃣ Optimize Your Conservation Efforts: Use insights to direct resources where they are needed most and improve your initiatives.
Who Can Benefit from the Wildlife Conservation KPI Dashboard in Excel?
🔹 Wildlife Conservation Organizations
🔹 Environmental NGOs & Activists
🔹 Conservation Program Managers & Coordinators
🔹 Environmental Scientists & Biologists
🔹 Government Agencies in Charge of Environmental Protection
🔹 Eco-friendly Foundations & Donors
🔹 Anyone Interested in Promoting Biodiversity & Ecosystem Preservation
Ensure the success of your wildlife conservation projects with the Wildlife Conservation KPI Dashboard in Excel. Track species health, habitat conservation efforts, funding allocation, and overall progress for better management and impact.
Click here to read the Detailed blog post
Visit our YouTube channel to learn step-by-step video tutorials
Youtube.com/@PKAnExcelExpert
Compatibility and Requirements
- Works in Microsoft Excel desktop (Excel 2016 or later, or Microsoft 365).
- The dashboard uses dynamic charts to show conservation trends. Microsoft explains charts in Create a chart from start to finish.
Frequently Asked Questions
What can I track with this dashboard?
You can track species health and population, habitat conservation and restoration progress, and conservation funding, expenses and budget.
Can I see changes over time?
Yes. The dashboard has time-based analysis, so you can review KPIs over daily, weekly, monthly or annual periods. Dynamic charts show changes in species populations, habitat health and conservation efforts.
Can I add my own metrics?
Yes. The dashboard is customizable, so you can track extra data points and adapt it to your own conservation goals, whether the project is small or large.
Is there a Power BI or Google Sheets version?
Yes. See the Wildlife Conservation KPI Dashboard in Power BI and the Wildlife Conservation KPI Dashboard in Google Sheets.
Related Conservation Templates
- Wildlife Conservation KPI Dashboard in Power BI: the same topic in Power BI
- Wildlife Conservation KPI Dashboard in Google Sheets: the same topic in Google Sheets
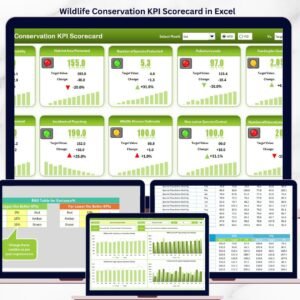
- Wildlife Conservation KPI Scorecard in Excel: a scorecard view of conservation KPIs
- Ocean Conservation KPI Dashboard in Excel: a similar dashboard for marine conservation
- ESG KPI Dashboard in Excel: track environmental, social and governance KPIs
Browse all Excel KPI dashboards.



























Reviews
There are no reviews yet.