

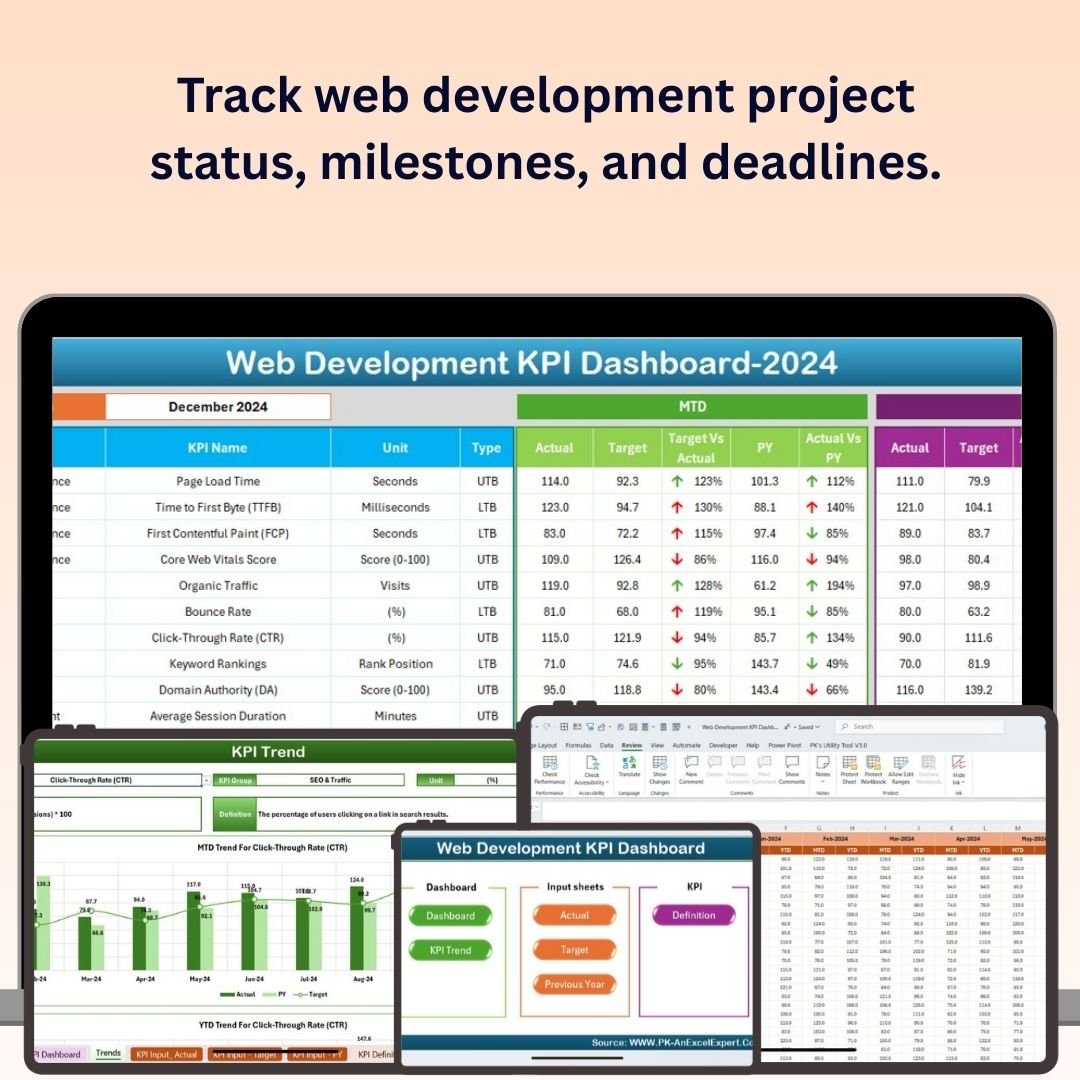
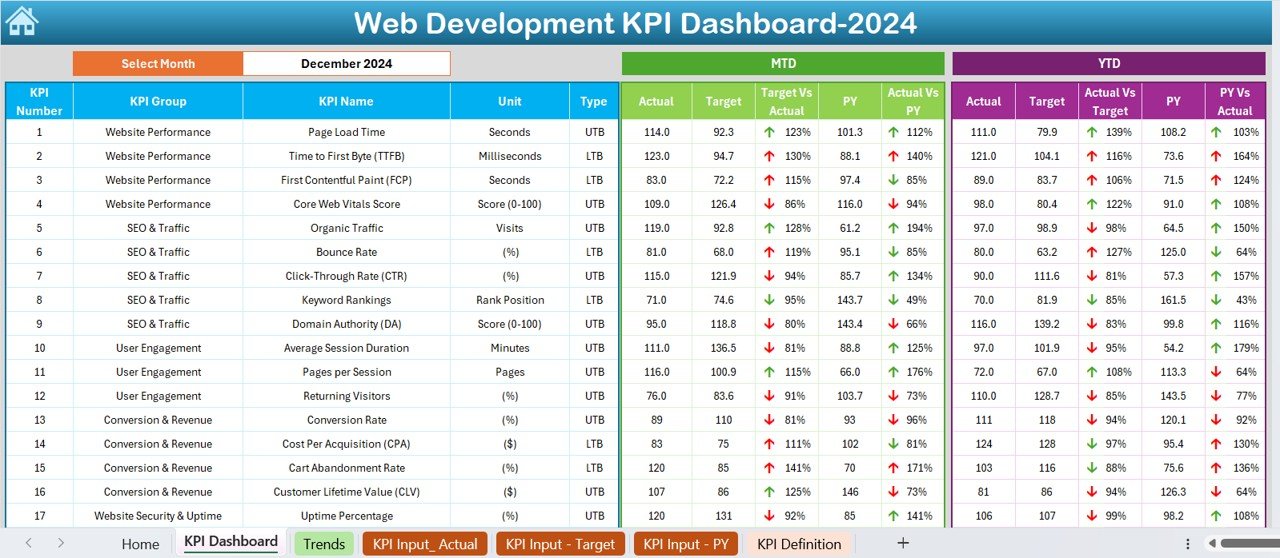
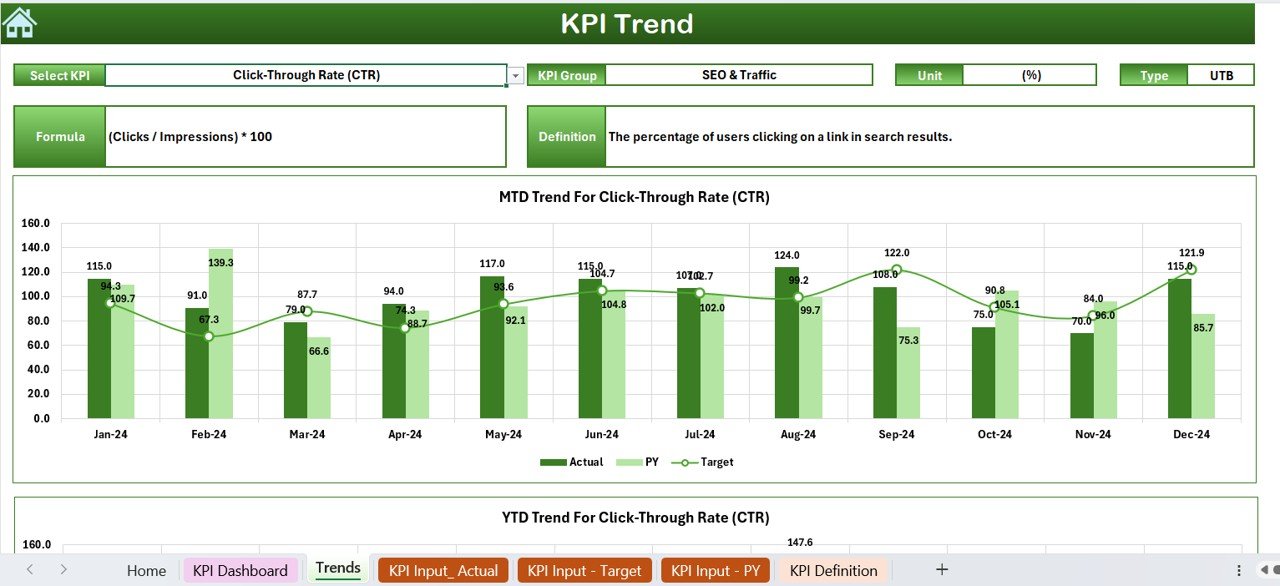
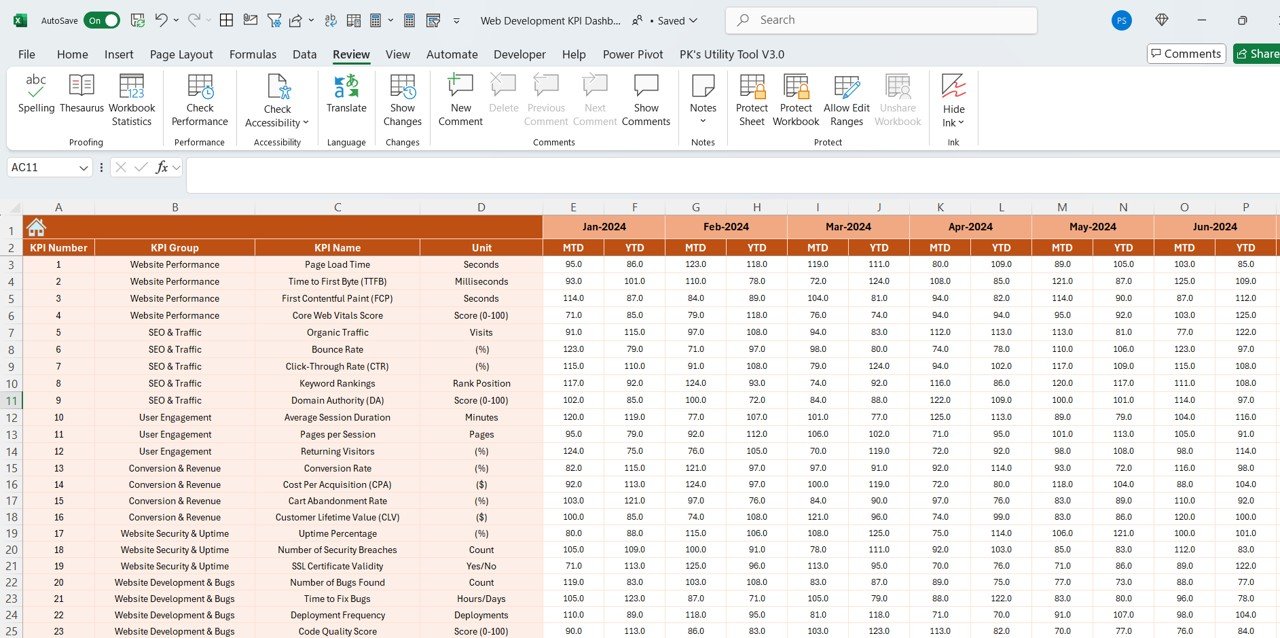
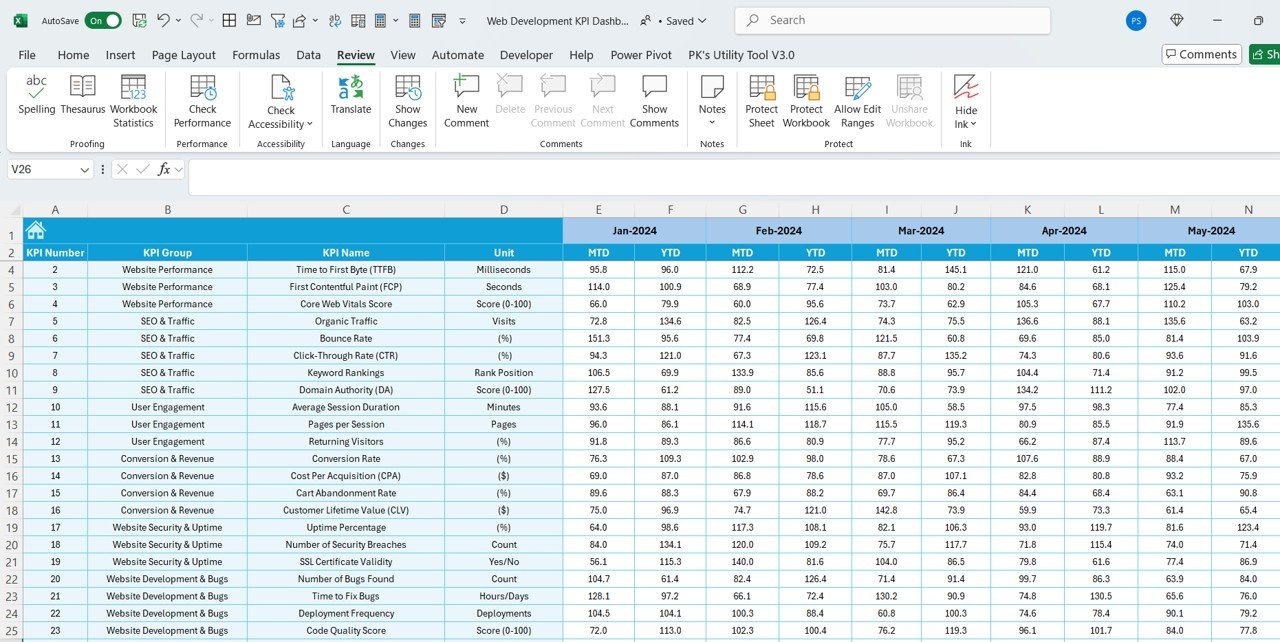
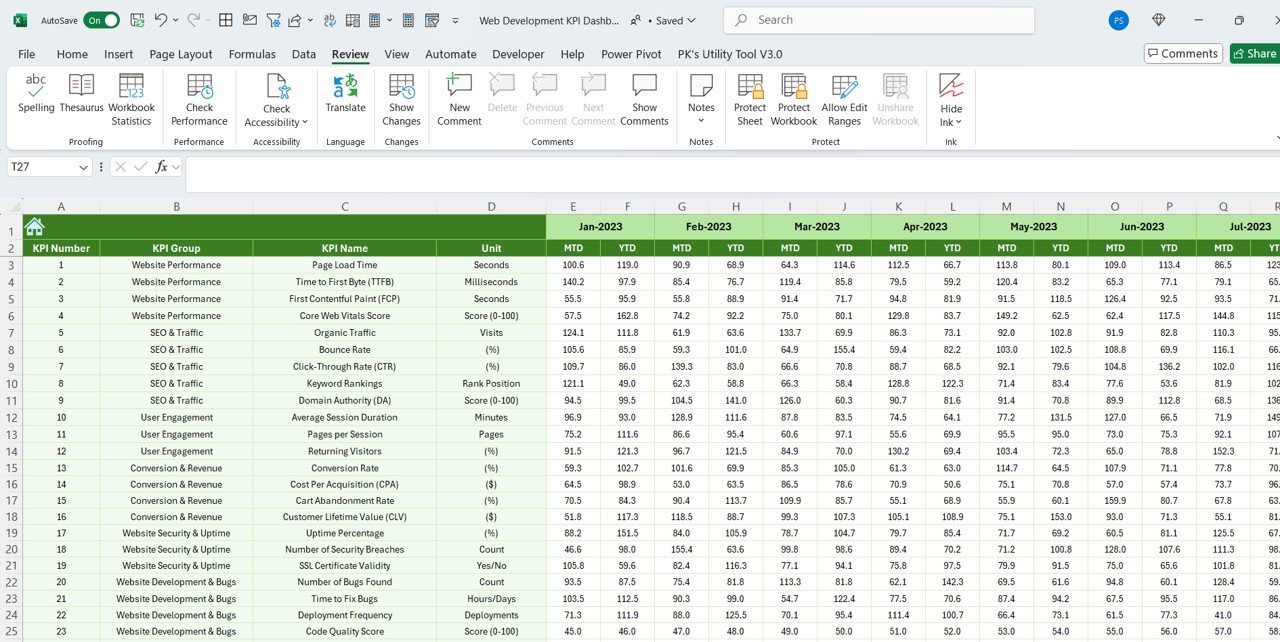
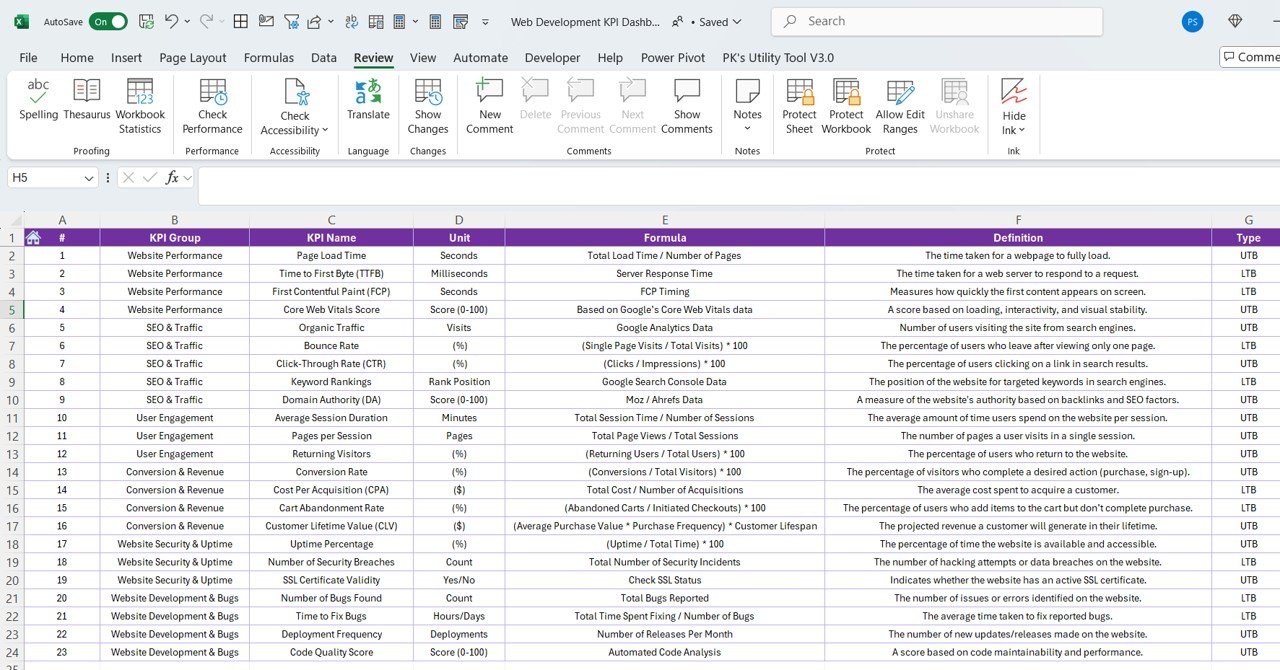

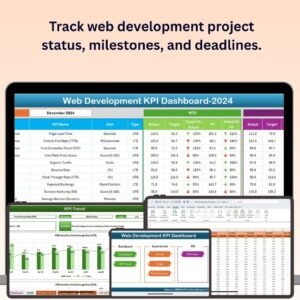
The Web Development KPI Dashboard in Excel is a comprehensive tool designed to help web development teams and project managers track key performance indicators (KPIs) that are essential for the success of web development projects. This Excel-based dashboard enables you to monitor project progress, assess team productivity, track web performance, and ensure that development timelines and quality standards are met.
With real-time tracking, customizable charts, and an intuitive design, this dashboard helps streamline your web development process by providing valuable insights into project performance, team efficiency, and website metrics, ultimately ensuring a successful project delivery.
Key Features of the Web Development KPI Dashboard in Excel:
🖥️ Project Progress Tracking
Monitor the status of ongoing web development projects, from initial planning to deployment, ensuring that tasks are completed on time and in scope.
💼 Team Productivity Metrics
Track developer productivity, including task completion rates, hours worked, and resource allocation, helping you identify top performers and areas for improvement.
📈 Website Performance Metrics
Track important website performance metrics such as page load time, uptime, and user engagement, ensuring your website meets user expectations and technical standards.
⏱️ Development Milestones Monitoring
Track milestones and deadlines throughout the development lifecycle, ensuring that your team meets key deadlines and delivers the project on time.
💻 Bug and Issue Tracking
Monitor the status of bugs and issues reported during development, ensuring that problems are addressed promptly and don’t affect the final product.
🚀 Why You’ll Love the Web Development KPI Dashboard in Excel:
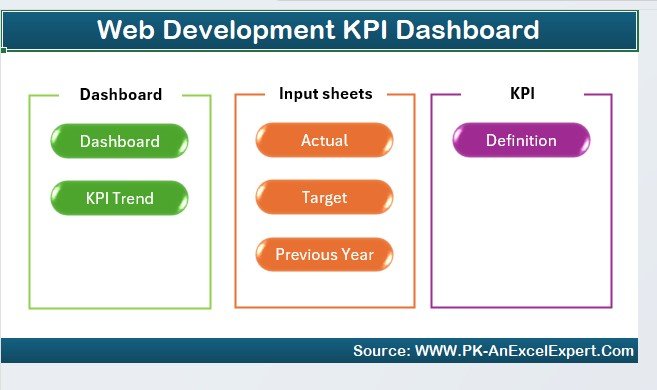
✅ Track Project Progress – Monitor each stage of your web development project to ensure its progressing as planned and deadlines are being met.
✅ Enhance Team Productivity – Track individual developer performance, task completion rates, and resource allocation to identify bottlenecks and optimize team performance.
✅ Measure Website Performance – Track critical web performance metrics to ensure that your site is fast, reliable, and user-friendly.
✅ Keep Development on Track – Stay on top of milestones, deadlines, and tasks to ensure that your development process is efficient and on schedule.
✅ Improve Issue Resolution – Track and resolve bugs and technical issues quickly to minimize disruptions to the development process and improve product quality.
✅ Customizable and Easy-to-Use – The dashboard is fully customizable to fit your team’s specific KPIs and project needs and is easy to use, even for those without technical expertise.
What’s Inside the Web Development KPI Dashboard in Excel:
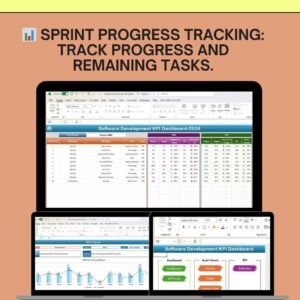
Project Progress Tracker: Track the status of each project phase, including planning, development, testing, and deployment.
Team Productivity Metrics: Monitor team performance by tracking task completion rates, hours worked, and resource allocation for each developer.
Website Performance Tracking: Track important website metrics such as load time, uptime, user engagement, and other performance factors.
Development Milestones and Deadlines: Monitor key development milestones and ensure that they are met on time, keeping your project on schedule.
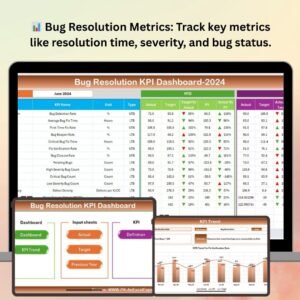
Bug and Issue Tracker: Track bugs and issues raised during development, ensuring they are resolved promptly to avoid delays.
Custom Reports: Generate tailored reports summarizing project status, team productivity, website performance, and more to present to stakeholders.
How to Use the Web Development KPI Dashboard in Excel:
1️⃣ Download the Template – Instantly access your Excel file upon purchase.
2️⃣ Enter Project and Team Data – Input project details, team members, and tasks to start tracking your web development KPIs.
3️⃣ Monitor Project and Team Metrics – Track project progress, milestones, team productivity, and web performance metrics in real-time.
4️⃣ Track Bugs and Issues – Record and monitor bugs and issues throughout development, ensuring quick resolutions.
5️⃣ Generate Reports – Create customized reports to share with management, stakeholders, and team members, summarizing key performance data.
Who Can Benefit from the Web Development KPI Dashboard in Excel:
Web Developers
Project Managers
Development Teams
Product Managers
IT and Technical Leads
Web Development Agencies
Small to Medium-Sized Businesses (SMBs)
Large Enterprises with Web Development Teams
The Web Development KPI Dashboard in Excel is the ultimate tool for web development teams looking to streamline their processes, monitor key metrics, and deliver successful web projects. By tracking project progress, team productivity, and website performance, this dashboard helps you ensure that your web development process is efficient, effective, and aligned with business goals.
Click here to read the Detailed blog post
https://www.pk-anexcelexpert.com/web-development-kpi-dashboard-in-excel/
Visit our YouTube channel to learn step-by-step video tutorials
Youtube.com/@PKAnExcelExpert
Compatibility and Requirements
- Works in Microsoft Excel desktop (Excel 2016 or later, or Microsoft 365).
- Results are shown in charts. Microsoft explains Excel charts in Create a chart from start to finish.
Frequently Asked Questions
What does the Web Development KPI Dashboard track?
It tracks project progress by phase, team productivity, website performance, development milestones and deadlines, and bugs and issues.
Which website metrics can I record?
You can record load time, uptime, user engagement and other performance factors.
Can I track bugs?
Yes. You can record bugs and issues raised during development and monitor them until they are resolved.
Is there a Google Sheets or Power BI version?
Yes. The Web Development KPI Dashboard in Google Sheets and the Power BI edition track the same KPIs.
Related Web Development Templates
- Web Development KPI Dashboard in Google Sheets: the same dashboard in Google Sheets
- Web Development KPI Dashboard in Power BI: the same dashboard in Power BI
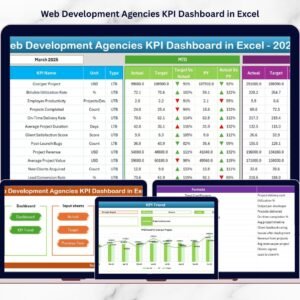
- Web Development Agencies KPI Dashboard in Excel: KPIs for web development agencies
- Website Traffic KPI Dashboard in Excel: track website traffic in Excel
- IT and Cybersecurity Operations Bundle: 8 IT and cybersecurity templates in one download
Browse all Excel KPI dashboards or the Excel IT templates.






















Reviews
There are no reviews yet.