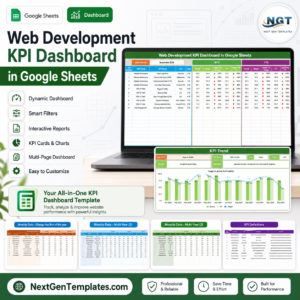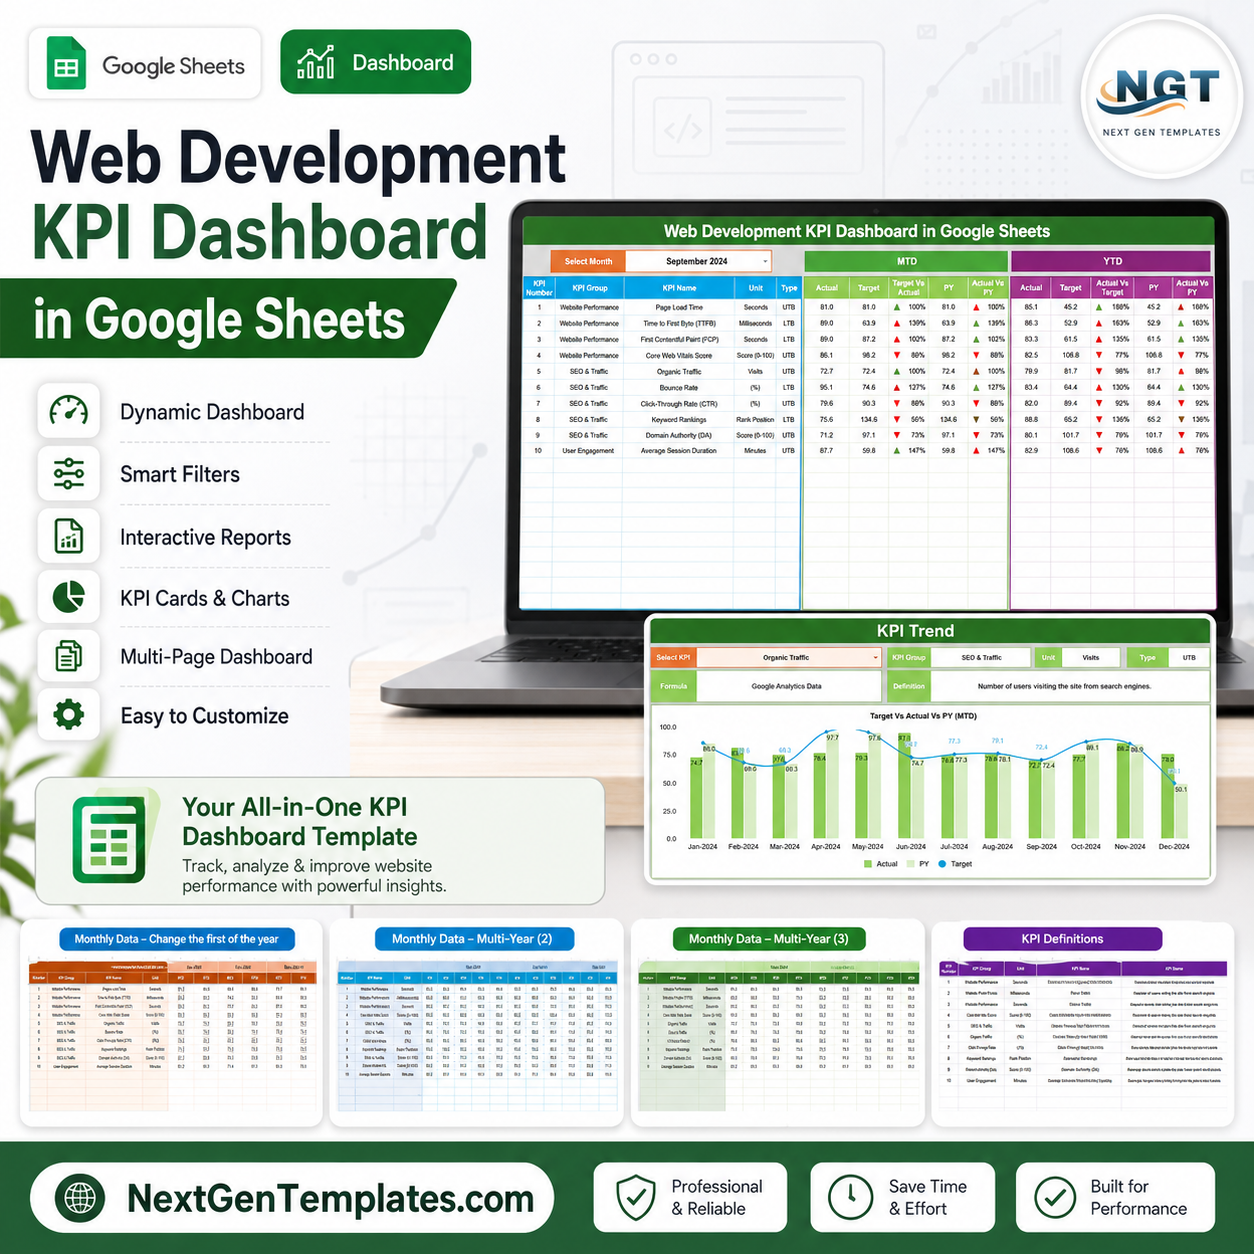
The Web Development KPI Dashboard in Google Sheets gives web teams 10 headline KPI cards, 6 working sheet tabs, 8 overview comparison charts and month-based slicers for current-year, target and previous-year tracking. It focuses on the website numbers that decide whether visitors wait, click, rank and stay: Page Load Time, TTFB, FCP, Core Web Vitals Score, Organic Traffic, Bounce Rate, CTR, Keyword Rankings, Domain Authority and Average Session Duration. Built by PK, a Microsoft Certified Professional with 15+ years of spreadsheet and BI experience and 300K+ subscribers across YouTube channels, this template is an editable Google Sheets reporting system for a one-time $8.99 sale price with no monthly dashboard subscription.
Key Features of Web Development KPI Dashboard in Google Sheets
- 10 web performance KPI cards for page speed, search visibility, engagement and authority metrics.
- MTD and YTD reporting across actual, target and previous-year values.
- Eight overview charts to compare MTD and YTD performance by KPI name.
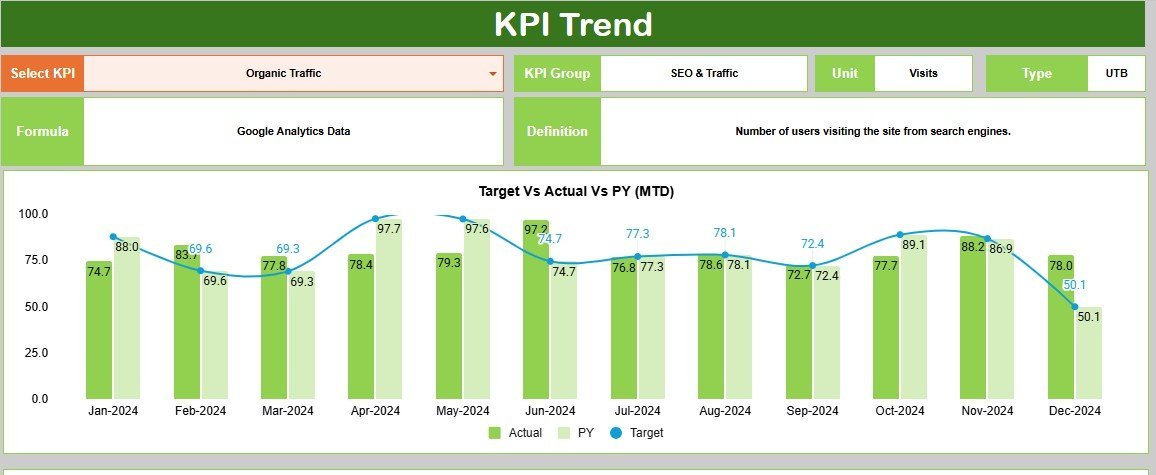
- KPI Trend tab to select one KPI and review actual, target and previous-year movement by month.
- Current Year, Target and Previous Year data tabs for clean monthly input and comparison.
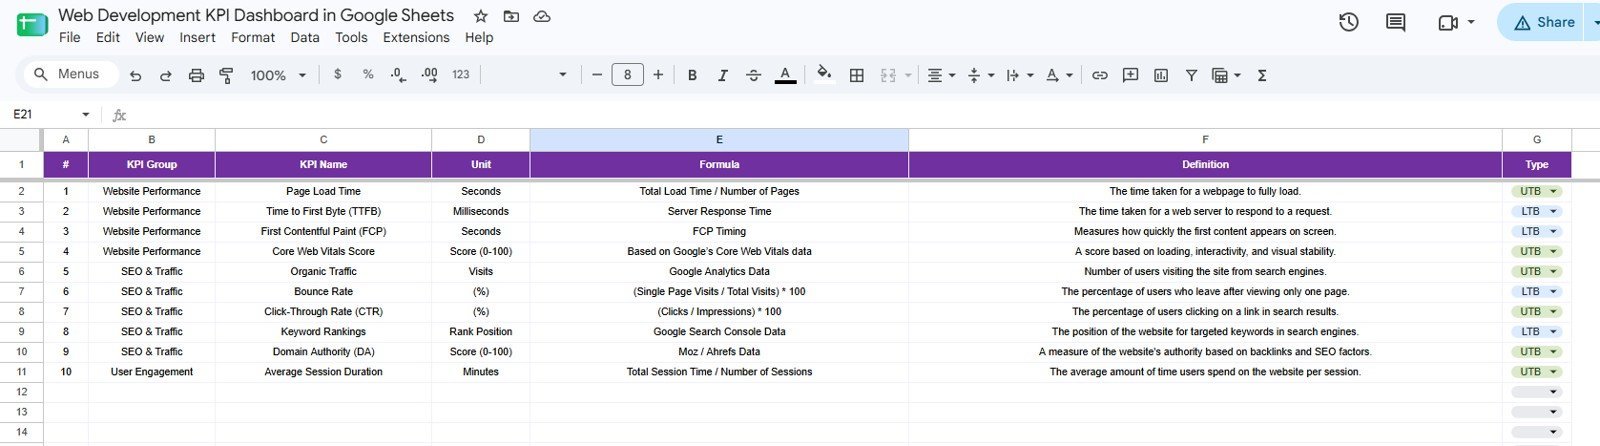
- KPI Setup tab for KPI group, KPI name, unit, formula, definition and KPI type.
- Google Sheets collaboration so your web, SEO, content and analytics team can work from one shared file.
- Editable structure for adding your own metrics, changing targets or adjusting KPI definitions.
What’s Inside the Web Development KPI Dashboard in Google Sheets
1 – Overview Page
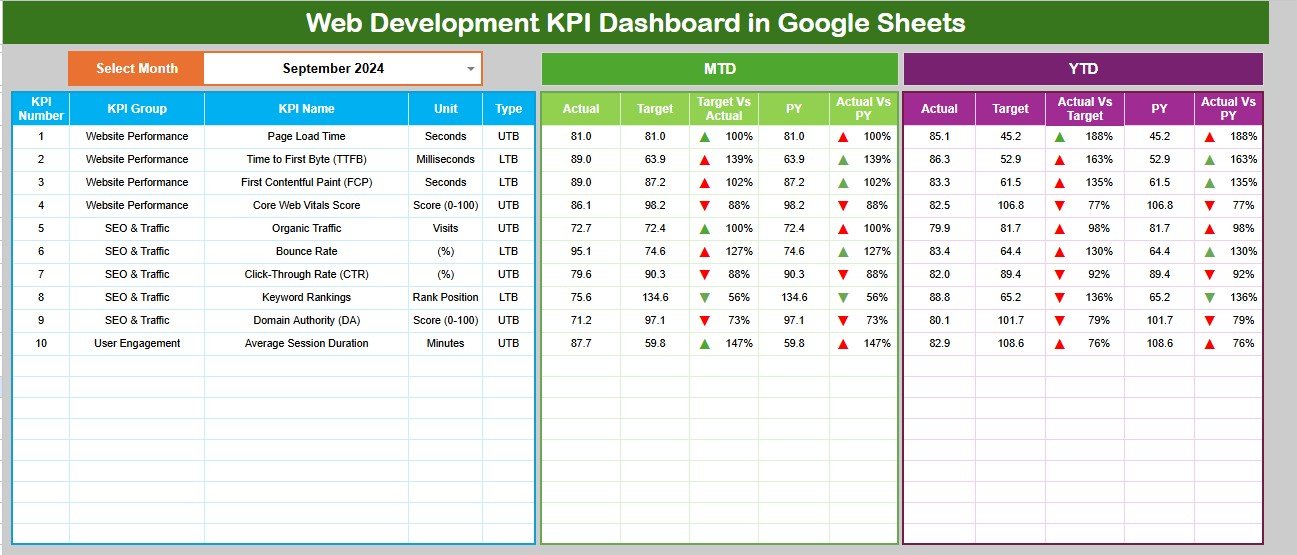
The Overview page is the executive view. It displays Page Load Time, TTFB, FCP, Core Web Vitals Score, Organic Traffic, Bounce Rate, CTR, Keyword Rankings, Domain Authority and Average Session Duration as high-level cards, with slicers for fast filtering.
The chart area compares MTD Actual, MTD Target, MTD Target vs Actual, MTD Actual vs PY, YTD Actual, YTD Target, YTD Actual vs Target and YTD Actual vs PY by KPI name.
2 – KPI Trend
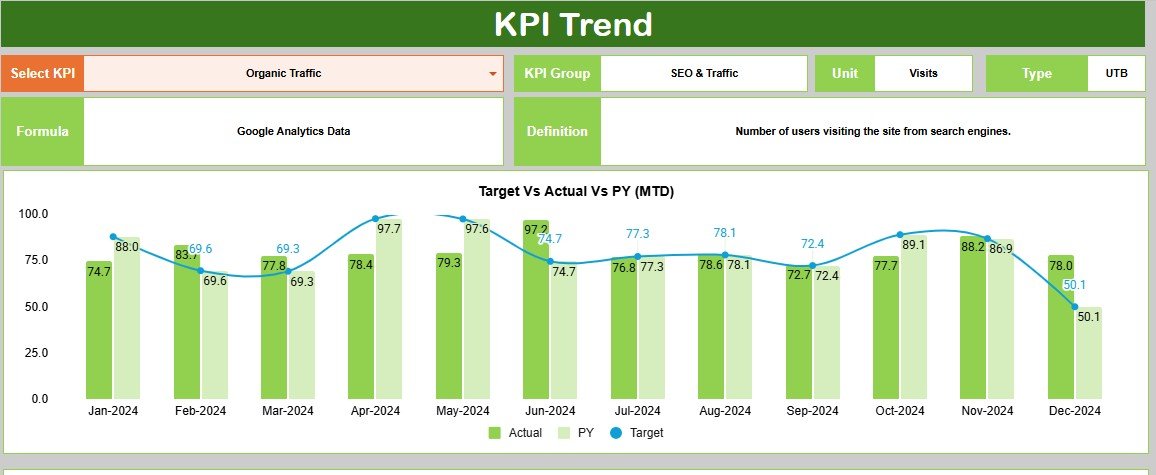
The KPI Trend tab is for deeper analysis of one selected KPI. It shows Target vs Actual vs PY by Month, Actual by Month, PY by Month, Target by Month, Formula by Selected KPI and Definition by Selected KPI.
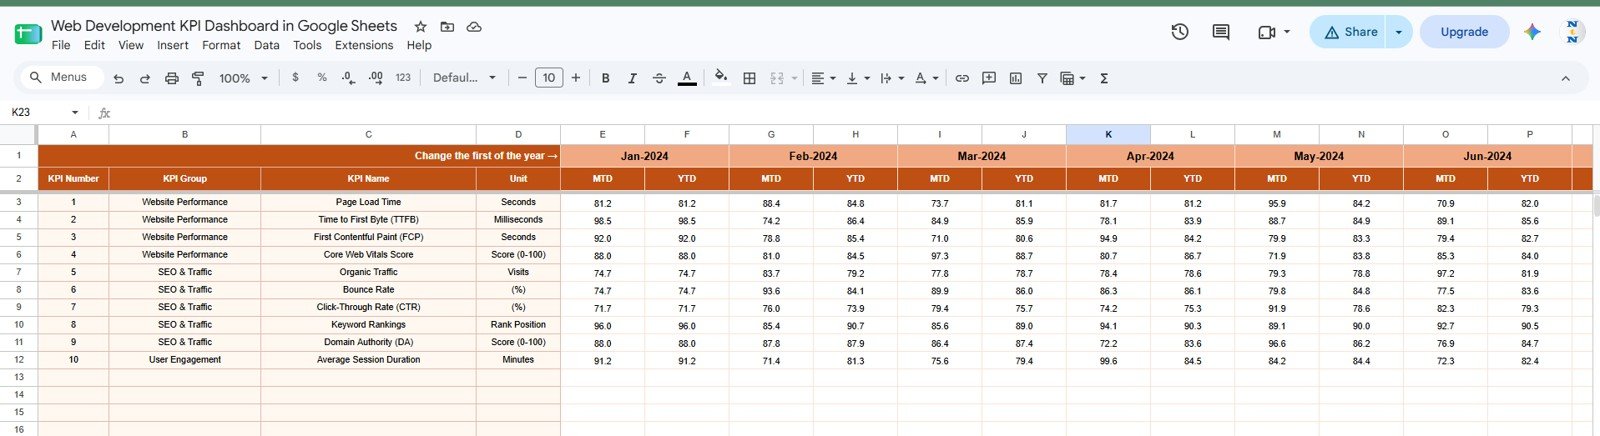
3 – Current Year Data
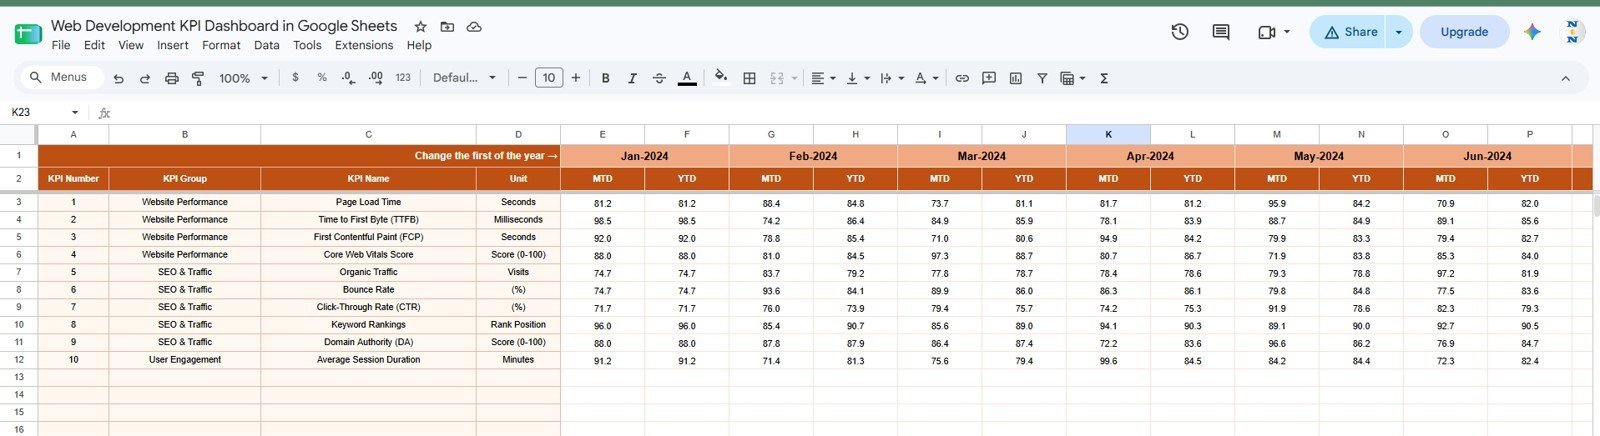
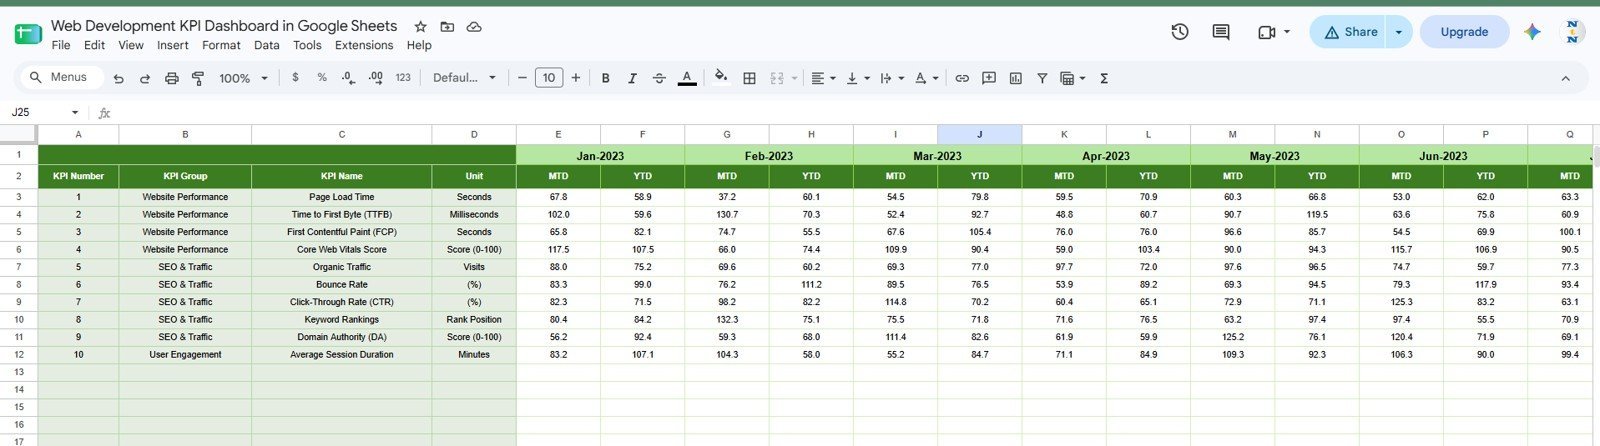
The Current Year Data tab stores the actual monthly performance values. It includes MTD Actual by KPI Name and Month, YTD Actual by KPI Name and Month, Actual Performance by KPI Group and Unit by KPI Name.
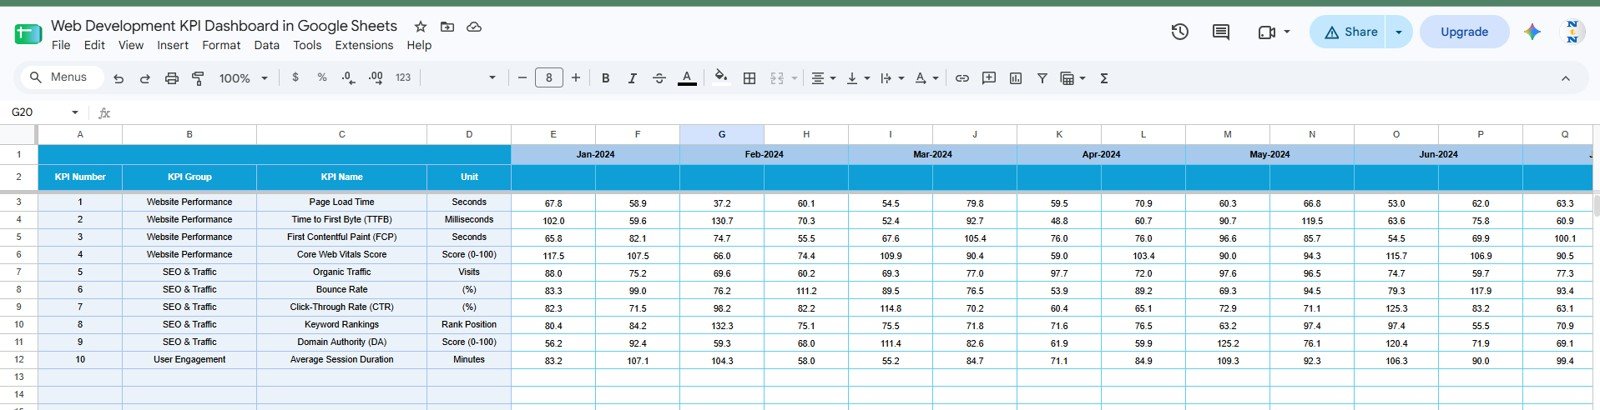
4 – Target Data
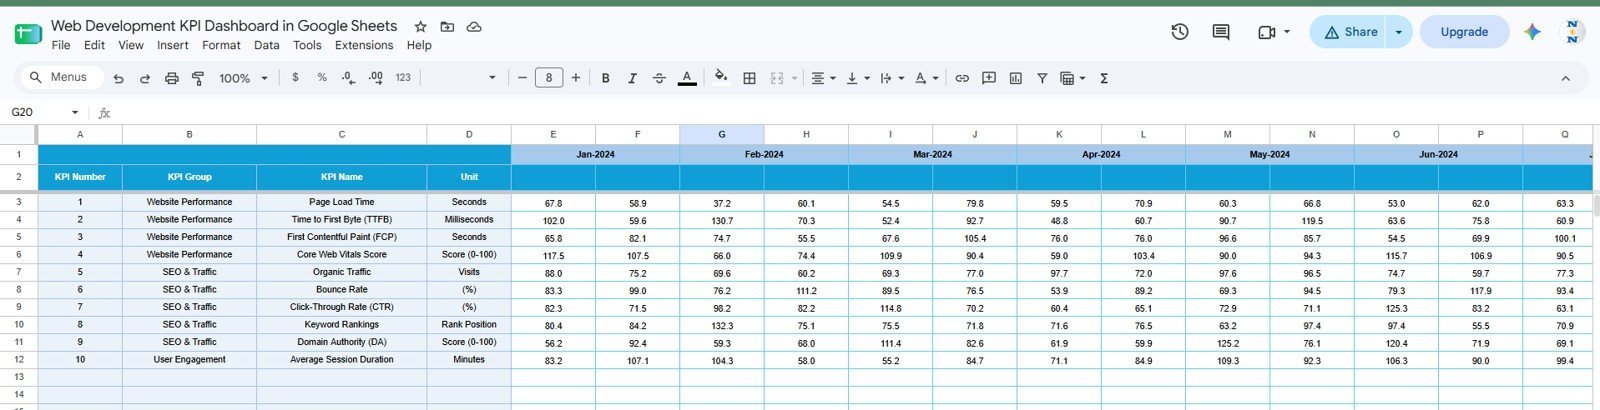
The Target Data tab holds the monthly goals your team wants to hit. It includes Target Value by KPI Name and Month, Monthly Target by KPI Group, Target Baseline by KPI Name and Unit by KPI Name.
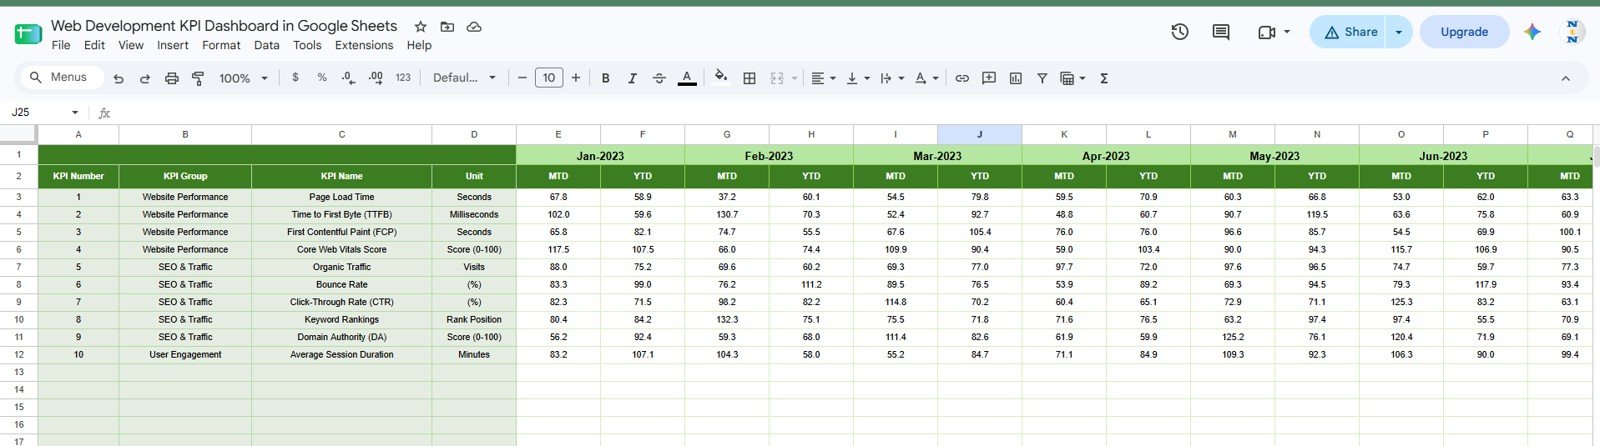
5 – Previous Year Data
The Previous Year Data tab lets you compare the current year with last year’s baseline. It includes Previous Year MTD by KPI Name and Month, Previous Year YTD by KPI Name and Month, Previous Year Performance by KPI Group and Unit by KPI Name.
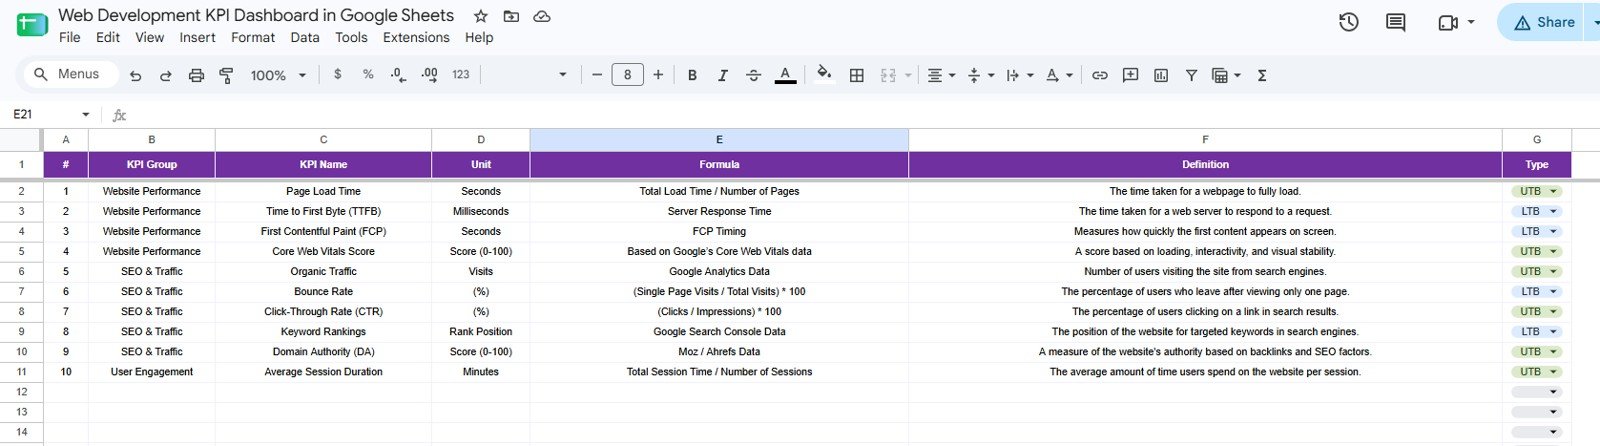
6 – KPI Setup Sheet Tab
The KPI Setup Sheet tab is where you maintain the KPI group, KPI name, unit, formula, definition and KPI type in one consistent structure.
Web Development KPI Dashboard in Google Sheets vs. Microsoft Excel Dashboard vs. Paid CRM/SaaS – Where This Fits
| Feature | This Google Sheets dashboard | Microsoft Excel dashboard | Paid web analytics SaaS |
|---|---|---|---|
| Cost | $8.99 sale price, one-time | Template cost plus Microsoft access | Usually monthly or annual |
| Platform | Google Sheets in browser | Excel desktop or web | Vendor-hosted app |
| Setup time | Copy file, update KPIs and monthly values | Open file and maintain locally | Account setup, tracking and configuration |
| Real-time collaboration | Native Google Drive sharing | Requires OneDrive or SharePoint | Usually included by seat |
| Custom KPI formulas | Editable KPI Setup tab | Editable workbook | Limited by vendor metric model |
| Share with link | Yes | Yes, if stored in Microsoft cloud | Usually login controlled |
| Year-1 cost at 5 users | $8.99 before any Google Workspace cost | Template plus license costs | Often hundreds or thousands |
| Best fit | Monthly KPI reviews and web performance tracking | Offline spreadsheet reporting | Live analytics, alerts and automated data pipelines |
Who This Template Is For – and Who It’s Not For
This template is for web developers, SEO teams, digital marketing managers, site owners, content teams, technical SEO consultants and small agencies that want a clear monthly KPI review in Google Sheets. It is especially useful when you already collect website data from Google Analytics, Search Console, PageSpeed Insights or your SEO tools and need a shared reporting layer.
It is not a live crawler, page-speed testing engine, CRM, analytics connector or ranking tracker. You still need to enter or paste the KPI values. If you need automated real-time monitoring, alerts, A/B testing or crawl diagnostics, use this dashboard as a reporting companion rather than a replacement.
How to Use the Web Development KPI Dashboard in Google Sheets
- Open the PDF guide from your download and copy the Google Sheets template into your own Drive.
- Review the KPI Setup Sheet tab and adjust groups, formulas, units and definitions if needed.
- Enter actual monthly values in the Current Year Data tab.
- Enter monthly targets in the Target Data tab.
- Add previous-year values to unlock year-over-year comparison.
- Open the Overview page and use slicers to review MTD and YTD performance.
- Use KPI Trend when you need a single-metric review before a sprint, SEO or leadership meeting.
Real-World Use Cases
Maya, technical SEO consultant: reviews Core Web Vitals Score, FCP, TTFB and Page Load Time every month for client reporting.
Arjun, web agency owner: uses CTR, rankings, bounce rate and organic traffic to connect technical changes with business outcomes.
Priya, content manager: filters the dashboard before editorial reviews to see whether traffic gains are producing stronger engagement.
Frequently Asked Questions
What KPIs are included?
The dashboard includes Page Load Time, Time to First Byte, First Contentful Paint, Core Web Vitals Score, Organic Traffic, Bounce Rate, CTR, Keyword Rankings, Domain Authority and Average Session Duration.
Does it connect automatically to Google Analytics or Search Console?
No. It is a Google Sheets dashboard template for structured KPI entry and reporting. You can paste exports or extend it with your own connector workflow.
Can I change the KPIs?
Yes. The KPI Setup Sheet tab is built for maintaining KPI group, name, unit, formula, definition and KPI type.
Can multiple users work in it?
Yes. After copying it to Google Drive, you can share it with view or edit permissions like any other Google Sheets file.
What do I receive after purchase?
For Google Sheets products, the download is normally a PDF guide with the Make a copy link and setup notes.
Does this replace paid SEO software?
No. Paid SEO platforms collect and refresh data. This template organizes the monthly KPI results so reviews, targets and year-over-year comparisons are easier to read.
About the Author
Built by PK – Microsoft Certified Professional with 15+ years of Excel, Google Sheets, and Power BI experience. Founder of NextGenTemplates, reaching 300K+ subscribers across YouTube channels. Every template is hand-built and tested before release.
Explore Related Templates
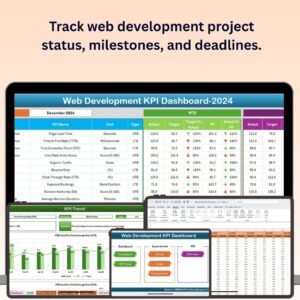
- Web Development KPI Dashboard in Excel for teams that prefer Microsoft Excel.
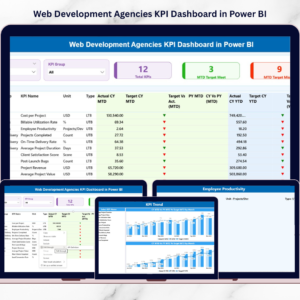
- Web Development Agencies KPI Dashboard in Power BI for agency-level reporting.
- Software Development KPI Dashboard in Google Sheets for sprint and delivery metrics.
- Digital Marketing Campaign Dashboard in Google Sheets for campaign reporting.
- Browse more Google Sheets templates and Google Sheets KPI dashboard templates.
Get the Web Development KPI Dashboard in Google Sheets to track page speed, Core Web Vitals, traffic, engagement, search visibility and monthly targets in one editable dashboard.
Watch the step-by-step video Demo:
Last updated: 15 August 2026.