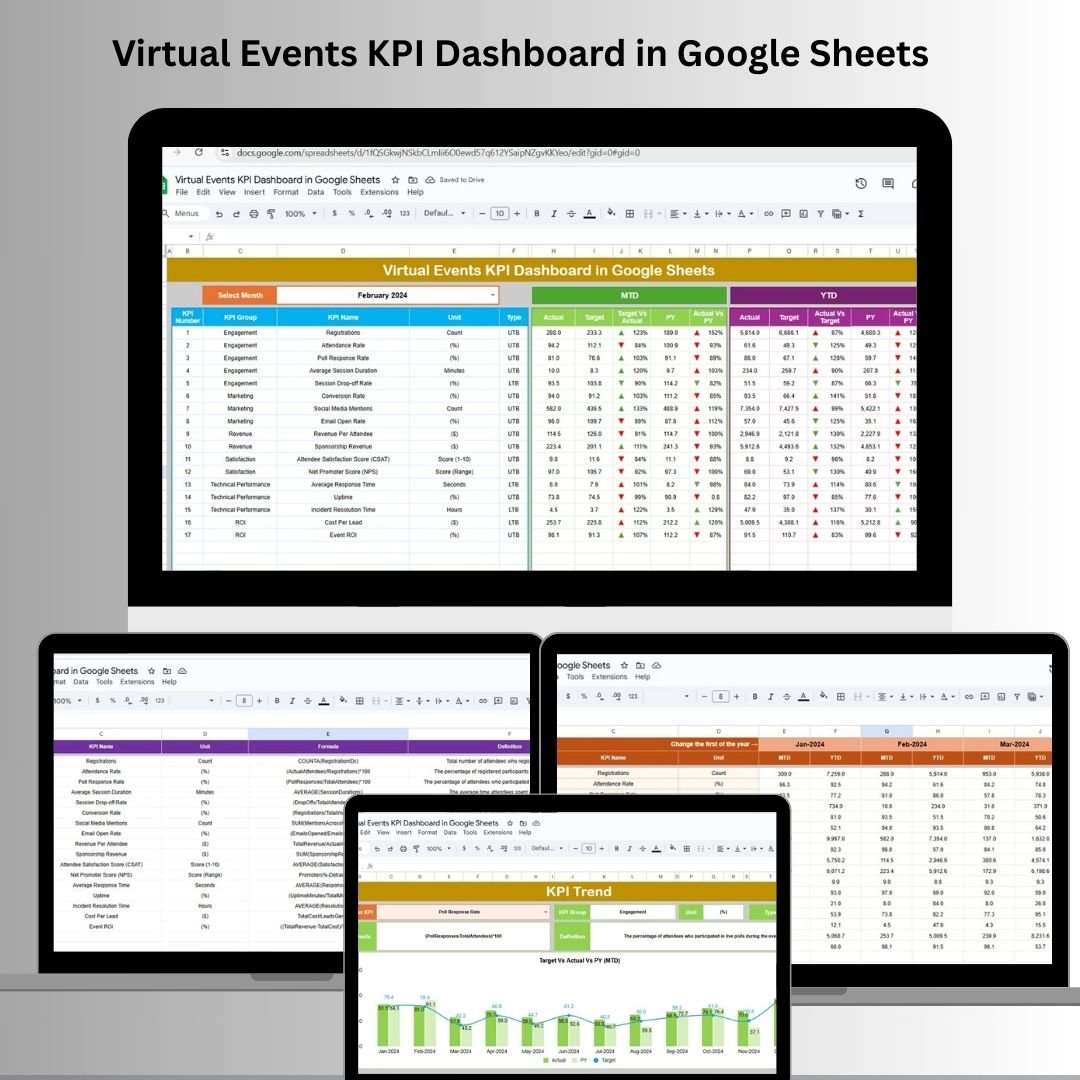

The Virtual Events KPI Dashboard in Google Sheets is an all-in-one solution for managing and optimizing your virtual events. Designed to track crucial KPIs and provide actionable insights, this dashboard allows event organizers to monitor their event performance in real time. Whether it’s a webinar, online conference, or virtual networking event, this tool ensures that your virtual events are effectively managed and optimized.
-
Centralized Tracking: All your event KPIs in one place, allowing you to see how your events are performing at a glance.
-
Real-Time Data: Automatically updates as you input new data, so you always have up-to-date metrics at your fingertips.
-
Customizable: Easily adapt the dashboard to track the KPIs most relevant to your specific event.
-
Historical Data Comparison: Easily compare current performance with previous years’ data to track progress and identify trends.
-
Collaborative: As it’s built in Google Sheets, your entire team can collaborate and stay aligned on the event’s performance.
What’s Inside the Virtual Events KPI Dashboard
The Virtual Events KPI Dashboard comes with six specialized worksheets, each designed to handle key aspects of your event’s performance tracking:
-
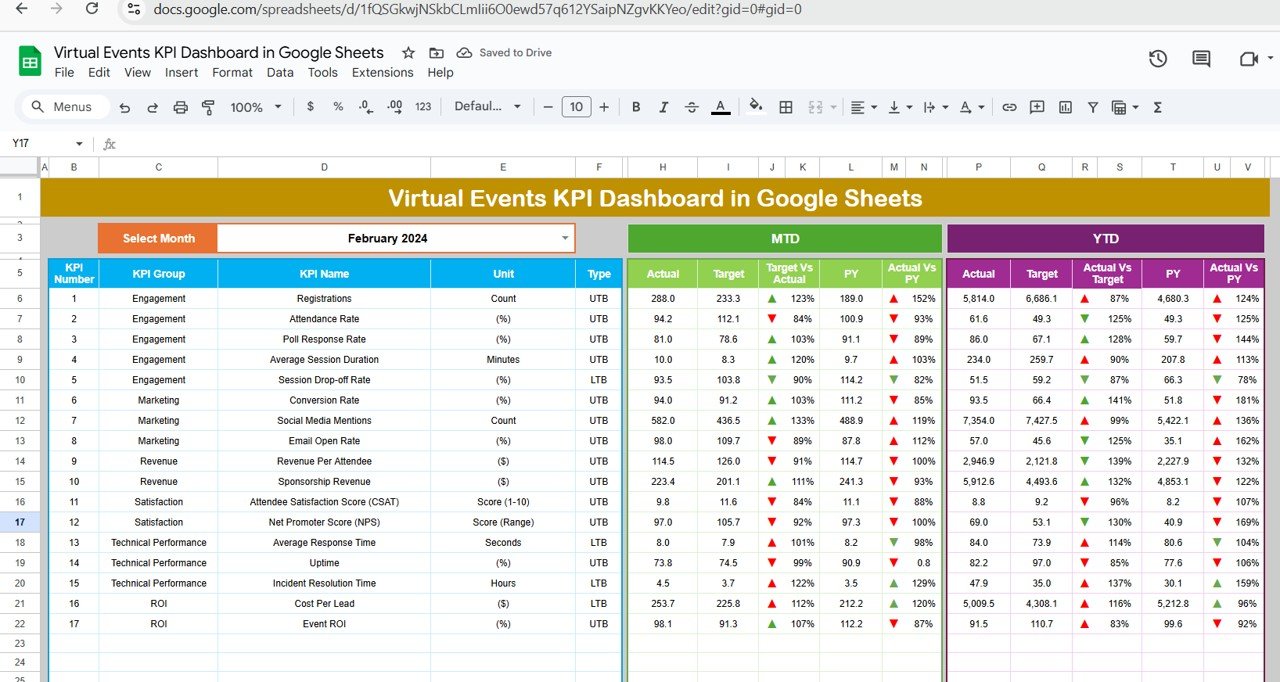
Dashboard Sheet Tab: The central hub where all key metrics are displayed. Track MTD (Month-to-Date), YTD (Year-to-Date), and compare current performance with previous years’ metrics.
-
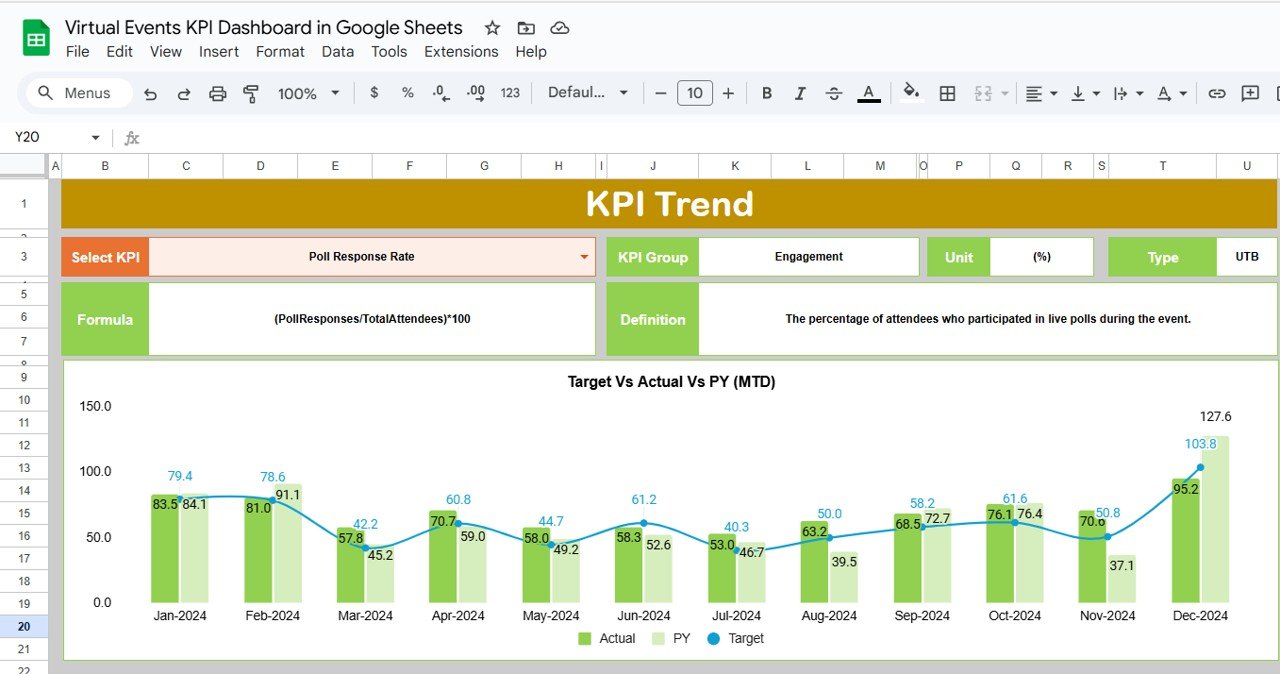
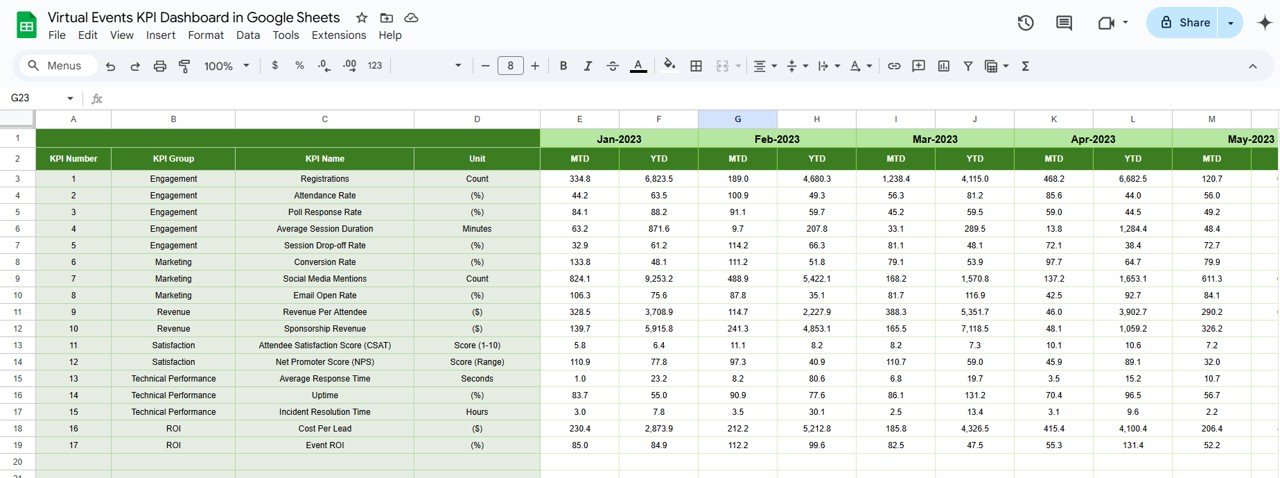
KPI Trend Sheet Tab: Visualizes the trends for each KPI over time, allowing you to assess how your events are performing across different periods.
-
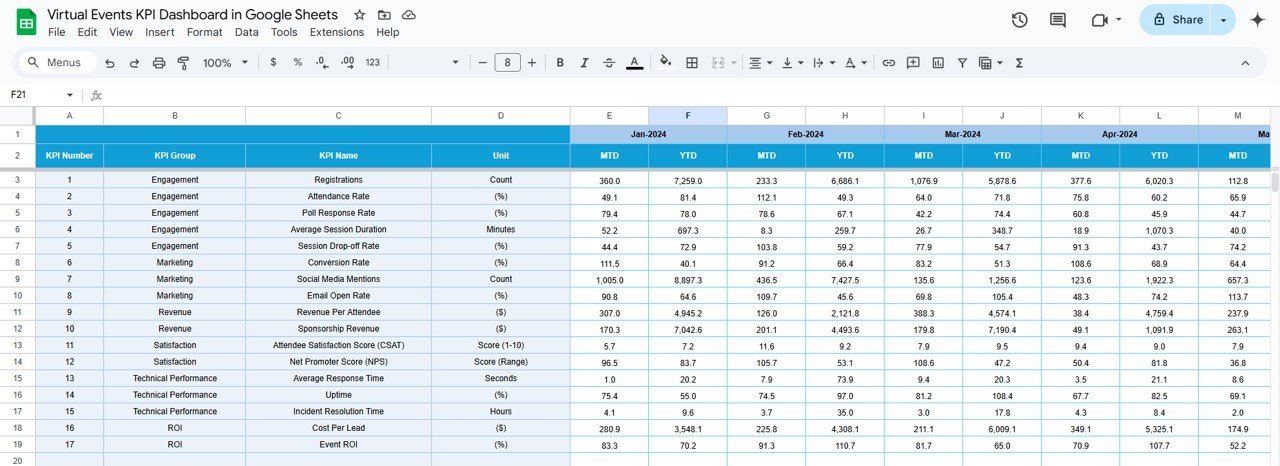
Actual Number Sheet Tab: Input actual performance data for each KPI, updating the dashboard automatically with your latest results.
-
Target Sheet Tab: Enter your KPIs’ target values for MTD and YTD, and measure progress against set goals.
-
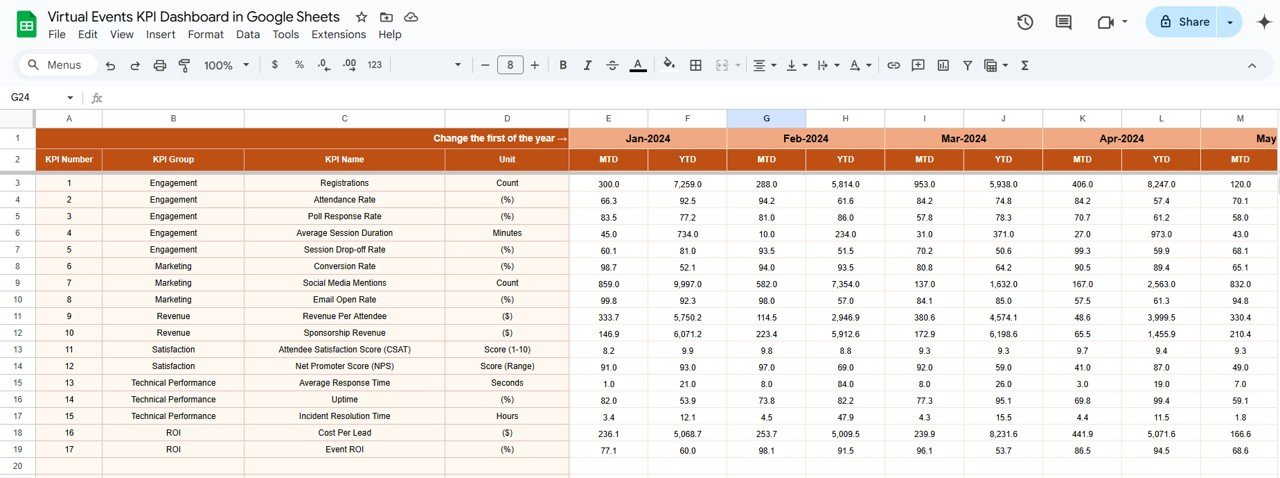
Previous Year Number Sheet Tab: Compares historical performance data against the current year’s results to measure growth or areas of improvement.
-
KPI Definition Sheet Tab: Provides detailed definitions, units, formulas, and the classification of KPIs (Lower the Better or Upper the Better).
How to Use the Virtual Events KPI Dashboard
Using the Virtual Events KPI Dashboard is simple and intuitive. Once you download the template, follow these easy steps to start tracking your event KPIs:
-
Input Your Data: Begin by entering the actual performance data for your virtual event, including metrics such as attendance, engagement rates, and satisfaction scores.
-
Set Your Targets: Define your target goals for each KPI in the Target Sheet Tab to assess how well you’re meeting your event objectives.
-
Monitor Progress: Use the Dashboard Sheet Tab to track the performance of your virtual events. Select the month you’re interested in, and the dashboard will display MTD and YTD data with real-time comparisons.
-
Collaborate with Your Team: Share the dashboard with team members to collaborate on tracking and improving your virtual events.
Who Can Benefit from This Virtual Events KPI Dashboard
This Virtual Events KPI Dashboard is perfect for event planners, marketers, and organizers looking to enhance their event performance. Here’s who will find it beneficial:
-
Event Planners: Track key metrics to measure engagement, attendance, and overall event success.
-
Marketing Teams: Measure campaign performance and make data-driven decisions to improve future event marketing strategies.
-
Organizers: Stay on top of multiple virtual events and assess the impact of various KPIs to improve event outcomes.
-
Data Analysts: Utilize the dashboard’s real-time data to analyze trends and gain insights into event effectiveness.
Click here to read the Detailed blog post
Watch the step-by-step video Demo:


Reviews
There are no reviews yet.