


In today’s fast-paced agricultural environment, relying on scattered spreadsheets or guesswork can hurt your profits and productivity. That’s why we’ve created the Agribusiness KPI Dashboard in Google Sheets — a powerful, ready-to-use tool designed to help agribusinesses track, monitor, and improve key performance indicators (KPIs) in real-time. 📈✅
Whether you’re growing crops, managing a farm, or running a full-scale agribusiness, this dashboard gives you clear, visual insights into your operations — all in Google Sheets!
✨ Key Features of Agribusiness KPI Dashboard
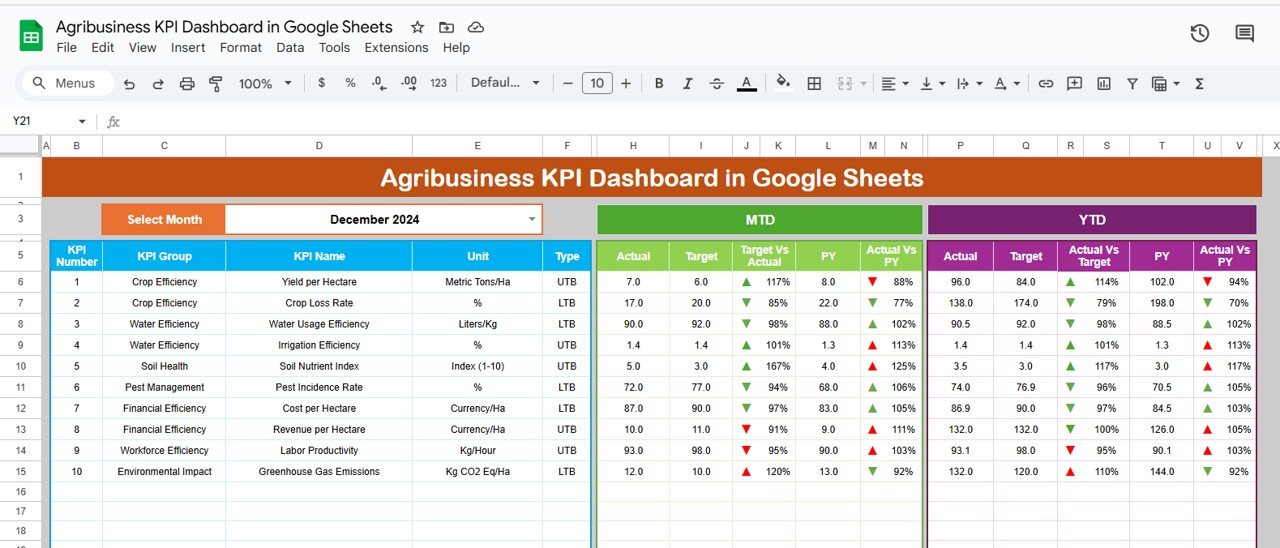
📊 Dashboard Sheet Tab
Get a visual summary of your most important KPIs — from production to profitability. Track Month-to-Date (MTD) and Year-to-Date (YTD) metrics, with arrows showing if you’re above or below target.
🔹 MTD Actual vs Target
🔹 PY vs Current Comparison
🔹 Conditional formatting highlights performance trends at a glance
📈 KPI Trend Sheet Tab
Select any KPI and see how it’s performed over time. Perfect for tracking seasonal shifts or year-over-year improvements.
🔹 Dropdown to select KPI
🔹 Displays unit, formula, type (UTB/LTB), and definition
🔹 Trend charts make patterns easy to spot
📥 Actual Number Sheet Tab
Enter your monthly performance data for each KPI. This feeds the entire dashboard and keeps it updated in real time.
🎯 Target Sheet Tab
Input your performance goals for each KPI. Compare your actual results against clear benchmarks.
📆 Previous Year Number Sheet Tab
Add last year’s performance metrics and instantly compare progress. Great for understanding trends and growth.
📘 KPI Definition Sheet Tab
Define each KPI clearly to maintain alignment across your team. Includes KPI group, formula, unit, and full definition.
📂 What’s Inside the Product
You’ll get access to 6 pre-built, interlinked Google Sheets tabs:
-
Dashboard Sheet – Your KPI control center
-
KPI Trend Sheet – Historical KPI tracking
-
Actual Number Sheet – Real-time data entry
-
Target Sheet – Input targets for each KPI
-
Previous Year Number Sheet – YoY comparison
-
KPI Definition Sheet – Full KPI glossary
Each tab is automated and visually optimized for easy navigation and performance insights. No need for coding or formulas — everything works out of the box. 💡
🛠️ How to Use the Product
-
Start with the Actual Number Sheet – Enter your current month’s performance data
-
Input targets in the Target Sheet
-
Add previous year’s numbers for comparison
-
Let the Dashboard Sheet auto-populate with MTD, YTD, and PY performance
-
Use the KPI Trend Sheet to analyze changes over time
-
Refer to the KPI Definition Sheet for clarity and alignment across teams
No technical skills required. Just input your data and start making smarter decisions. 💼✅
👩🌾 Who Can Benefit from This Dashboard?
🌽 Farm Owners & Managers – Track productivity, revenue, and inputs
🧑💼 Agribusiness Executives – Analyze trends and optimize strategy
🌿 Sustainability Teams – Monitor environmental KPIs
📉 Finance & Ops Teams – Improve cost management and budgeting
🌾 Crop Consultants & Agronomists – Present data-driven insights
📊 Agri Startups & Tech Providers – Showcase real-time performance with visual reports


Reviews
There are no reviews yet.