


 Top Features:
 Vendor Filters – Filter by name, location, category
 Fully Customizable – Tailor it to your KPIs
 Includes Support Sheet – For slicers and dropdowns
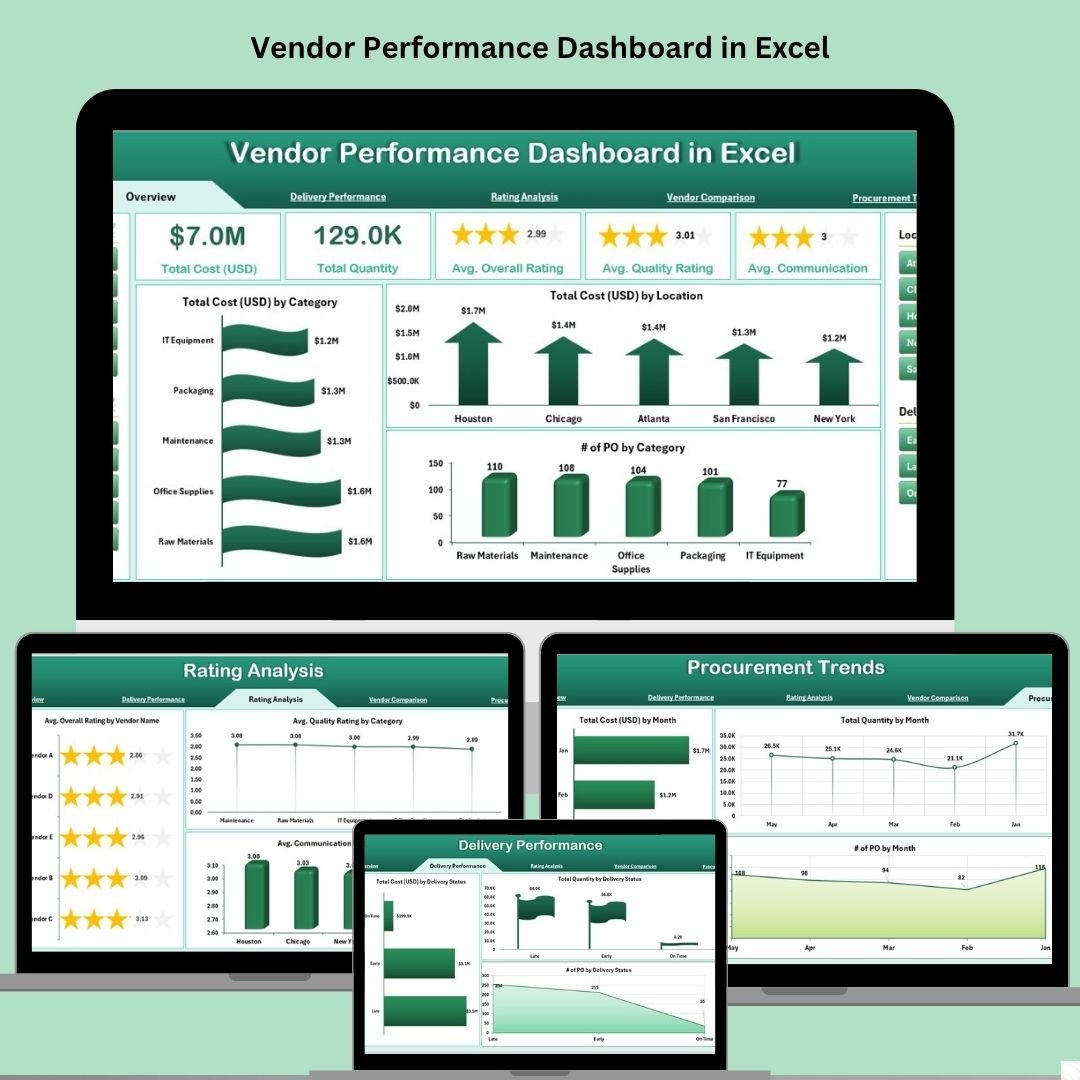
This ready-to-use Excel template is packed with powerful visuals, slicers, and advanced analytics — no coding or external tools required. From cost breakdowns and delivery performance to rating trends and vendor comparisons, this dashboard gives you the complete picture in one place.
 Key Features of Vendor Performance Dashboard
 Interactive Page Navigator
Jump between 5 performance views instantly using the built-in menu.
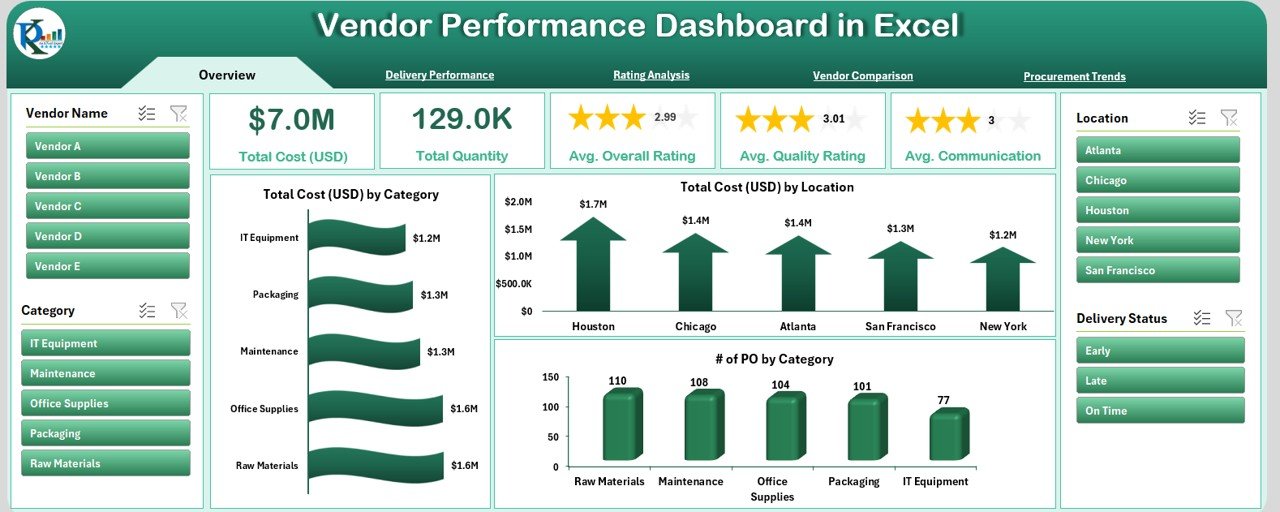
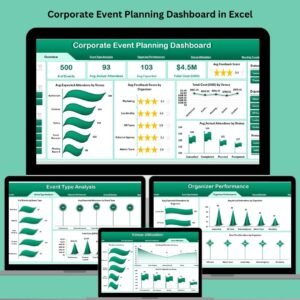
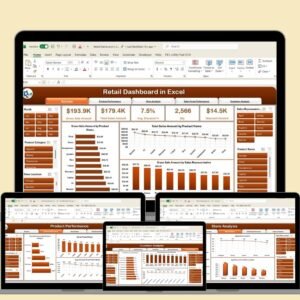
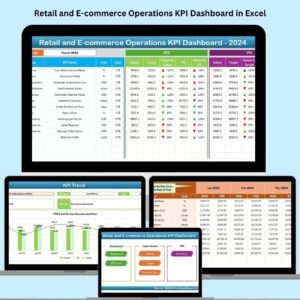
 Overview Page
-
5 summary cards (e.g., Total Orders, Vendors)
-
Charts for cost by category and location
-
Purchase order trends at a glance
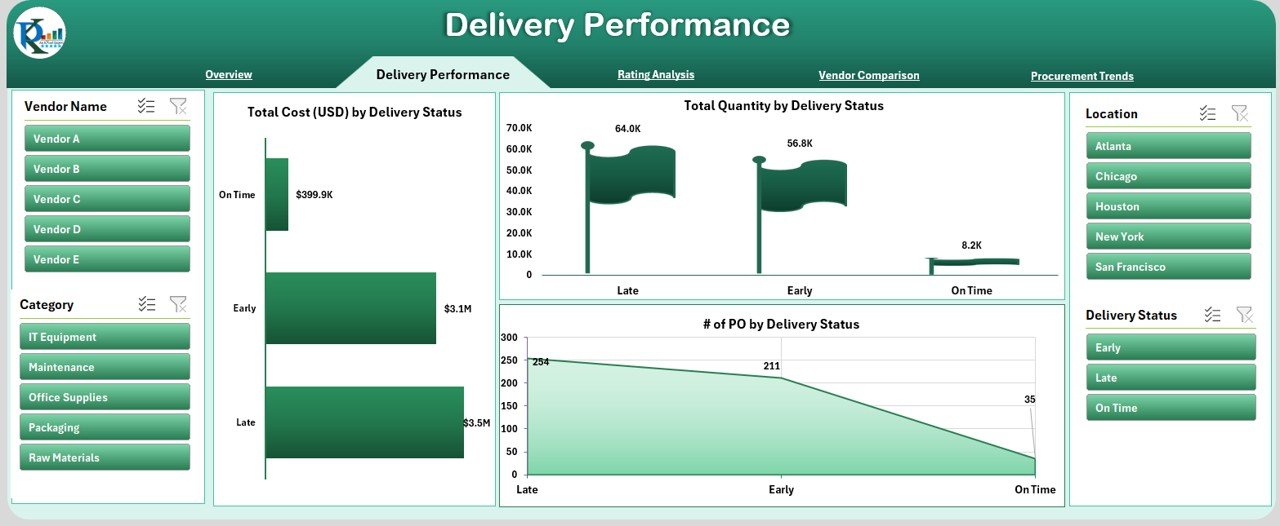
 Delivery Performance Page
-
See cost, quantity, and POs by delivery status
-
Quickly identify late or incomplete deliveries
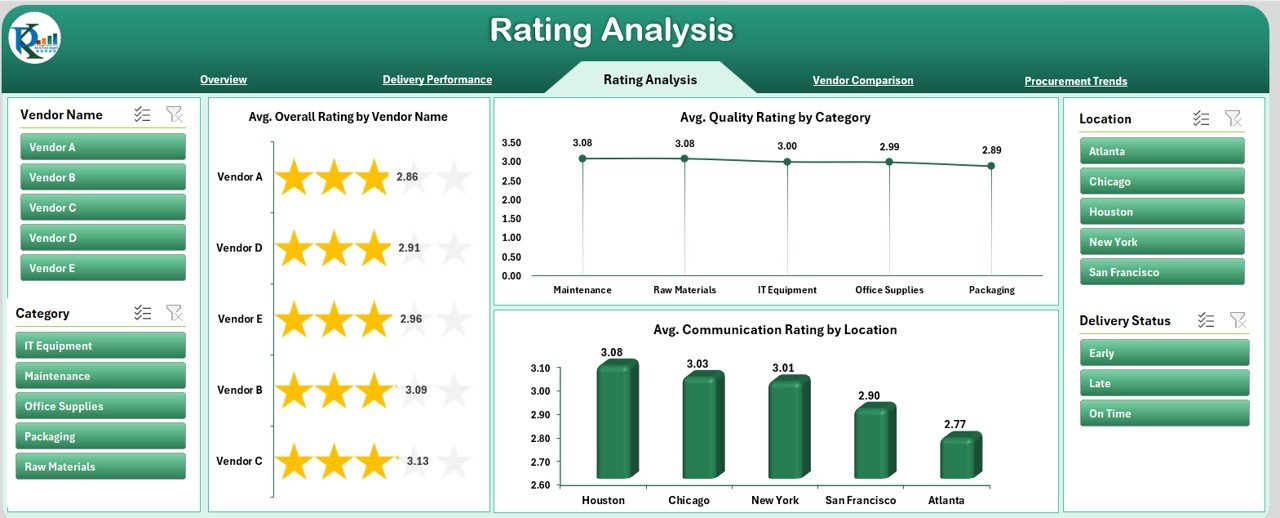
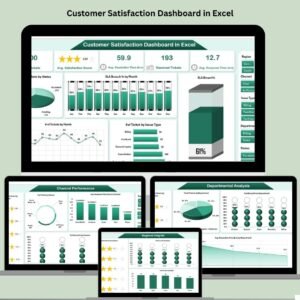
 Rating Analysis Page
-
Average quality and communication ratings
-
Vendor-level performance visualized beautifully
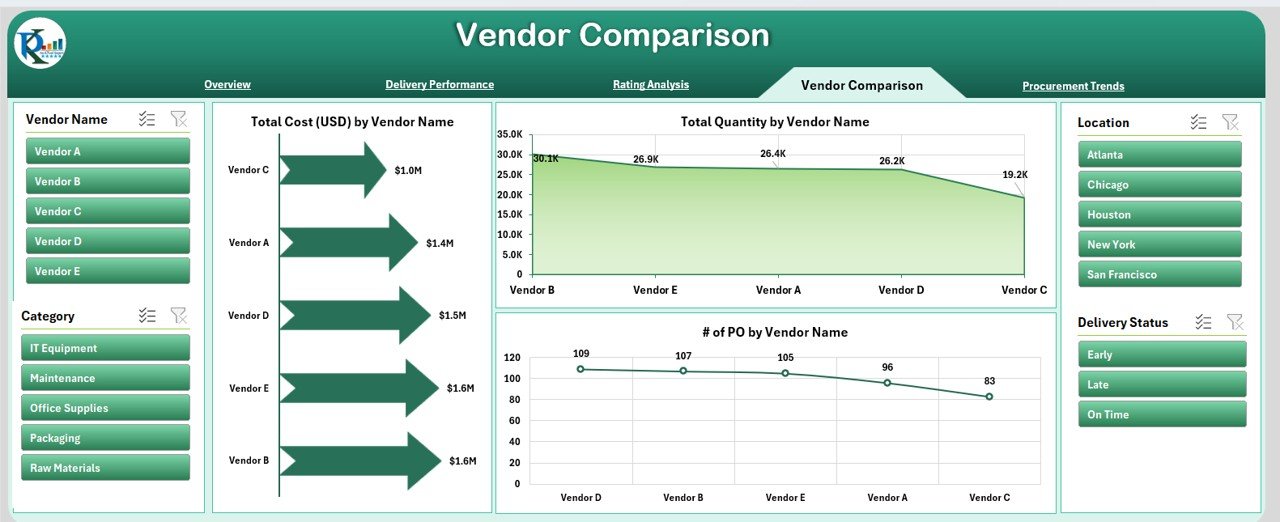
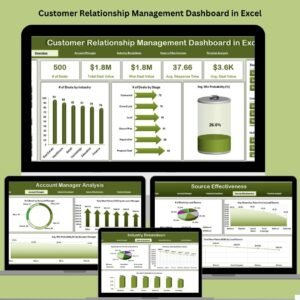
 Vendor Comparison Page
-
Compare vendors by cost, quantity, and PO count
-
Perfect for evaluating procurement efficiency
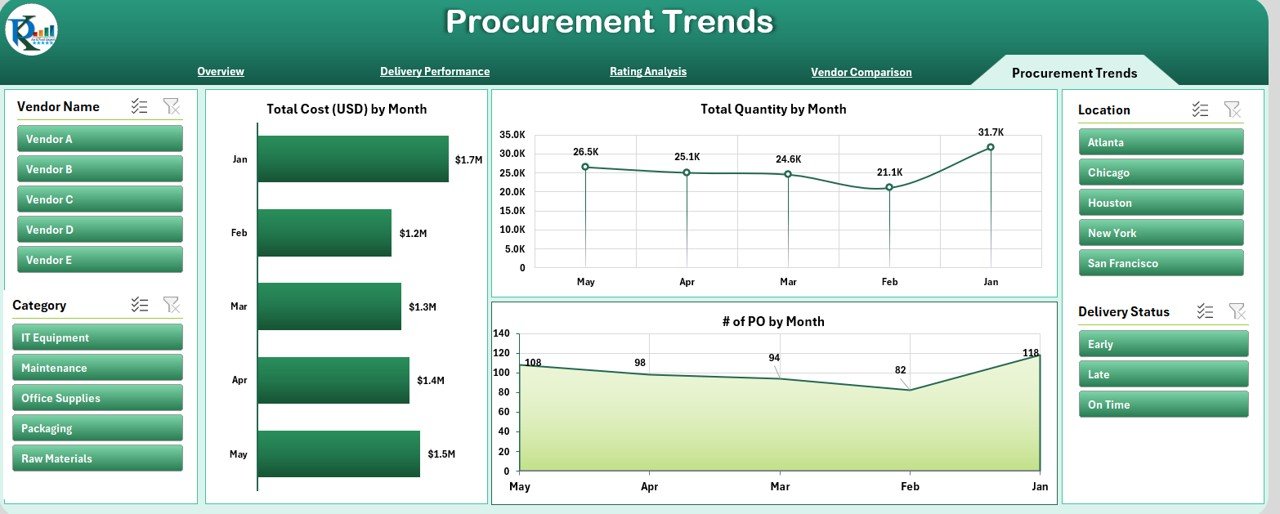
 Procurement Trends Page
-
Monthly cost, quantity, and PO trends
-
Spot seasonal patterns or inconsistencies
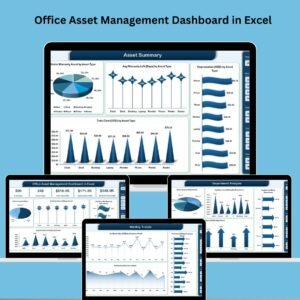
 What’s Inside the Dashboard?
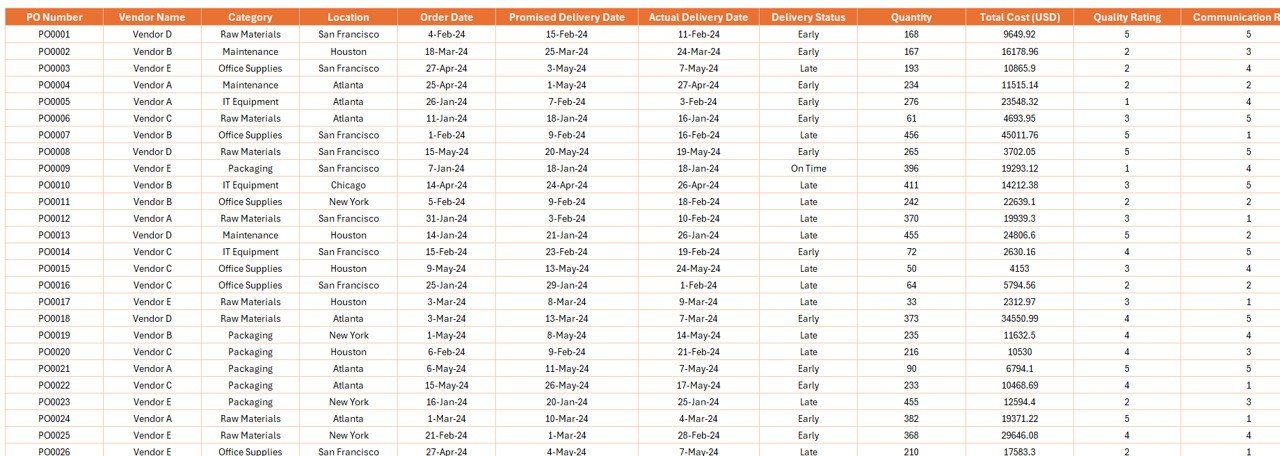
-
 Data Sheet: Raw data like PO number, vendor name, cost, delivery dates, and ratings
 -
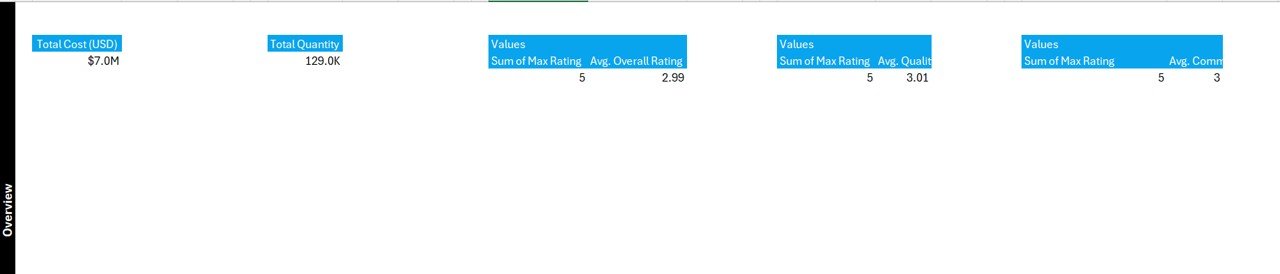
 Support Sheet: Dropdowns and slicers for interactivity
 -
 5 Analytical Pages: Ready-made charts and metrics powered by PivotTables
This dashboard is built entirely with Excel tools you already know — PivotTables, slicers, data bars, and conditional formatting.
 How to Use the Dashboard
-
Prepare Your Data – Fill in the data sheet with vendor records.
-
Explore the Dashboard – Use slicers to filter by vendor, category, or location.
-
Analyze Metrics – View delivery delays, cost trends, and rating patterns.
-
Make Data-Driven Calls – Use the visuals to assess performance and improve vendor decisions.
-
Customize if Needed – Add columns, update charts, or reformat visuals — all in Excel.
 Who Can Benefit from This Dashboard?
 Procurement Teams – Spot inefficiencies and save on costs Vendor Managers – Evaluate supplier quality and communication Operations Teams – Get real-time performance snapshots SMEs & Enterprises – Use in any industry like retail, manufacturing, or healthcare
Whether you’re tracking 5 vendors or 500, this dashboard scales effortlessly.
 Why Excel for Vendor Performance Tracking?
Unlike complex BI tools, Excel is:
-
 Cost-Effective – No software subscription needed
 -
 Customizable – Modify formulas, add columns, change visuals
 -
 Shareable – Export to PDF or share over email
 -
Expandable – Easily integrate with Power Query or Power BI later
Pro Tips to Enhance Performance
 Use slicers for dynamic filtering
 Apply conditional formatting for visual clarity
 Use COUNTIFS and AVERAGEIFS for KPI metrics
 Protect the sheet to avoid accidental edits
 Add VBA to automate monthly email reports
 Future Ready and Scalable
Start in Excel. Grow into Power BI. With simple tweaks, this dashboard can be:
-
Integrated with live data
-
Automated using Power Query
-
Converted into a cloud-based web dashboard
 Visit our YouTube channel to learn step-by-step video tutorials


Reviews
There are no reviews yet.