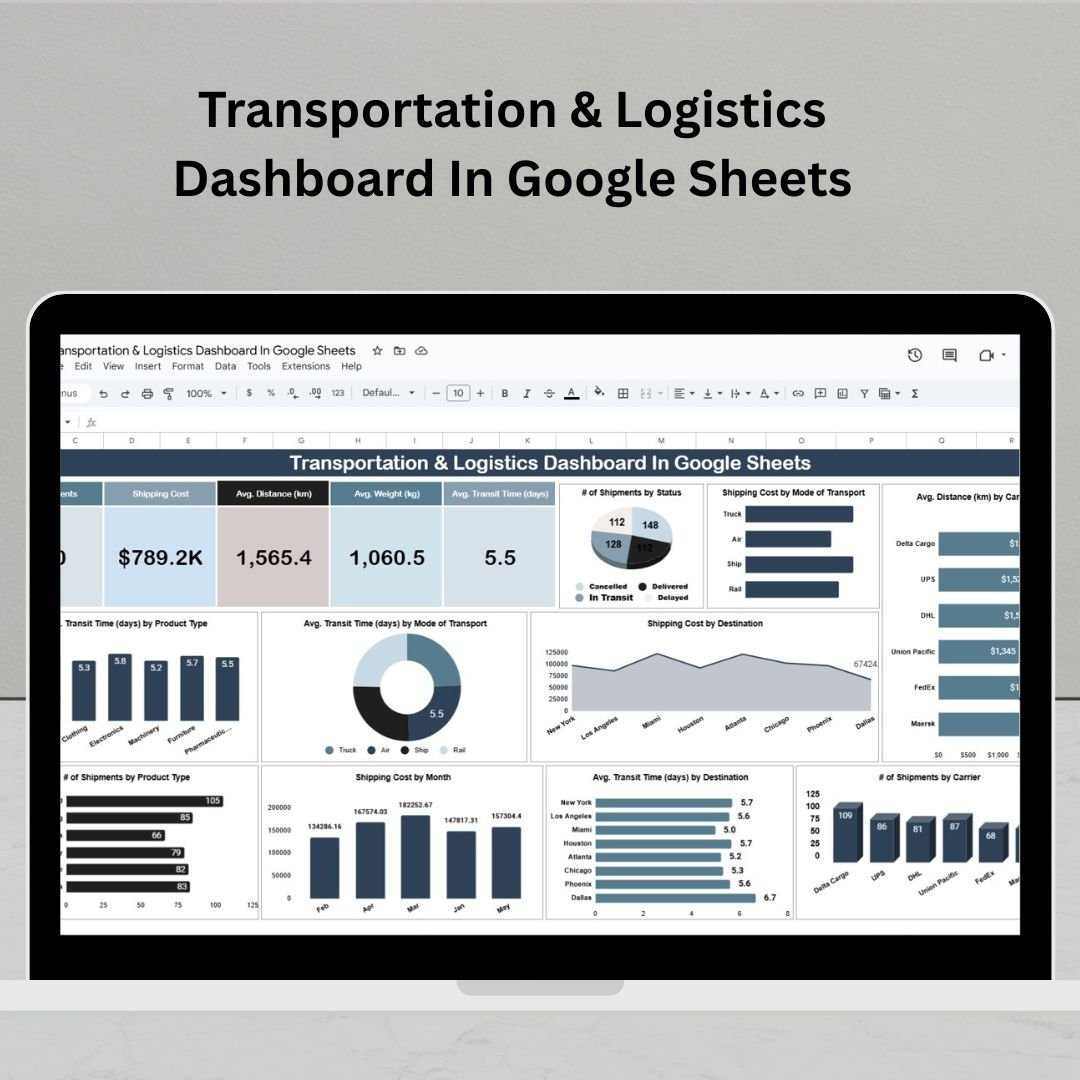
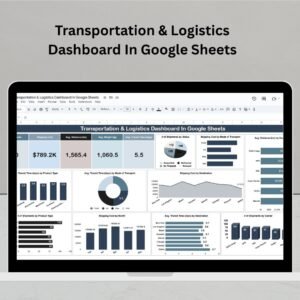
In today’s fast-paced business world, timely deliveries and optimized shipping are the keys to customer satisfaction and profitability. The Transportation & Logistics Dashboard in Google Sheets is your ready-made command center for managing and analyzing your shipping data like a pro. 📦
Whether you’re a logistics manager, operations team member, or small business owner, this dashboard helps you track KPIs like shipping costs, transit times, and distances—all in one place, visually and instantly.
🔑 Key Features of the Transportation & Logistics Dashboard
📊 Dashboard Sheet Tab – Visualize What Matters
This is your go-to place for quick insights and visual summaries:
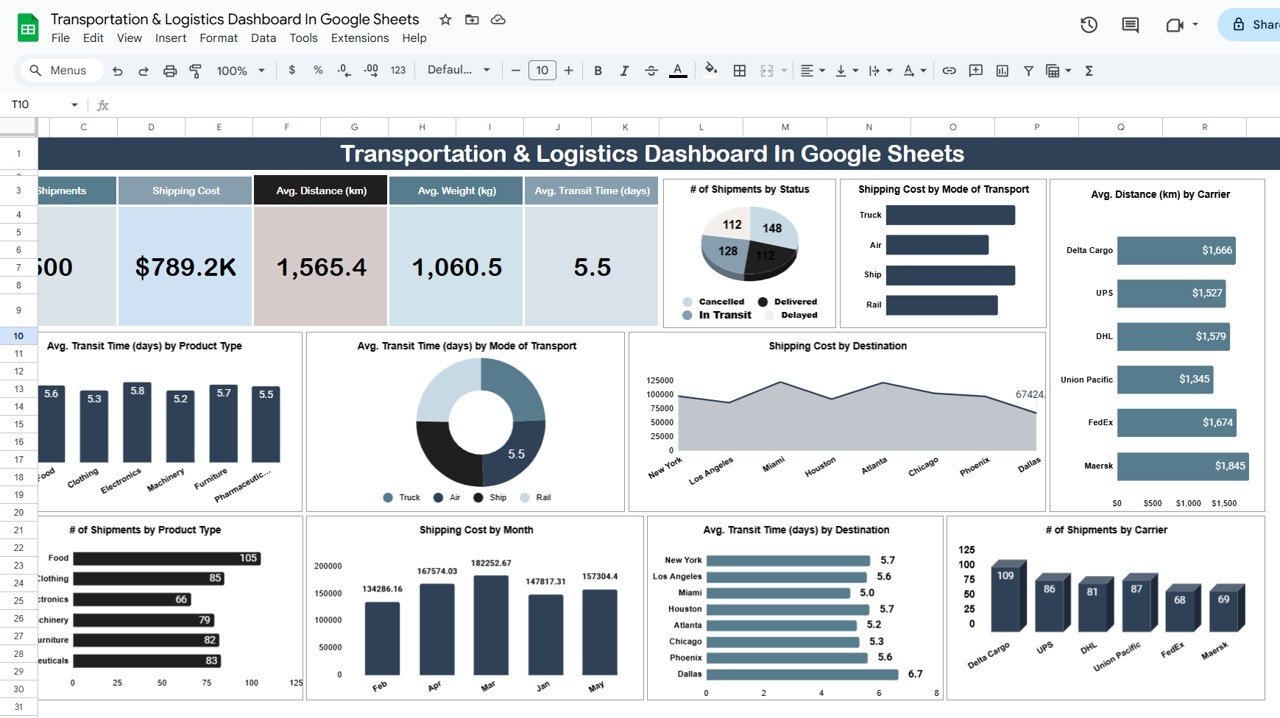
💡 Cards Summary:
-
📦 # of Shipments – Total shipments processed
-
💰 Shipping Cost – Cumulative cost over time
-
📍 Avg. Distance (km) – Distance traveled per shipment
-
⚖️ Avg. Weight (kg) – Weight of shipped items
-
⏱️ Avg. Transit Time (days) – Time taken for delivery
💥 Interactive Charts:
-
📈 # of Shipments by Status – Completed, In Transit, Delayed
-
🛣️ Shipping Cost by Mode – Road, Air, Sea
-
🏁 Avg. Distance by Carrier – Performance comparison
-
🌍 Shipping Cost by Destination – Identify cost-heavy zones
-
🕐 Transit Time by Transport Mode – Understand delivery efficiency
-
🎯 Transit Time by Product Type – Track delays by category
-
📦 # of Shipments by Product Type – Know what’s moving
-
📅 Shipping Cost by Month – Uncover trends and seasonality
-
🧭 Transit Time by Destination – Spot lagging regions
-
🚛 # of Shipments by Carrier – Carrier workload and performance
These visuals help you make quick, informed decisions based on real data.
📋 What’s Inside the Transportation & Logistics Dashboard
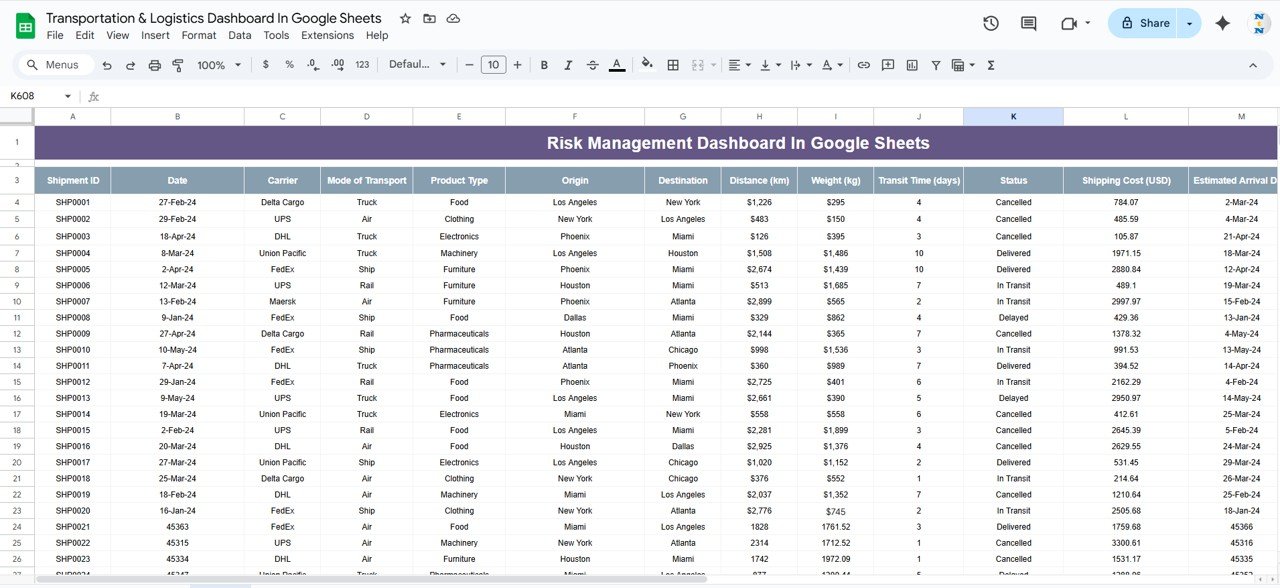
📁 Data Sheet Tab – Your Input Hub
Everything starts here—just enter your shipping info, and the dashboard updates automatically! Columns include:
-
🆔 ID – Unique shipment code
-
📅 Date – When the shipment occurred
-
🚛 Carrier – e.g., FedEx, DHL
-
🎁 Product Type – Electronics, perishables, etc.
-
🔄 Shipment Status – Completed, Pending, In Transit
-
💸 Shipping Cost – Per-shipment expense
-
📏 Distance (km) – Distance traveled
-
⚖️ Weight (kg) – Shipment weight
-
⏱️ Transit Time (days) – Total delivery duration
-
📍 Destination – Country/Region shipped to
All data is reflected instantly in your dashboard—no formulas, no manual updates needed!
🛠️ How to Use the Transportation & Logistics Dashboard
Getting started is as easy as 1-2-3:
-
📥 Download the template and open it in Google Sheets
-
📝 Start entering shipping data into the Data Sheet Tab
-
📊 See real-time updates in the dashboard charts and cards
Use filters, update rows, and share with your team to stay fully aligned on your logistics goals.
👥 Who Can Benefit from This Dashboard?
-
📦 Logistics Managers – Monitor and improve shipping KPIs
-
🏢 Business Owners – Control cost and ensure timely deliveries
-
🛒 E-commerce Teams – Track every shipment with accuracy
-
🚚 Freight & Shipping Companies – Optimize mode, route, and carrier performance
-
📈 Analysts – Visualize performance and trends for reporting
This template helps you identify delays, optimize costs, and streamline your logistics operations with confidence.
🚀 Why You’ll Love This Template
-
🧠 Smart data visualization
-
📍 Real-time tracking & updates
-
🛠️ No coding or formulas required
-
🔍 Analyze cost by mode, region & carrier
-
📊 Understand delivery performance in seconds
-
👥 Easy team collaboration via Google Sheets
-
🧩 Fully customizable to your operations
-
📈 Built for small to large businesses


Reviews
There are no reviews yet.