

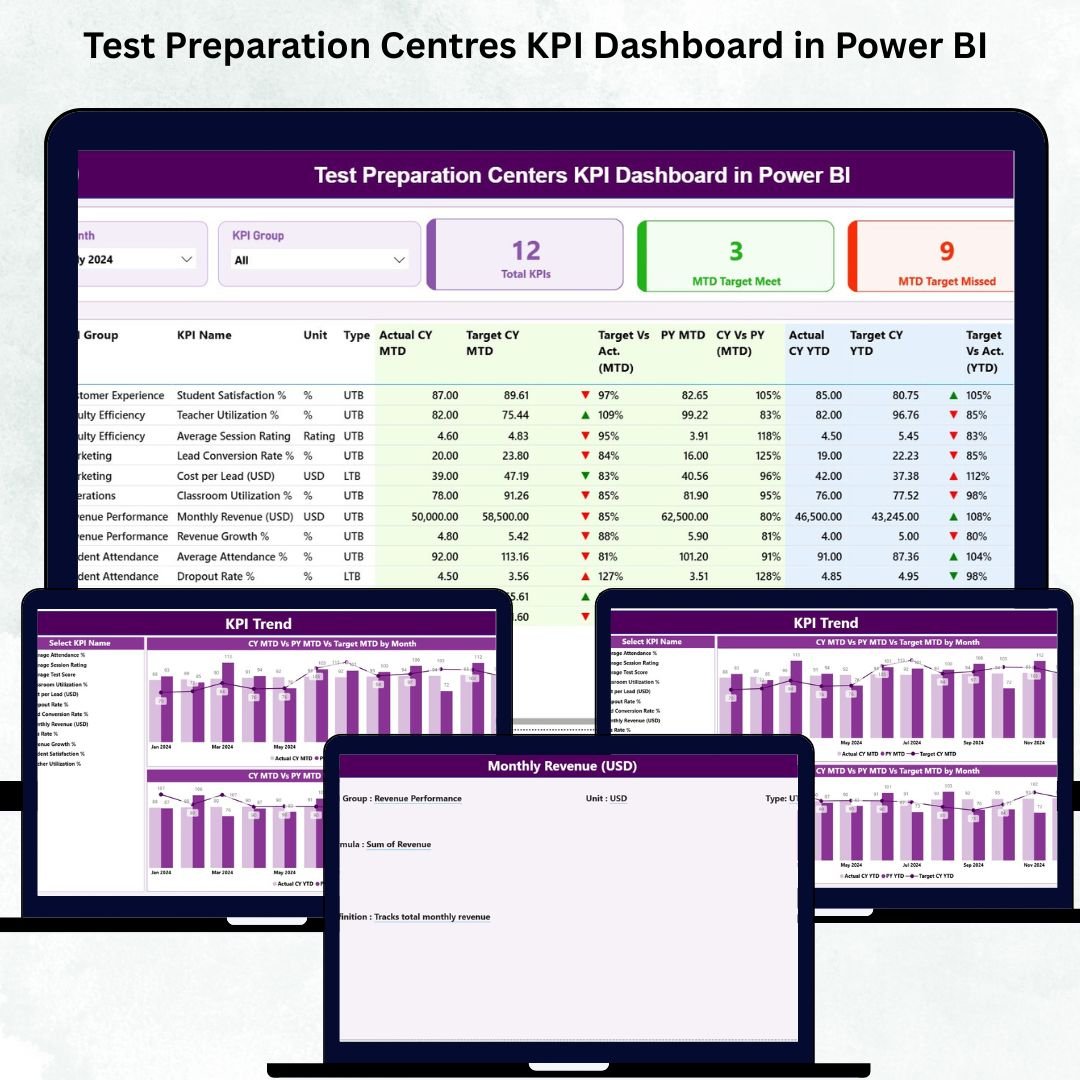

Test Preparation Centres KPI Dashboard in Power BI Running a test preparation centre is both rewarding and challenging. You help students chase their academic dreams, yet you must also manage huge volumes of data—attendance, enrollments, assessments, batch performance, instructor quality, revenue, dropout rates, satisfaction scores, and more. Test Preparation Centres KPI Dashboard in Power BI When this information stays scattered across multiple Excel files; it becomes difficult to make quick decisions. As a result, performance slows down, KPIs are missed, and growth opportunities are lost.
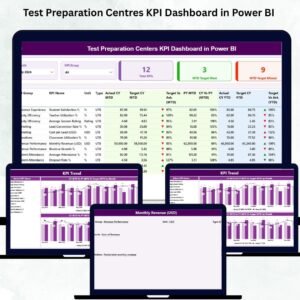
The Test Preparation Centres KPI Dashboard in Power BI solves these pain points instantly. With its clean visuals, dynamic filters, trend charts, and automated calculations, this dashboard gives you complete control over academic, operational, and financial performance. You can evaluate month-wise progress, compare Actual vs Target, analyze CY vs PY benchmarks, and track student outcomes with unmatched clarity.
This ready-to-use reporting solution is perfect for coaching centres, competitive exam institutes, online learning academies, and training organizations that want structured, real-time analysis without any technical complexity.
✨ Key Features of the Test Preparation Centres KPI Dashboard in Power BI
📊 Summary Page – Your One-View Performance Snapshot
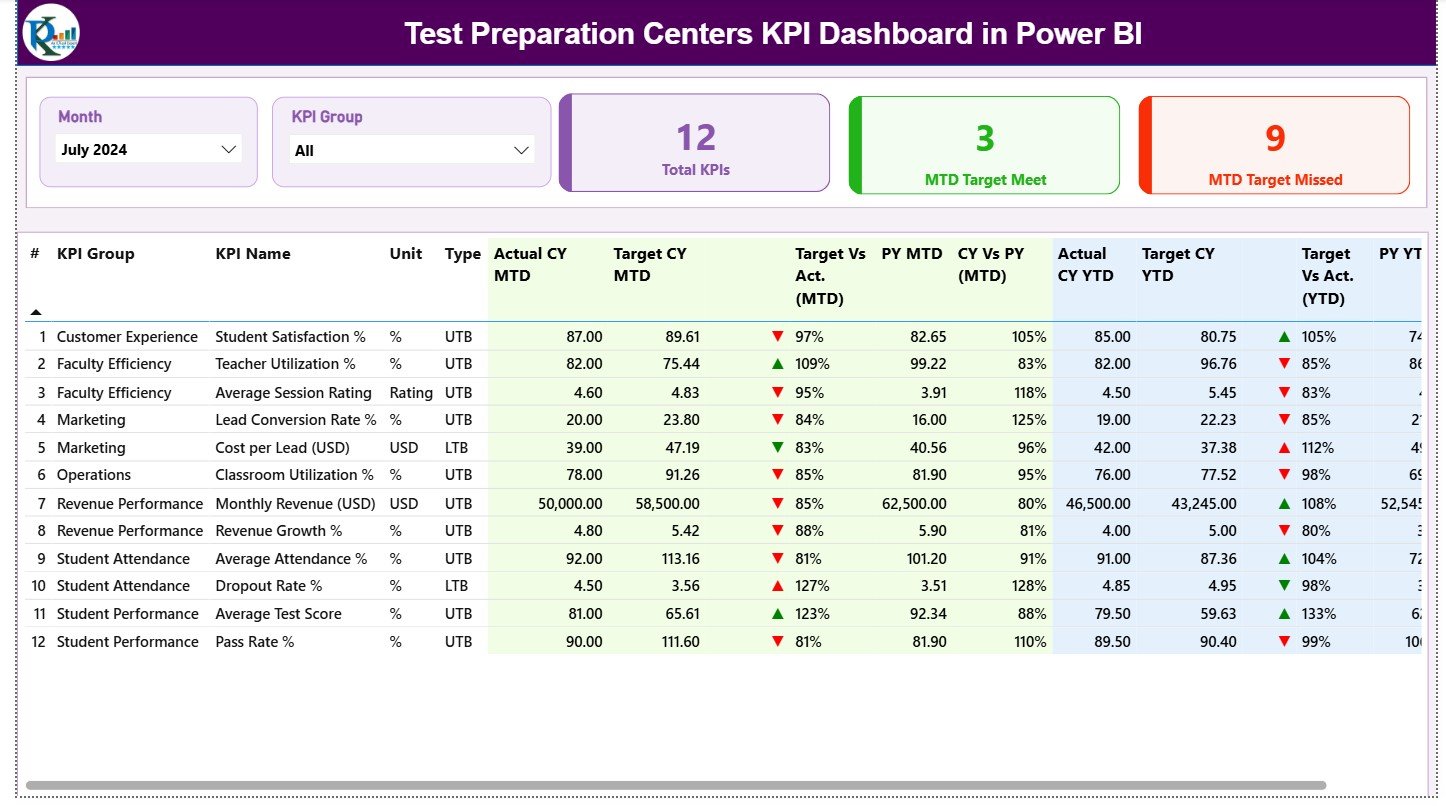
This is the main page and the most frequently used screen of the dashboard.
You get:
🔽 Month Slicer – Select the month you want to analyze.
🗂️ KPI Group Slicer – Filter KPIs across Academic, Attendance, Revenue, Student Growth, Instructor KPIs, etc.
⭐ Three KPI Cards –
Total KPIs Count
MTD Target Met Count
MTD Target Missed Count
The detailed KPI table displays everything a test prep centre need:
KPI Number
KPI Group
KPI Name
Unit
KPI Type (LTB or UTB)
Actual CY MTD vs Target CY MTD
MTD Icons (▲▼)
Target vs Actual %
Previous Year MTD
CY vs PY (MTD)
Actual CY YTD, Target CY YTD
YTD Icons (▲▼)
Target vs Actual % (YTD)
Previous Year YTD
CY vs PY (YTD)
This single table provides full transparency on performance, helping teachers and managers make quick, accurate decisions.
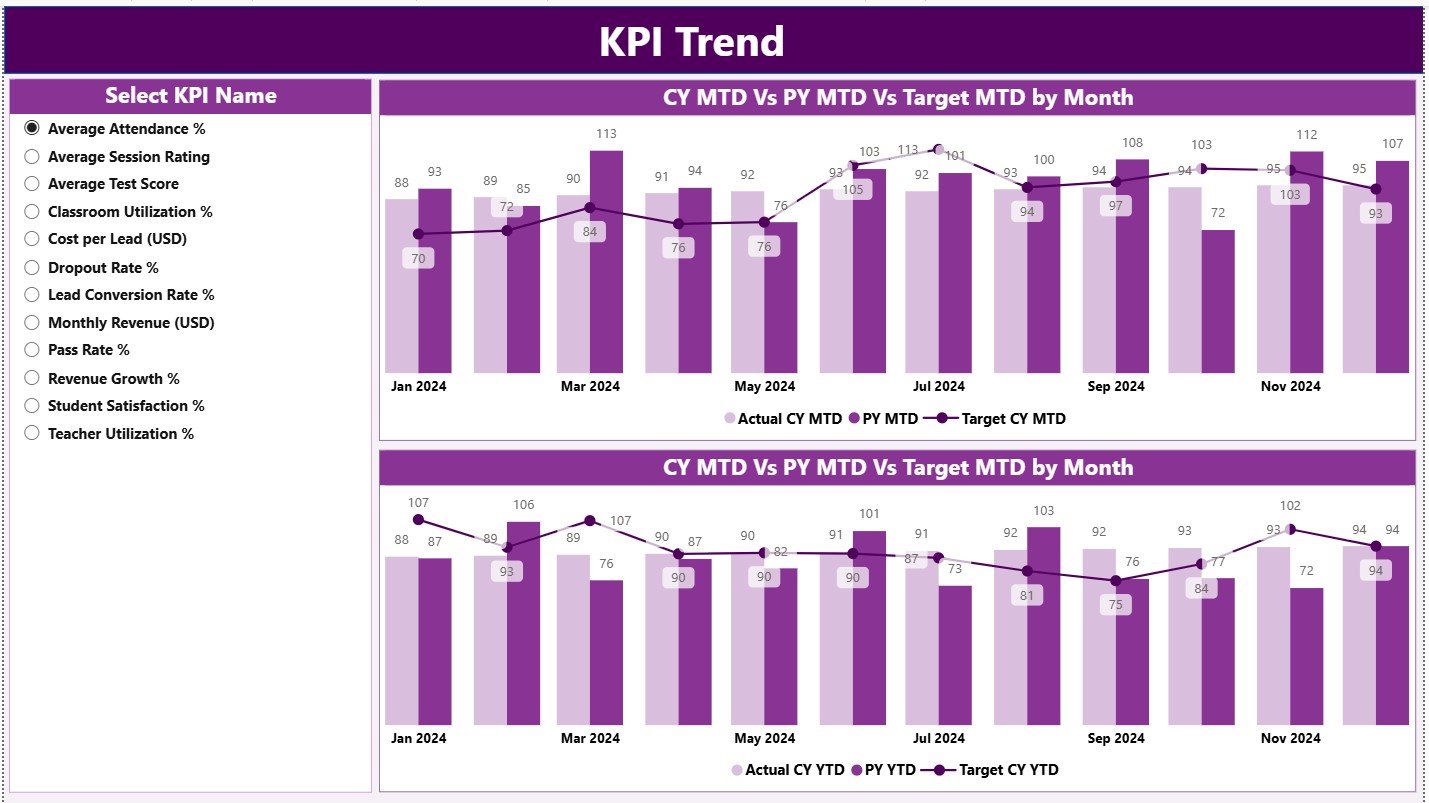
📈 KPI Trend Page – Month-by-Month Performance Insights
Understanding long-term behavior is crucial for student success.
This page includes:
🔽 KPI Selection Slicer
📉 MTD Trend Chart (CY vs PY vs Target)
📈 YTD Trend Chart (CY vs PY vs Target)
These visuals help academic teams identify seasonal patterns, evaluate teaching effectiveness, track improvements, and spot early warning signs.
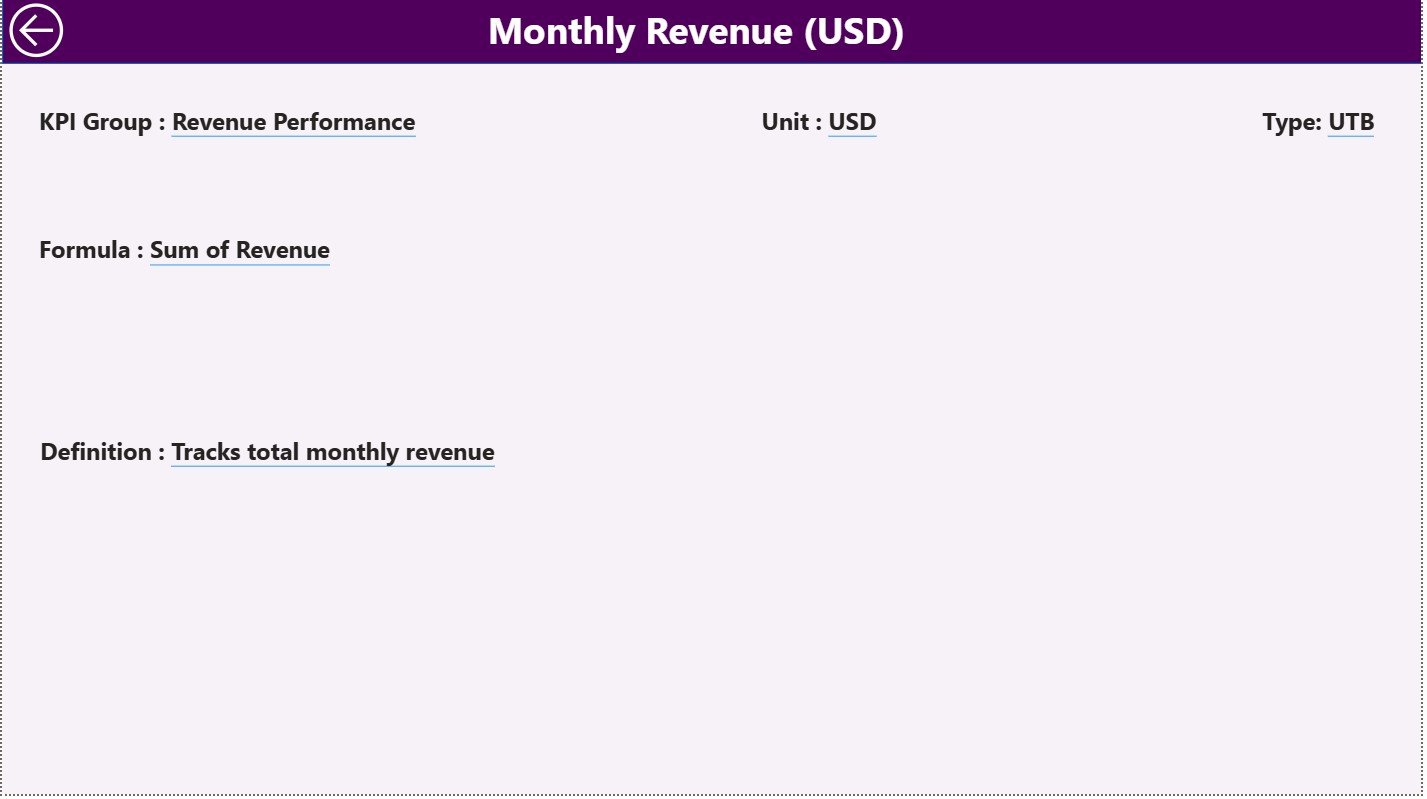
📘 KPI Definition Page – Deep Insight into Each KPI
This drill-through page displays complete details for every KPI:
KPI Number
KPI Group
KPI Name
Unit
Formula
Definition
KPI Type (UTB or LTB)
A Back button takes users back to the Summary Page instantly.
This ensures everybody—from teachers to academic heads—understands exactly how each KPI works.
🧮 Excel Data Source – The Backbone of the Dashboard
The dashboard refreshes itself based on three structured Excel sheets:
1️⃣ Input Actual Sheet
Enter:
KPI Name
Month (1st day of the month)
MTD Actual
YTD Actual
2️⃣ Input Target Sheet
Record:
KPI Name
Month
MTD Target
YTD Target
3️⃣ KPI Definition Sheet
Fill:
KPI Number
KPI Group
KPI Name
Unit
Formula
Definition
Type (LTB / UTB)
Power BI automatically fetches this data, making the dashboard fully dynamic.
🎯 Who Can Benefit from This KPI Dashboard
👩🏫 Teachers & Instructors
Track learning gaps, progress, and assessment outcomes.
🎓 Academic Heads & Centre Managers
Monitor batch performance, MTD/YTD movement, and enrollment trends.
🏢 Coaching Centre Owners
Get a complete view of operations, revenue, and academic success.
🧑💼 Operations & Admin Teams
Track attendance, centre efficiency, and student service quality.
💻 Online Learning Academies
Monitor digital student activity and performance instantly.
🌟 Why Every Test Preparation Centre Needs This Dashboard
📈 You track real academic performance in one place
🎯 You compare targets instantly with green/red icons
🔍 You study long-term trends for improvement
💡 You make smarter decisions based on real numbers
🧠 You improve student outcomes using data-driven insights
🚀 You save hours of manual reporting every month
✔️ You present professional visuals to stakeholders
### Click here to read the Detailed blog post
Visit our YouTube channel to learn step-by-step video tutorials
Watch the step-by-step video tutorial:
Compatibility and Requirements
- Works in Power BI Desktop, which is free to download. You also need Excel to enter your data, because the dashboard reads the Input Actual, Input Target and KPI Definition sheets.
- Microsoft explains how to install it in Get Power BI Desktop.
Frequently Asked Questions
Which pages does the dashboard have?
Three pages: Summary, KPI Trend and KPI Definition. The KPI Definition page opens as a drill-through and has a Back button to the Summary page.
Where do I enter my data?
In three Excel sheets. Input Actual takes the KPI name, the month (first day of the month), MTD actual and YTD actual. Input Target takes the KPI name, month, MTD target and YTD target. The KPI Definition sheet holds the KPI number, group, name, unit, formula, definition and type.
Can I compare this year with last year?
Yes. The Summary page shows Actual CY, Target CY and Previous Year figures for both MTD and YTD, with CY vs PY and Target vs Actual percentages. The KPI Trend page charts CY, PY and Target for each month.
How do I see whether a KPI met its target?
Each KPI row has MTD and YTD icons (up and down arrows). Three cards at the top count the total KPIs, the MTD targets met and the MTD targets missed.
Is there an Excel or Google Sheets version?
Yes. See the Test Preparation Centres KPI Dashboard in Excel. For Google Sheets, there is the Test Preparation Centers Dashboard in Google Sheets.
Related Test Preparation Templates
- Test Preparation Centres Dashboard in Power BI: another Power BI dashboard for the same type of centre
- Test Preparation Centres KPI Dashboard in Excel: the same KPI dashboard in Excel
- Test Preparation Centers Dashboard in Excel: a dashboard view in Excel
- Test Preparation Centers Dashboard in Google Sheets: a free-account option in Google Sheets
- Power BI Dashboard Mega Collection: 15 Power BI dashboard templates in one download
Browse all Power BI KPI dashboards.





















Reviews
There are no reviews yet.