

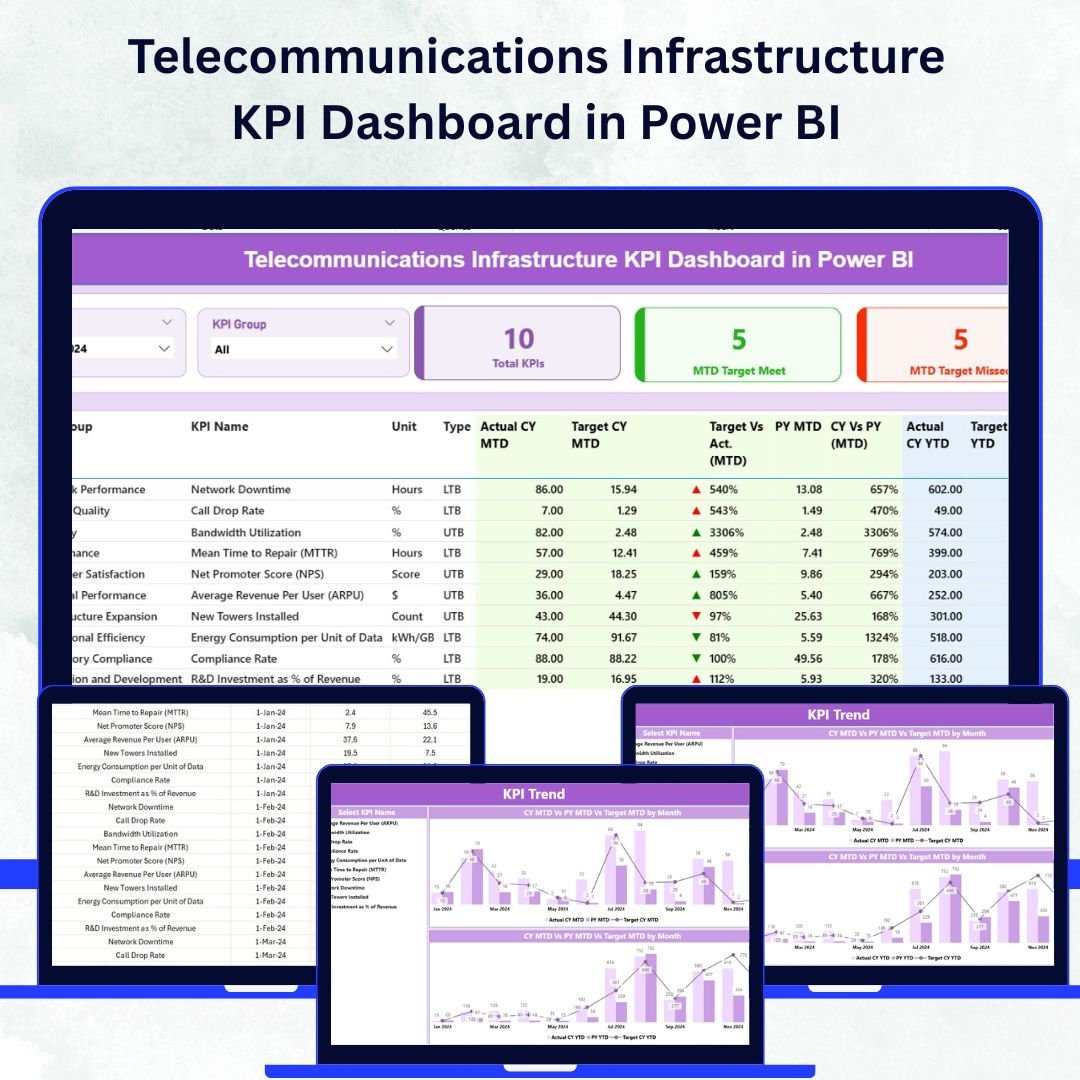

In the modern telecommunications era, data drives everything — from maintaining networks to optimizing operational efficiency. The Telecommunications Infrastructure KPI Dashboard in Power BI is a ready-to-use solution that transforms complex telecom data into clear, actionable insights.
Built for network operators, engineers, and management teams, this dashboard helps you monitor critical KPIs such as network uptime, energy consumption, maintenance compliance, and bandwidth utilization — all within one powerful Power BI interface.
Whether you’re overseeing hundreds of cell towers or managing regional operations, this dashboard provides real-time visibility, performance tracking, and data-driven decision-making capabilities — essential for maintaining reliability, quality, and profitability in the telecom sector.
⚙️ Key Features of the Telecommunications Infrastructure KPI Dashboard
📊 Three Interactive Pages:
Includes Summary, KPI Trend, and KPI Definition pages — each focused on a different layer of telecom performance analysis.
📅 Month & KPI Group Slicers:
Easily filter the data by month or KPI category to focus on specific performance periods or areas.
💡 Performance Cards:
Get instant visibility into Total KPIs Count, MTD Target Met, and MTD Target Missed — with intuitive up/down icons showing results at a glance.
📈 Comprehensive KPI Table:
Analyze MTD and YTD performance against targets, with columns for Actual vs. Target, Previous Year comparisons, and growth percentages.
📉 Trend Analysis:
The KPI Trend page allows users to visualize Current Year vs. Previous Year trends for both MTD and YTD — ideal for forecasting and long-term analysis.
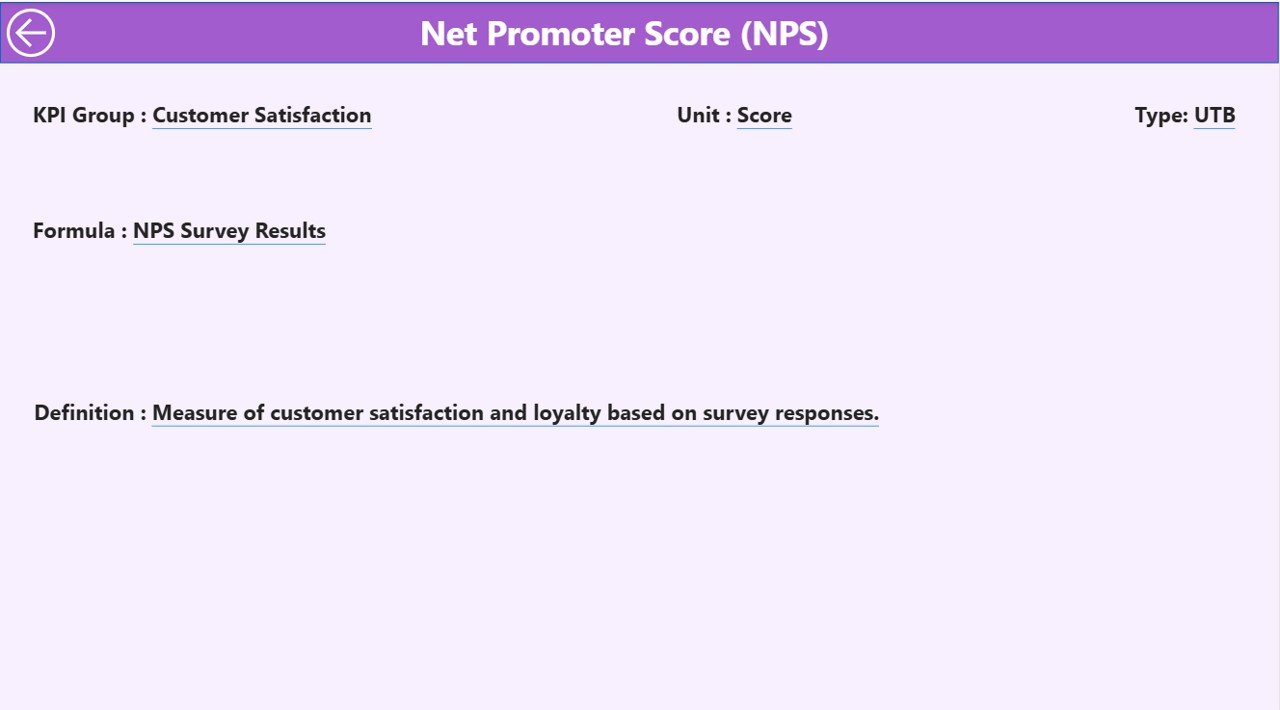
🔍 Drill-Through Definitions:
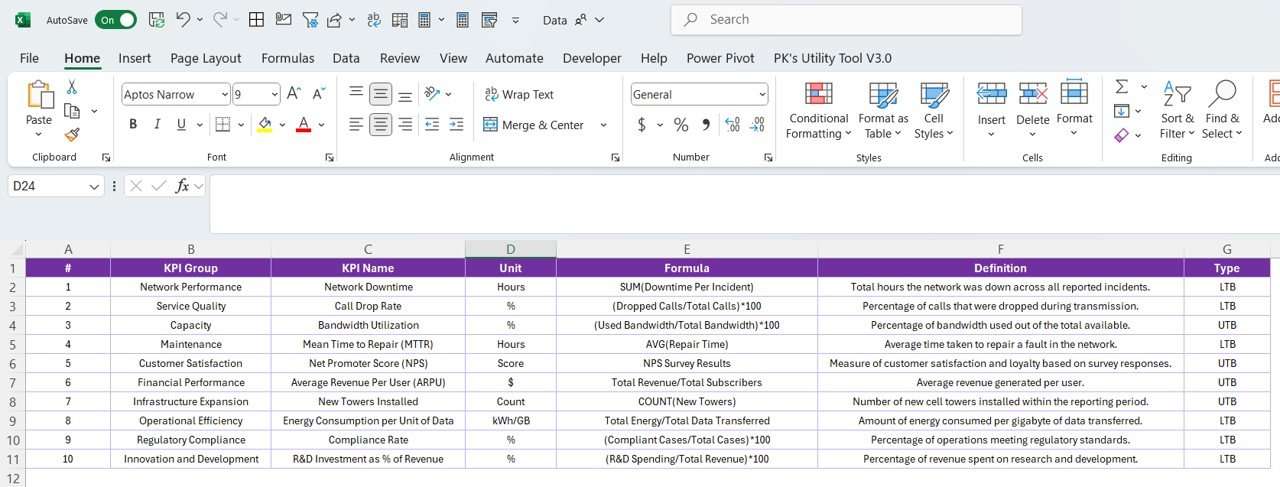
Right-click on any KPI to see its formula, definition, unit, and target type (UTB or LTB). This ensures transparency and consistency across teams.
🧾 Excel Integration:
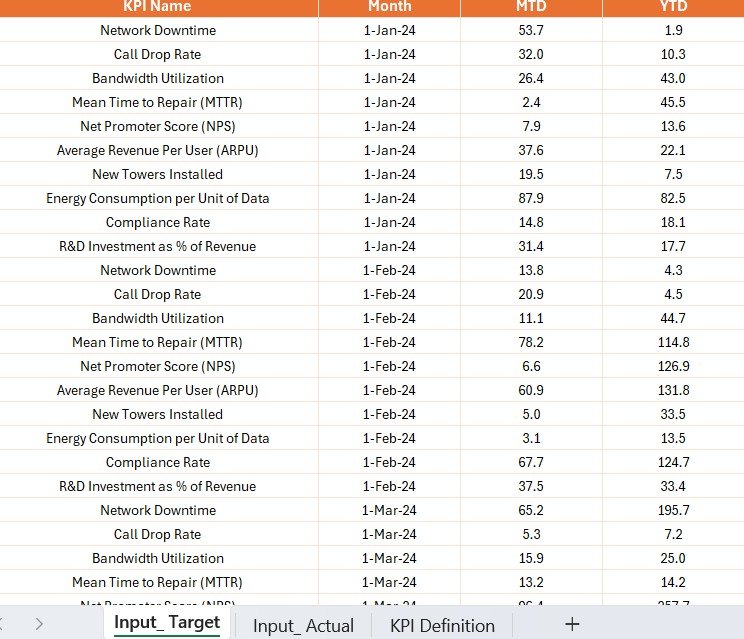
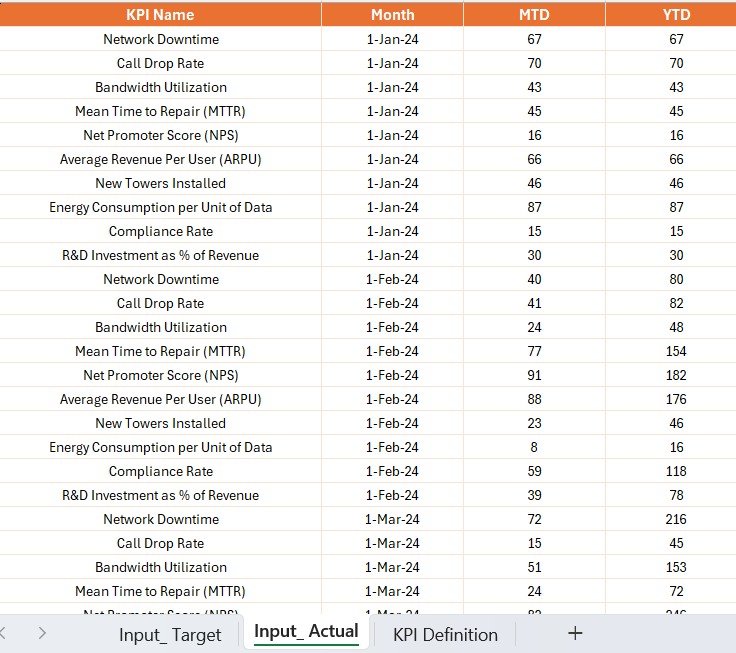
All data is sourced from three structured Excel sheets (Input_Actual, Input_Target, KPI Definition) — making updates quick and seamless.
⚙️ Automated Calculations:
Built with DAX measures that calculate Actual vs. Target ratios, CY vs. PY growth, and performance icons automatically.
📡 Real-Time Monitoring:
Gain live insights into network reliability, tower maintenance, bandwidth usage, and cost efficiency.
🧭 User-Friendly Interface:
Designed with clean visuals, standard color coding (green, yellow, red), and slicers that make navigation intuitive for all users.
🗂️ Dashboard Structure Overview
1️⃣ Summary Page:
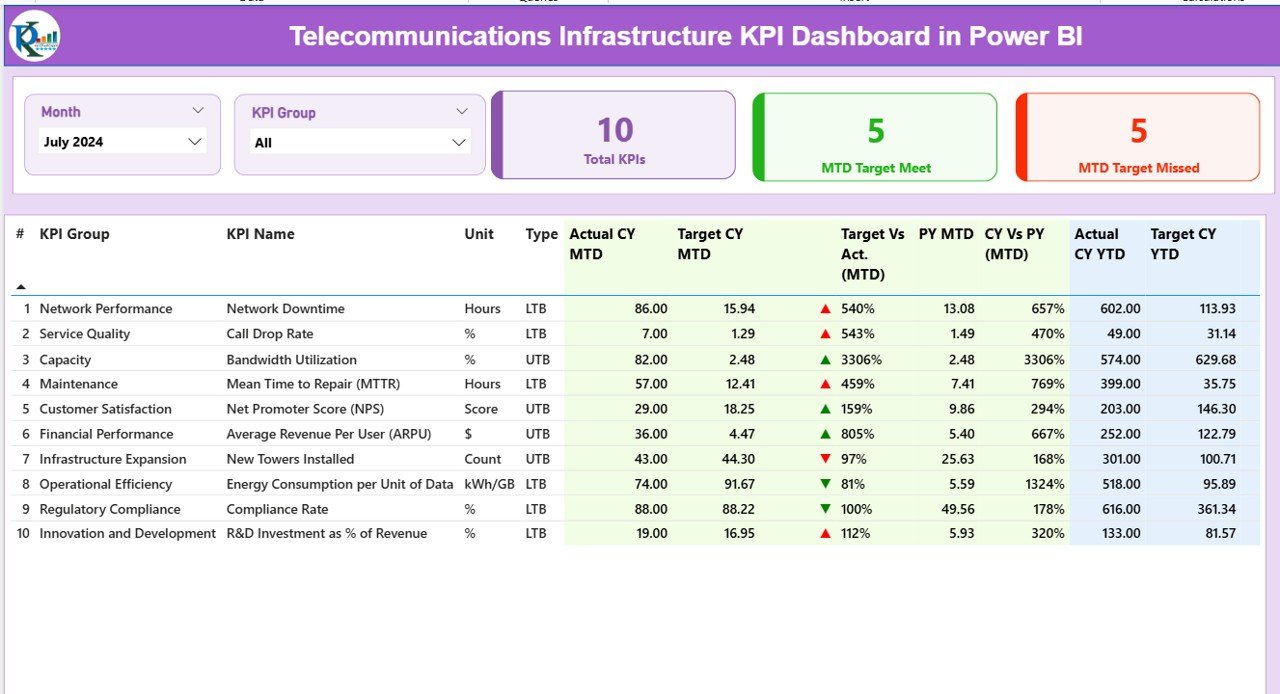
The main dashboard view — presenting overall performance metrics, KPI cards, and detailed tables.
Helps executives and managers instantly identify performance gaps and achievements.
2️⃣ KPI Trend Page:
Displays visual time-series trends for each KPI across months, comparing Current Year, Previous Year, and Targets.
Ideal for identifying seasonal patterns, recurring issues, or consistent growth areas.
3️⃣ KPI Definition Page:
Acts as a detailed reference sheet. Provides complete definitions and formulas for each KPI — ensuring clarity and uniform understanding across departments.
🧭 How to Use the Telecommunications Infrastructure KPI Dashboard
✅ Step 1: Update the Excel sheets (Actual, Target, Definition) with your latest data.
✅ Step 2: Open the Power BI file and refresh data connections.
✅ Step 3: Explore the Summary Page for a performance snapshot.
✅ Step 4: Use slicers to filter by month or KPI group.
✅ Step 5: Drill through KPIs for definitions or trend analysis.
✅ Step 6: Share insights securely using Power BI Service for collaboration.
In minutes, you’ll have an automated, real-time KPI dashboard that keeps your entire telecom operation on track.
👥 Who Can Benefit from This Dashboard
📡 Telecom Operators: Track tower uptime, bandwidth usage, and service reliability.
🧰 Network Engineers: Monitor maintenance cycles and energy efficiency.
💼 IT & Operations Teams: Evaluate resource utilization and performance benchmarks.
💰 Finance Teams: Measure cost efficiency and capital utilization.
📈 Executives & Management: Gain a strategic view of performance trends and KPI achievements.
🌍 Real-World Applications
✅ Network Operations Centers (NOC): Real-time monitoring of outages and uptime.
✅ Infrastructure Teams: Track repair compliance and energy savings.
✅ Corporate Management: Compare targets with performance for monthly reviews.
✅ Engineering Teams: Analyze system performance and optimize resource allocation.
🌟 Why Choose Power BI for Telecom KPI Tracking
Interactive Data Exploration: Drill down across regions, projects, and KPI groups.
Seamless Excel Integration: Keep your workflow simple and efficient.
Dynamic Visualization: Use charts, cards, and icons to highlight performance.
Scalability: Handle large datasets for enterprise-level telecom infrastructures.
Automation: No manual updates — refresh data and watch insights update live.
🔗 Click here to read the Detailed Blog Post
🎥 Visit our YouTube channel for step-by-step tutorials
🔗 YouTube.com/@PKAnExcelExpert






























Reviews
There are no reviews yet.