

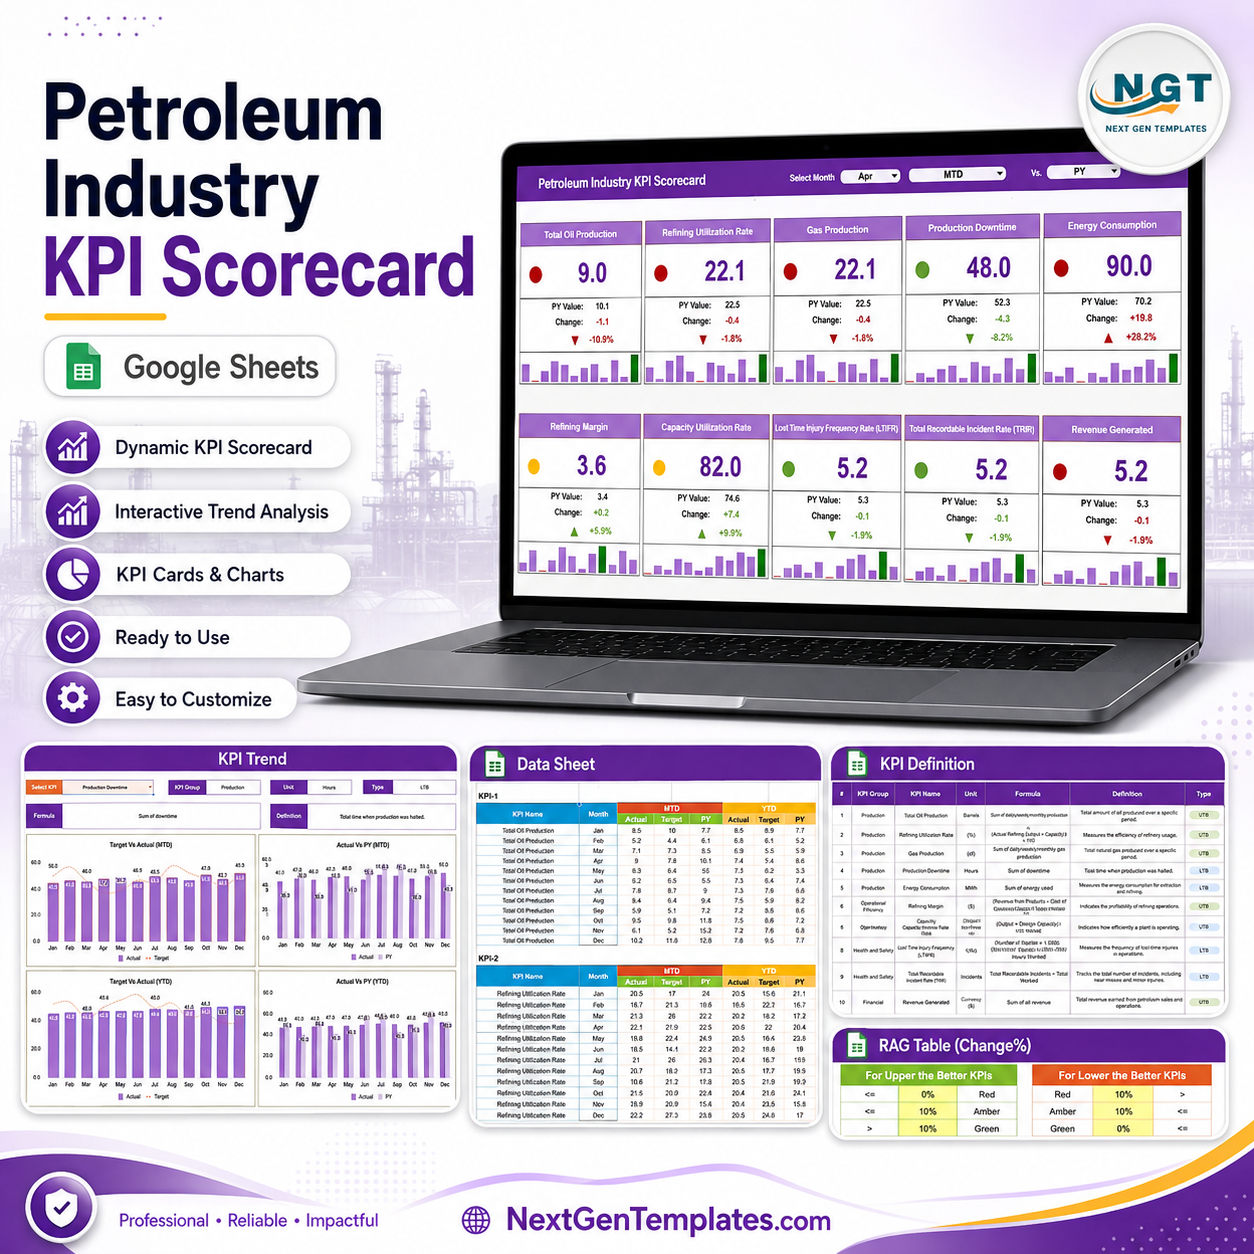
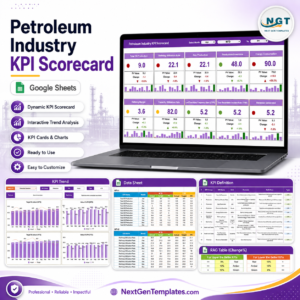
Petroleum Industry KPI Scorecard in Google Sheets tracks 10 petroleum KPIs across 5 working tabs, with MTD/YTD actuals, targets, previous-year values, monthly trends, and red/amber/green status logic. The Overview page alone includes 10 KPI cards and 10 trend charts, while the KPI Trend page adds four comparison views for any selected KPI. Built by PK, a Microsoft Certified Professional with 15+ years of spreadsheet experience and 300K+ subscribers across YouTube channels. One-time $8.99 sale price, lifetime access, no subscription, and an editable Google Sheets copy for your team.
Petroleum Industry KPI Scorecard in Google Sheets
Key Features of Petroleum Industry KPI Scorecard in Google Sheets
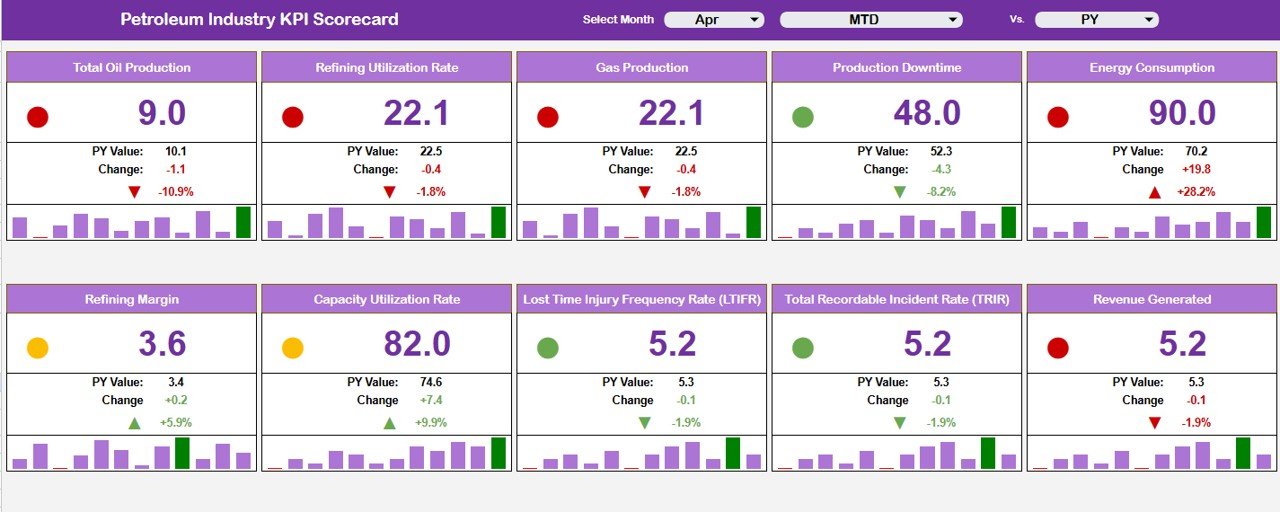
- 10 petroleum KPI cards – Total Oil Production, Refining Utilization Rate, Gas Production, Production Downtime, Energy Consumption, Refining Margin, Capacity Utilization Rate, LTIFR, TRIR, and Revenue Generated.
- MTD and YTD reporting – switch between month-to-date and year-to-date performance without rebuilding formulas.
- Actual vs PY or Target – compare current performance against prior year or target using the same slicer-driven scorecard layout.
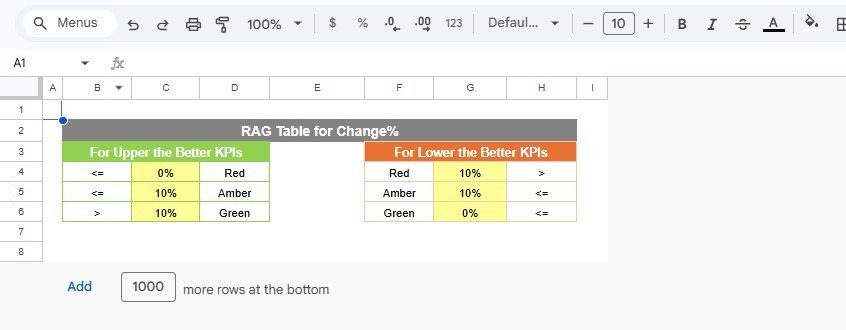
- RAG performance rules – red, amber, and green status indicators follow editable Upper-the-Better and Lower-the-Better threshold settings.
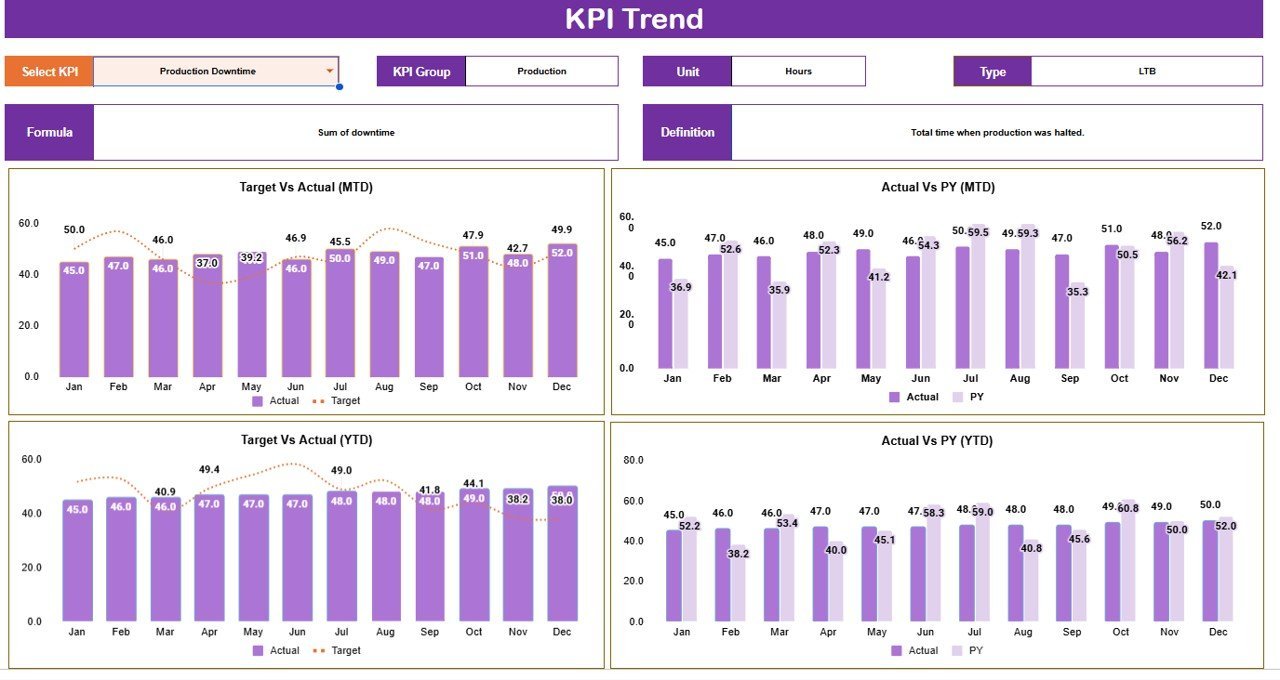
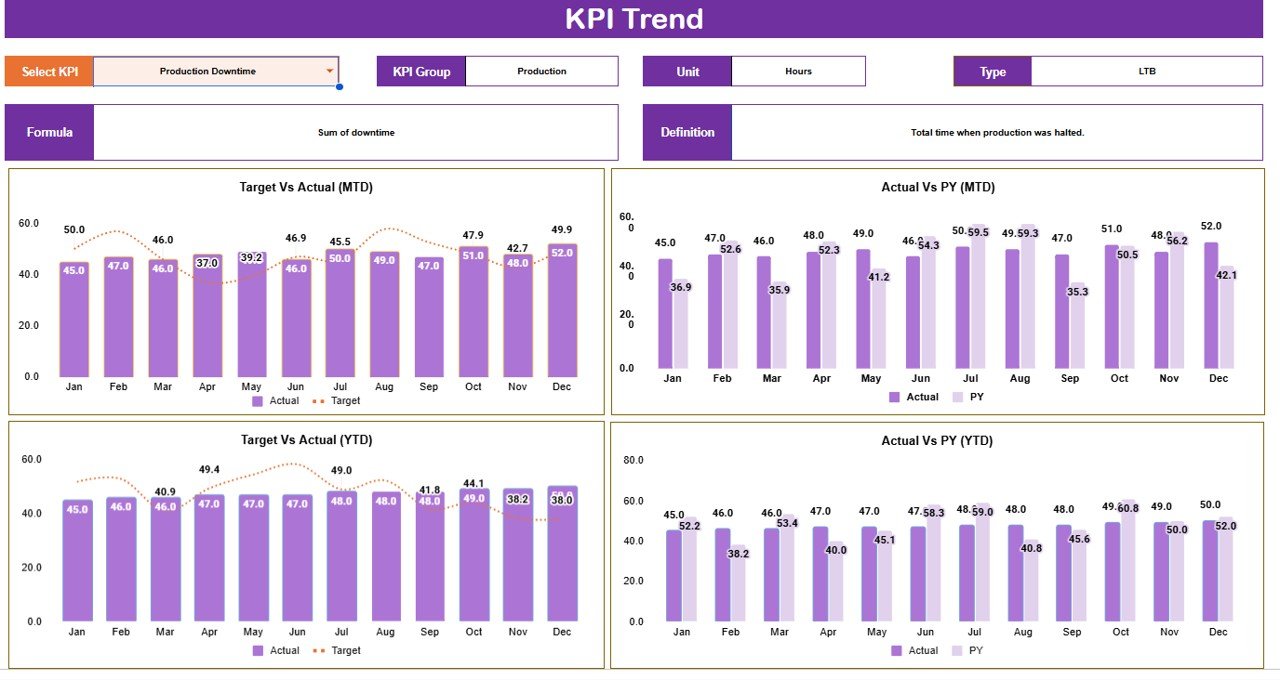
- KPI Trend tab – select one KPI and instantly review Actual vs Target MTD, Actual vs PY MTD, Actual vs Target YTD, and Actual vs PY YTD.
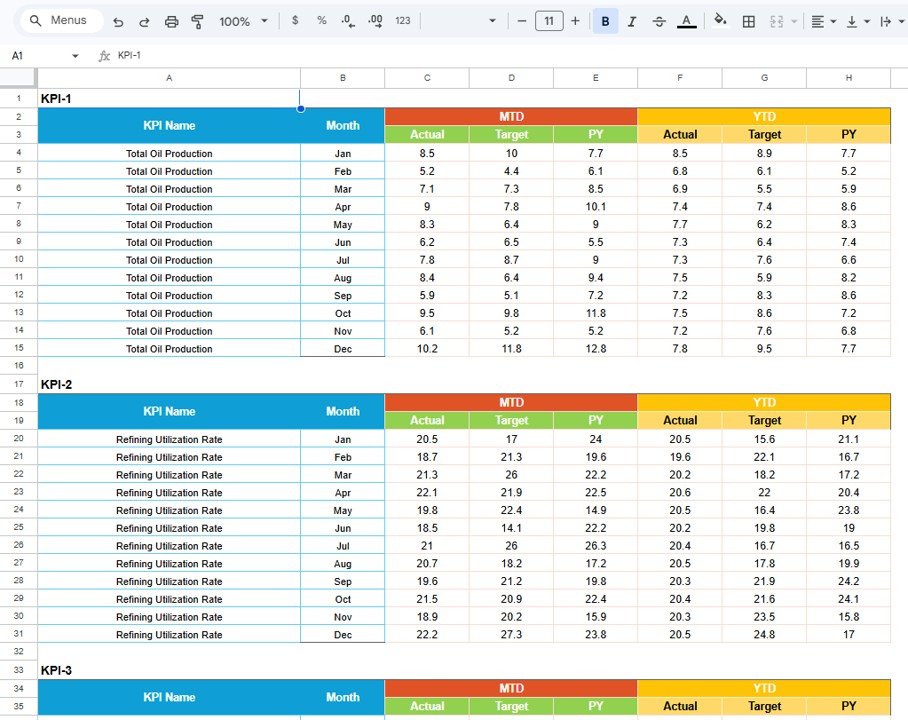
- Structured data input – each KPI has its own monthly block with MTD Actual, MTD Target, MTD PY, YTD Actual, YTD Target, and YTD PY columns.
- Editable KPI master – maintain KPI group, KPI name, unit, formula, definition, and type in one settings sheet.
- Google Sheets collaboration – share the copied file with managers, analysts, and department leads inside Google Drive.
What’s Inside the Petroleum Industry KPI Scorecard in Google Sheets
1. Overview Page
The Overview page is the executive scorecard. Each card shows current value, PY value, change, change %, monthly trend, and a red/amber/green status indicator. Slicers for Select Month, MTD or YTD, and Vs. PY or Target let you move from board-level review to filtered operational review quickly.
The 10 monthly trend charts track oil production, refining utilization, gas production, downtime, energy consumption, refining margin, capacity utilization, LTIFR, TRIR, and revenue. These charts help petroleum managers see which operating metrics are improving, which are slipping, and which require deeper review.
2. KPI Trend
The KPI Trend sheet focuses on one selected KPI at a time. A dropdown at the top shows the KPI group, unit, type, formula, and definition, then displays Actual vs Target and Actual vs PY comparisons for both MTD and YTD.
KPI Trend
3. Data Sheet Tab
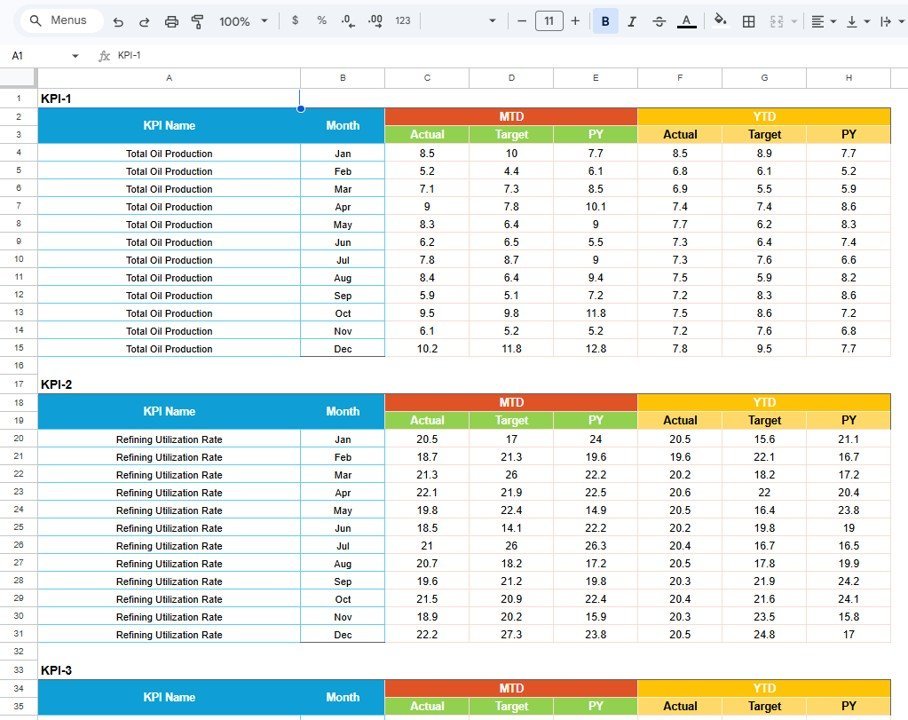
The Data Sheet is where you enter or paste the monthly KPI values. Every KPI has its own block, with months down the side and the columns MTD Actual, MTD Target, MTD PY, YTD Actual, YTD Target, and YTD PY.
Data Sheet tab
4. KPI Setting Sheet
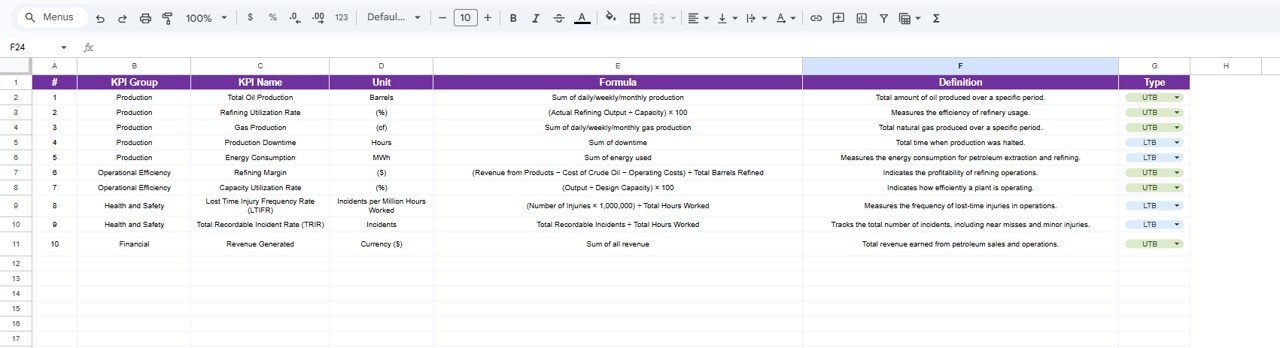
The KPI Setting sheet is the master list for the scorecard. Maintain KPI Group, KPI Name, Unit, Formula, Definition, and Type so the scorecard can apply the right labels and Upper-the-Better or Lower-the-Better logic.
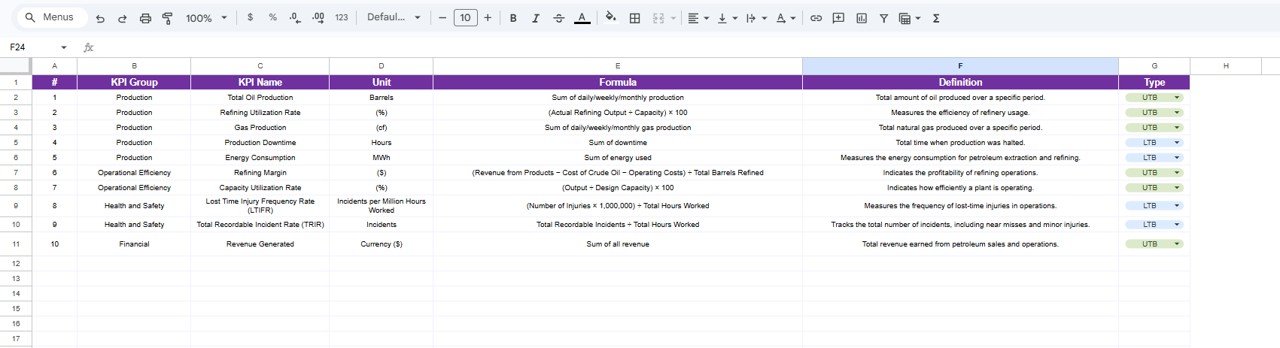
KPI Setting sheet tab
5. RAG Setting Sheet
The RAG Setting sheet controls the Change % thresholds for red, amber, and green status. You can maintain separate rules for Upper-the-Better KPIs and Lower-the-Better KPIs, so safety, downtime, production, margin, and utilization metrics are evaluated correctly.
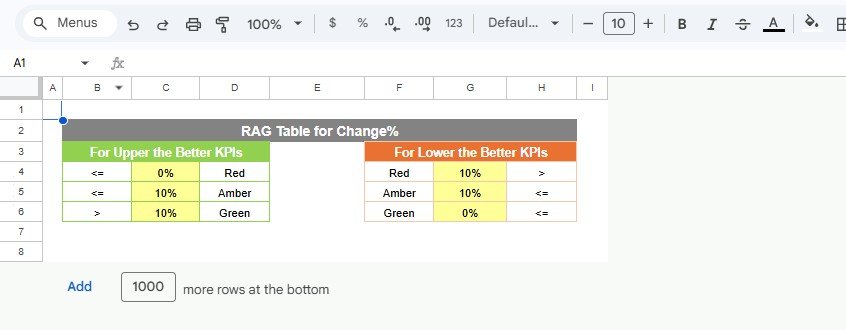
RAG Setting sheet tab
Petroleum Industry KPI Scorecard in Google Sheets vs. Excel Dashboard vs. Paid CRM/SaaS – Where This Fits
| Feature | This Google Sheets scorecard | Excel KPI dashboard | Paid operations SaaS |
|---|---|---|---|
| Cost | $8.99 one-time | One-time file cost, plus Excel license | Subscription or implementation quote |
| Platform | Google Sheets in browser | Desktop Excel or Microsoft 365 | Vendor cloud system |
| Setup time | Make a copy and replace KPI values | Open workbook and refresh | Configuration and onboarding |
| Real-time team collaboration | Native Google Sheets sharing | Via OneDrive or SharePoint | Usually included |
| Mobile access | Google Sheets mobile app | Limited on mobile | Usually app or browser |
| Customizable fields | KPI master and RAG settings editable | Editable formulas and pivots | Depends on vendor permissions |
| Share with link | Yes | Only through cloud storage | Login-controlled |
| Year-1 cost at 5 users | $8.99 total | Template plus Office licenses | Recurring plan cost |
| Petroleum KPI logic | Built around production, refining, safety, downtime, and margin | Often broader dashboard reporting | Depends on module |
Who This Template Is For – and Who It’s Not For
This template is for petroleum operations managers, refinery analysts, HSE leads, production supervisors, finance controllers, energy consultants, and leadership teams that need a monthly scorecard for oil production, gas production, utilization, margins, downtime, energy, safety, and revenue.
It is not for live SCADA monitoring, refinery process control, regulatory submissions, real-time ERP integration, reserve estimation, or incident investigation workflow. It is a management reporting scorecard built from the values you enter.
How to Use the Petroleum Industry KPI Scorecard in Google Sheets
- Open the PDF guide in your download and use the Google Sheets copy link.
- Choose File > Make a copy to create your own editable version in Google Drive.
- Go to the Data Sheet and replace the sample KPI values in the same monthly layout.
- Update KPI names, formulas, definitions, and UTB/LTB type on the KPI Setting sheet if needed.
- Adjust red, amber, and green thresholds on the RAG Setting sheet.
- Select Month, MTD/YTD, and Vs. PY/Target on the Overview page.
- Use the KPI Trend tab to analyze one metric across MTD and YTD comparisons.
Real-World Use Cases
Ravi, refinery performance manager: reviews refining utilization, energy consumption, capacity utilization, and refining margin before the monthly operations meeting.
Maria, HSE lead: tracks LTIFR, TRIR, and production downtime with Lower-the-Better rules so safety and downtime status indicators are not treated like production growth KPIs.
Daniel, energy finance analyst: compares revenue generated, production metrics, and PY variance before preparing the month-end petroleum performance pack.
Frequently Asked Questions
What KPIs are included?
The template includes Total Oil Production, Refining Utilization Rate, Gas Production, Production Downtime, Energy Consumption, Refining Margin, Capacity Utilization Rate, LTIFR, TRIR, and Revenue Generated.
Does the scorecard support MTD and YTD?
Yes. The Overview and KPI Trend pages support Month-to-Date and Year-to-Date reporting using the same data structure.
Can I compare against target and previous year?
Yes. The scorecard is built for Actual vs Target and Actual vs PY analysis across MTD and YTD views.
Can I change the RAG status thresholds?
Yes. The RAG Setting sheet lets you define separate red, amber, and green Change % thresholds for Upper-the-Better and Lower-the-Better KPIs.
Do I need Apps Script or an add-on?
No. The template is designed as a Google Sheets scorecard. You make a copy, enter your values, and use the built-in sheets.
What do I receive after purchase?
You receive a PDF guide containing the Google Sheets copy link and setup guidance. Use the link to make your own editable copy in Google Drive.
About the Author
Built by PK – Microsoft Certified Professional with 15+ years of Excel, Google Sheets, and Power BI experience. Founder of NextGenTemplates, reaching 300K+ subscribers across YouTube channels. Every template is hand-built and tested before release.
Explore Related Templates
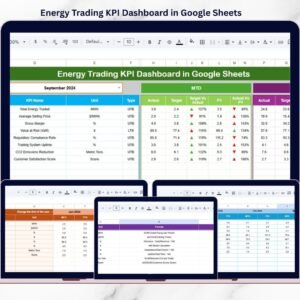
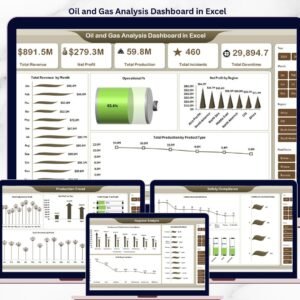
For adjacent energy reporting, review Energy Trading KPI Dashboard in Google Sheets, Petroleum Industry KPI Dashboard in Excel, Oil and Gas Analysis Dashboard in Excel, and Industrial Gas Production Dashboard in Excel. Browse more Google Sheets KPI Dashboard templates and Google Sheets templates.
Add the Petroleum Industry KPI Scorecard in Google Sheets to your cart to start tracking petroleum production, refining, safety, downtime, energy, margin, and revenue KPIs from one editable scorecard. Last updated: August 18, 2026.
Watch the step-by-step video Demo:




















Reviews
There are no reviews yet.