



n today’s world of community programs and social impact initiatives, organizations need a simple yet powerful way to track performance, funding, and outreach. The Social Services Dashboard in Excel is a ready-to-use, interactive solution designed to help NGOs, non-profits, CSR teams, and welfare departments monitor their projects efficiently — all within Excel, without any coding or external software. 🌍📊
This smart template turns raw data into actionable insights, enabling you to visualize program performance, funding allocation, satisfaction scores, and beneficiary reach — all in one place.
💡 Key Features of Social Services Dashboard in Excel
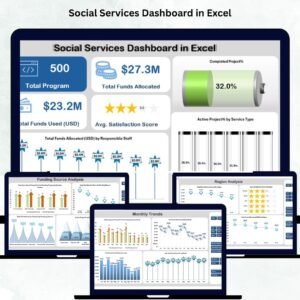
✨ Real-Time Insights: Instantly view key metrics like total programs, allocated funds, used funds, satisfaction scores, and project completion rates.
📈 Dynamic Charts & KPIs: Visualize performance with interactive pivot-based charts and KPI cards.
🗂️ Multi-Dimensional Analysis: Track results by Program Name, Region, and Funding Source.
📅 Monthly Trend Monitoring: Observe progress month-by-month and identify seasonality or performance gaps.
💰 Funding Transparency: Clearly display how much each funding partner contributed and how effectively it was utilized.
👥 Beneficiary Tracking: Monitor outreach, satisfaction, and impact per program or region.
🧩 Completely Customizable: Add your own KPIs, filters, or visual themes without any technical skills.
⚙️ Automation Ready: Compatible with Excel formulas, macros, and slicers for a smoother experience.

📘 What’s Inside the Social Services Dashboard in Excel
The dashboard file is neatly organized into multiple Excel sheets, each serving a unique purpose for better data management and analysis:
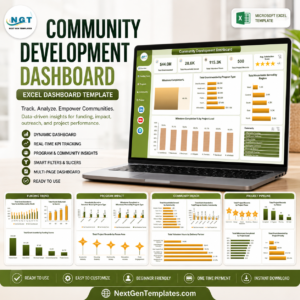
1️⃣ Overview Sheet: Displays KPI cards and summary charts like Funds Allocated vs. Funds Used, Active Projects (%), and Average Satisfaction Score.
2️⃣ Program Name Analysis: Focuses on program-wise performance with visuals for Funds Used, Beneficiaries Served, and Project Status.
3️⃣ Region Analysis: Reveals geographic insights such as Active Project % by Region and Satisfaction Score by Region.
4️⃣ Funding Source Analysis: Evaluates how each funding partner contributes and performs — ideal for donor reports.
5️⃣ Monthly Trends: Captures project completion rates, beneficiaries served, and budget flows over time.
6️⃣ Data Sheet: A clean and structured input area where users enter all program details — ensuring accuracy and automation across visuals.
🧭 How to Use the Social Services Dashboard in Excel
Using this template is simple and intuitive:
✅ Step 1: Enter program details in the Data Sheet — including Program Name, Region, Responsible Staff, Funds, and Satisfaction Scores.
✅ Step 2: Refresh Pivot Tables or Charts to auto-update all visuals.
✅ Step 3: Use Slicers to filter by region, month, or funding source for instant comparisons.
✅ Step 4: Review the Overview Page for management summaries and donor presentations.
✅ Step 5: Customize colors, labels, or KPIs as per your organization’s needs.
With built-in automation and Excel’s pivot functionality, you can go from data to decision in seconds.
👩💼 Who Can Benefit from This Social Services Dashboard
This Excel dashboard is designed for:
🏢 NGOs & Non-Profits: Simplify reporting for multi-program organizations.
💼 CSR Teams: Monitor community investments and showcase measurable impact.
🏛️ Government Agencies: Track welfare schemes and fund utilization transparently.
🎯 Donors & Sponsors: Get clear insights into how funds are allocated and results achieved.
👥 Program Managers: Compare program-wise outcomes and plan improvements.
With its user-friendly design, even non-technical users can analyze performance, track beneficiaries, and demonstrate accountability effectively.
Click here to read the Detailed Blog Post
Watch the step-by-step video tutorial:
Visit our YouTube channel to learn step-by-step video tutorials YouTube.com/@PKAnExcelExpert
Compatibility and Requirements
- Works in Microsoft Excel desktop (Excel 2016 or later, or Microsoft 365).
- The dashboard is built on pivot tables, pivot charts and slicers. Microsoft explains how to filter data with slicers in Use slicers to filter data.
Frequently Asked Questions
Which sheets are included?
Six sheets: Overview, Program Name Analysis, Region Analysis, Funding Source Analysis, Monthly Trends and Data Sheet.
Where do I enter my program data?
Enter it in the Data Sheet. Each row holds details such as Program Name, Region, Responsible Staff, funds and satisfaction scores.
How do I update the charts after adding data?
Refresh the pivot tables or charts and every visual updates. Then use the slicers to filter by region, month or funding source.
Can I report funds by donor or funding partner?
Yes. The Funding Source Analysis sheet shows how much each funding partner contributed and how the funds were used.
Is there a Power BI or Google Sheets version?
Not of this exact dashboard. The Social Services KPI Dashboard in Power BI and the Social Services KPI Dashboard in Google Sheets cover the same topic on those platforms.
Related Social Services Templates
- Social Services KPI Dashboard in Excel: KPI tracking for social service programs
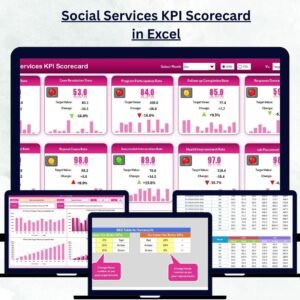
- Social Services KPI Scorecard in Excel: a scorecard view of the same metrics
- Social Services KPI Dashboard in Power BI: the Power BI edition
- Corporate Social Responsibility Dashboard in Excel: for CSR teams tracking community investment
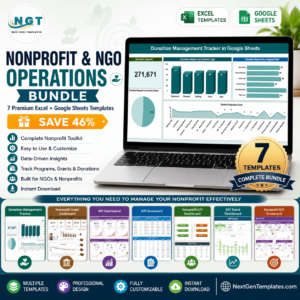
- Nonprofit & NGO Operations Bundle: 7 Excel and Google Sheets templates for nonprofits
Browse all Excel dashboards.

















Reviews
There are no reviews yet.