Modern cities are becoming smarter every day. Governments and municipalities now invest heavily in intelligent transportation systems, smart infrastructure, digital utilities, connected public services, and sustainable urban technologies. Smart Cities Contract Dashboard in Power BI However, managing these large-scale smart city initiatives requires monitoring complex contracts, multiple vendors, regional operations, project managers, and large financial transactions.
Smart Cities Contract Dashboard in Power BI When organizations rely on scattered spreadsheets or disconnected reports, it becomes extremely difficult to track implementation costs, revenue performance, vendor contributions, and overall contract profitability. As a result, project managers often struggle to monitor project progress and financial outcomes effectively.
This is where the Smart Cities Contract Dashboard in Power BI becomes an essential solution.
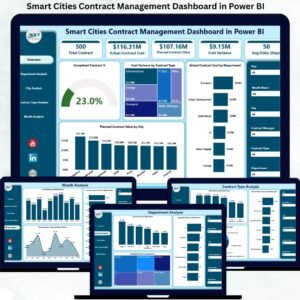
The Smart Cities Contract Dashboard in Power BI is a powerful and interactive analytics tool designed to monitor smart city contract performance, project costs, revenues, profitability, vendor contributions, and operational progress. Instead of analyzing multiple reports, this dashboard centralizes all critical contract metrics into one modern and dynamic Power BI interface.
Using advanced data visualization, KPI cards, interactive charts, and dynamic slicers, the dashboard transforms raw contract data into clear visual insights. Decision-makers can quickly analyze financial performance, track vendor efficiency, and evaluate regional project outcomes in real time.
Because the dashboard is built in Microsoft Power BI, users gain the advantage of powerful business intelligence capabilities, interactive reporting, and advanced data analysis. With just a few clicks, organizations can filter project data by project manager, vendor, region, or time period to uncover meaningful insights.
Whether you are managing intelligent transportation systems, smart lighting infrastructure, IoT networks, public safety technologies, or smart utility systems, this dashboard helps governments and organizations monitor contracts more effectively and make data-driven decisions.
🚀 Key Feature of Smart Cities Contract Dashboard in Power BI
The dashboard provides advanced analytics features designed specifically for smart city contract monitoring.
📊 Interactive KPI Cards – Instantly monitor key performance indicators such as implementation cost, revenue, profit, completion percentage, and profit margin.
📈 Multi-Page Analytical Dashboard – Five dedicated analytical pages provide deep insights into project performance.
🎯 Dynamic Data Filtering – Interactive slicers allow users to filter contracts by vendor, region, project manager, and time period.
👨💼 Project Manager Performance Analysis – Evaluate leadership effectiveness through ROI, revenue generation, and contract management metrics.
🏢 Vendor Performance Monitoring – Analyze vendor contributions, profit generation, and overdue payment percentages.
🌍 Regional Project Insights – Understand how smart city contracts perform across different regions and locations.
📅 Monthly Financial Trend Analysis – Monitor financial trends such as revenue, profit margin, and implementation cost over time.
⚡ Advanced Data Visualization – Power BI charts and graphs transform complex contract data into actionable insights.
📦 What’s Inside the Smart Cities Contract Dashboard in Power BI
This ready-to-use Power BI dashboard includes multiple analytical pages designed to provide complete contract performance insights.
📊 Overview Page

This is the main dashboard page that summarizes overall contract performance with KPI cards and charts such as:
• Implementation Cost by Payment Status
• Active Contract Percentage
• Profit by Project Manager
• Profit Margin by Region
👨💼 Project Manager Analysis Page
Analyze project leadership performance through metrics such as revenue generation, ROI percentage, and active contract count.
🏢 Vendor Analysis Page
Monitor vendor performance with charts showing revenue contribution, profit generation, and overdue payment percentages.
🌍 Region Analysis Page
Evaluate regional project performance through revenue, profit, and implementation cost analysis.
📅 Monthly Trends Page
Track financial trends across months including implementation cost, revenue fluctuations, and profit margin performance.
🛠 How to Use the Smart Cities Contract Dashboard in Power BI
Using this dashboard is simple and efficient.
1️⃣ Connect your smart city contract data source to the Power BI dashboard.
2️⃣ Update contract data including revenue, implementation cost, vendor, and region information.
3️⃣ Refresh the dashboard to update all charts and KPI cards automatically.
4️⃣ Use interactive slicers to filter data by vendor, project manager, region, or time period.
5️⃣ Analyze insights to monitor contract performance and support strategic decision-making.
With this streamlined workflow, organizations can eliminate manual reporting and gain instant visibility into project performance.
👥 Who Can Benefit from This Smart Cities Contract Dashboard in Power BI
This dashboard is designed for professionals responsible for managing smart city initiatives.
🏛 Government Agencies – Monitor smart city contract performance and financial outcomes.
🏗 Urban Development Authorities – Track implementation costs and regional project success.
👨💼 Project Managers – Evaluate project profitability and contract completion progress.
🤝 Contract Management Teams – Monitor vendor performance and payment behavior.
🏢 Technology Vendors & Contractors – Analyze project contributions and financial results.
📊 Policy Makers & City Planners – Use data insights to guide urban development strategies.
With powerful analytics and centralized reporting, this dashboard helps organizations manage smart city projects more efficiently and confidently.
### Click hare to read the Detailed blog post
Visit our YouTube channel to learn step-by-step video tutorials
👉 https://youtube.com/@PKAnExcelExpert
Watch the step-by-step video tutorial:
Compatibility and Requirements
- Works in Power BI Desktop, which is free to download from Microsoft. Microsoft explains the install in Get Power BI Desktop.
- You connect your own smart city contract data (revenue, implementation cost, vendor, region and project manager) to the dashboard.
Frequently Asked Questions
Which pages does the dashboard have?
Five pages: Overview, Project Manager Analysis, Vendor Analysis, Region Analysis and Monthly Trends.
Can I filter the data?
Yes. Slicers let you filter contracts by vendor, region, project manager and time period.
What can I track about vendors?
The Vendor Analysis page shows revenue contribution, profit generation and overdue payment percentages for each vendor.
How do I update it with my own data?
Connect your contract data source, update the revenue, implementation cost, vendor and region information, then refresh the dashboard. All charts and KPI cards update automatically.
Is there an Excel version?
Yes. See the Smart Cities Contract Dashboard in Excel.
Related Smart Cities Templates
- Smart Cities Contract Dashboard in Excel: the same contract view in Excel
- Smart Cities Contract Management Dashboard in Power BI: another Power BI view of contract management
- Smart Cities Contract KPI Dashboard in Power BI: a KPI-focused contract dashboard
- Smart Cities Project Management Dashboard in Power BI: project tracking for smart city work
- Power BI Dashboard Mega Collection: 15 Power BI templates in one download
Browse all Power BI dashboards.