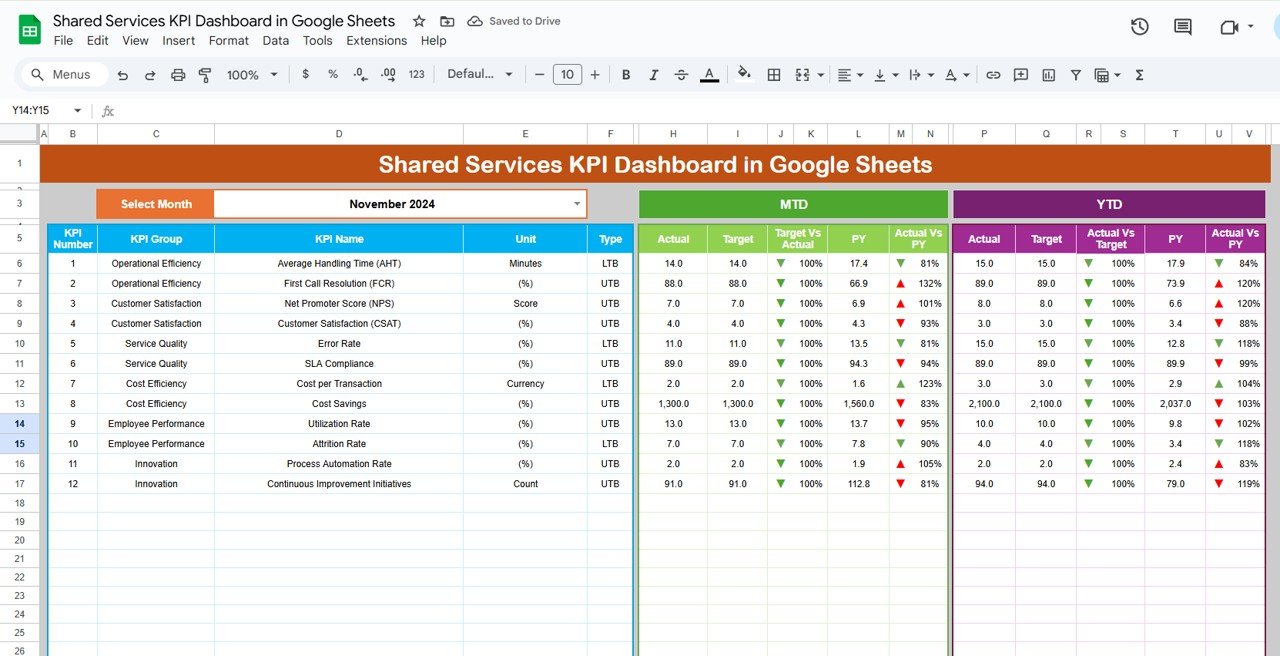
Efficiently managing shared services across various departments such as HR, IT, finance, and procurement is critical for any organization. The Shared Services KPI Dashboard in Google Sheets is a powerful tool designed to provide organizations with real-time insights into the performance of these services. By consolidating key performance indicators (KPIs) into a single, interactive dashboard, organizations can track efficiency, identify bottlenecks, and make informed, data-driven decisions.
Key Features:
-
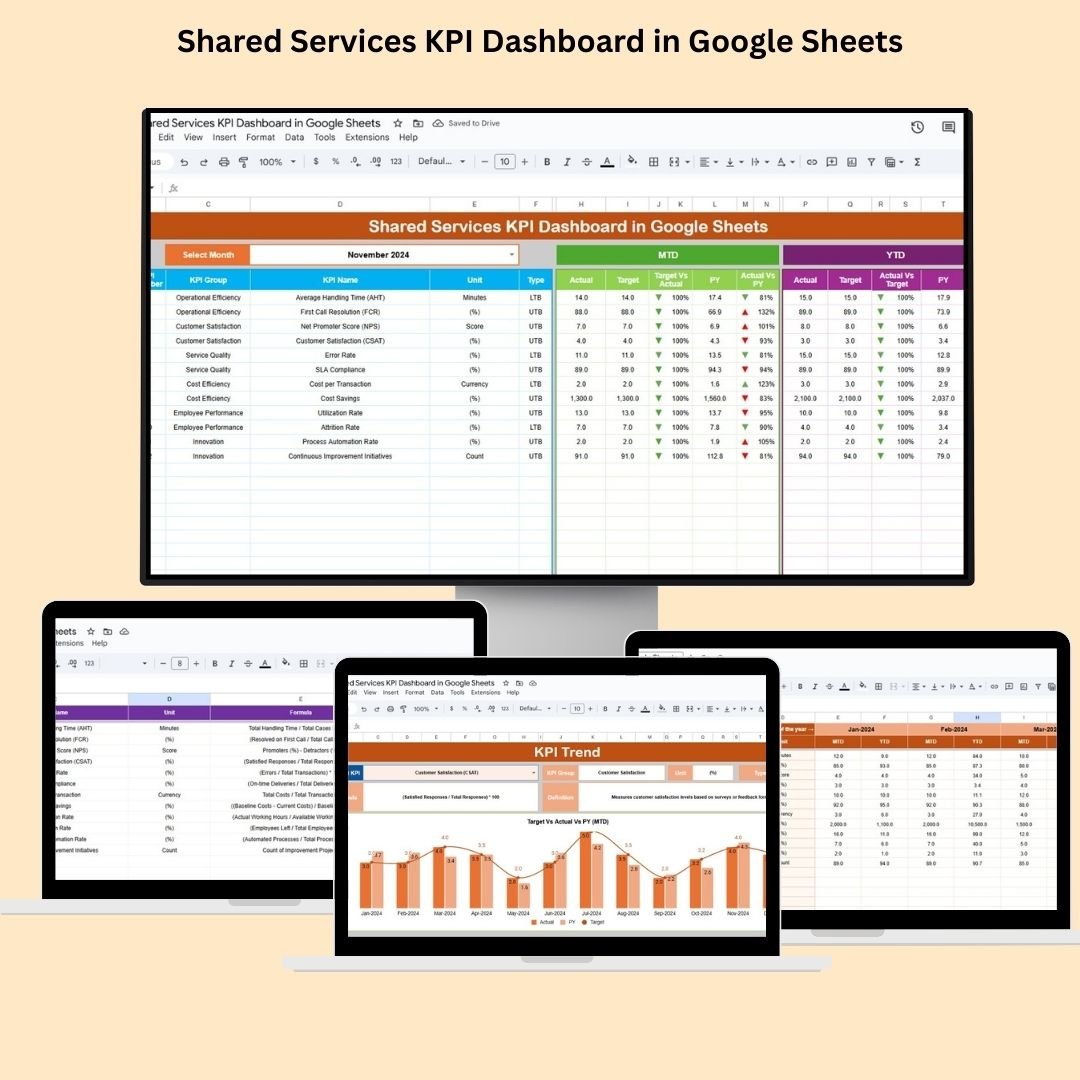
Centralized Data Visualization: This dashboard integrates performance data from various shared services departments into a unified view. It provides a clear snapshot of how each department is performing across essential KPIs, making it easier for managers and stakeholders to monitor and compare results.
-
Customizable KPIs: The template is customizable, allowing you to track KPIs that are most relevant to your organization’s shared services functions. Whether it’s employee satisfaction in HR, system uptime in IT, or budget variance in finance, you can modify the dashboard to fit your specific needs.
-
Real-Time Updates: The dashboard is designed to update automatically with the latest data inputs, providing real-time performance metrics. This ensures that you always have access to the most current information, enabling faster decision-making.
-
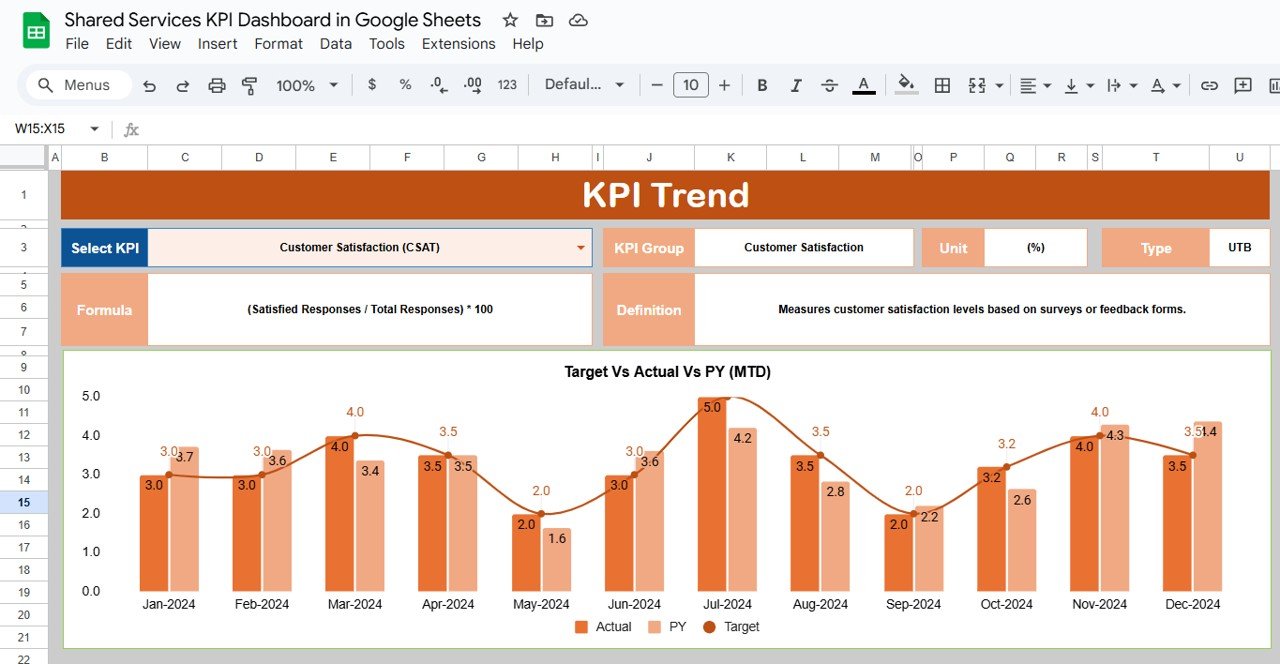
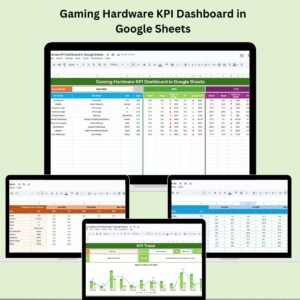
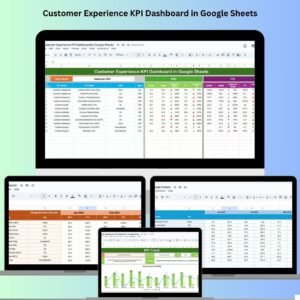
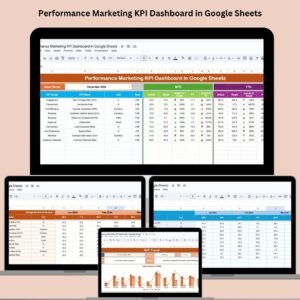
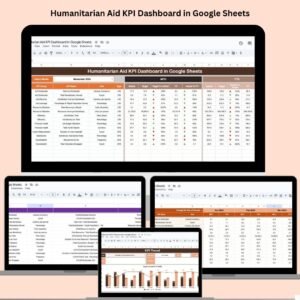
User-Friendly Interface: With its intuitive design, the dashboard is easy to navigate. Key metrics are visually represented through graphs and charts, which makes understanding performance trends and insights quicker and more accessible.
-
Data Comparison: The dashboard allows you to compare current performance against targets, historical data, and benchmarks. This feature helps identify areas of success and opportunities for improvement.
Benefits:
-
Improved Decision-Making: With real-time insights into shared services performance, managers and executives can make data-driven decisions that optimize operations and address potential issues before they escalate.
-
Enhanced Operational Efficiency: The dashboard enables organizations to spot inefficiencies and bottlenecks, leading to optimized processes and better resource allocation across departments.
-
Increased Accountability: By tracking KPIs and displaying performance data transparently, shared services teams are held accountable for meeting their targets. This fosters a culture of performance and continuous improvement.
-
Streamlined Reporting: The dashboard eliminates the need for complex, time-consuming reporting by providing a one-stop solution for tracking and reporting shared services performance.
How to Use:
-
Access the Template: Open the provided Google Sheets link to access the KPI dashboard template.
-
Customize the KPIs: Tailor the dashboard to track the KPIs that are most relevant to your shared services functions. Add or remove metrics based on your organizational goals.
-
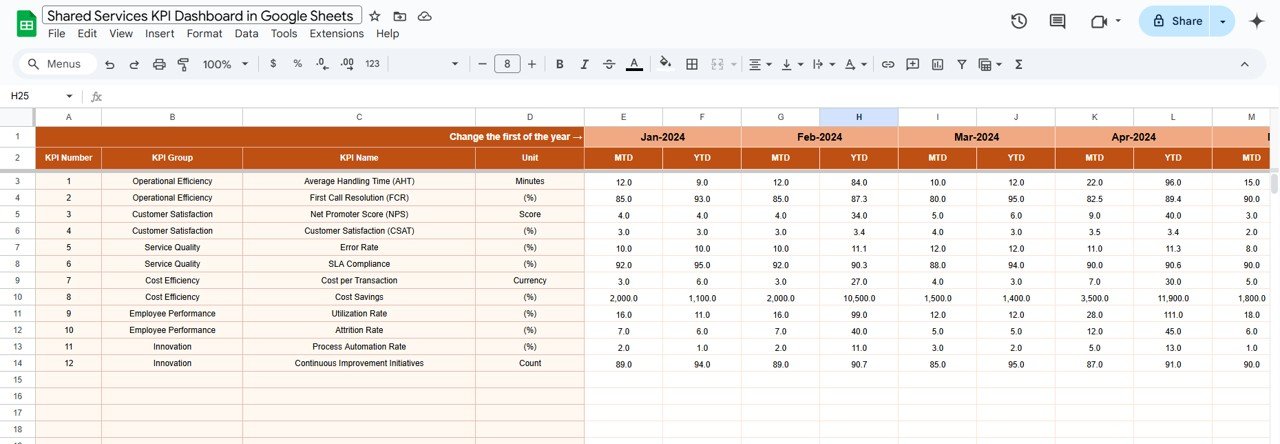
Input Data: Enter the actual performance data into the dashboard. This may include operational metrics, financial data, employee feedback, and other relevant information.
-
Monitor Performance: Regularly check the dashboard to monitor the performance of your shared services departments. The real-time data will give you an up-to-date view of how each function is performing.
-
Analyze Trends: Use the dashboard’s historical data comparison feature to analyze trends, identify areas of improvement, and celebrate successes.
Conclusion:
The Shared Services KPI Dashboard in Google Sheets is a must-have tool for organizations looking to optimize their shared services functions. By consolidating and visualizing key performance metrics, it enables real-time monitoring and actionable insights that can improve efficiency, reduce costs, and enhance overall service delivery. Whether you’re in HR, IT, finance, or procurement, this dashboard provides a clear, data-driven approach to performance management.
🔗 Click here to read the Detailed blog post
Visit our YouTube channel to learn step-by-step video tutorials
Youtube.com/@PKAnExcelExpert









Reviews
There are no reviews yet.