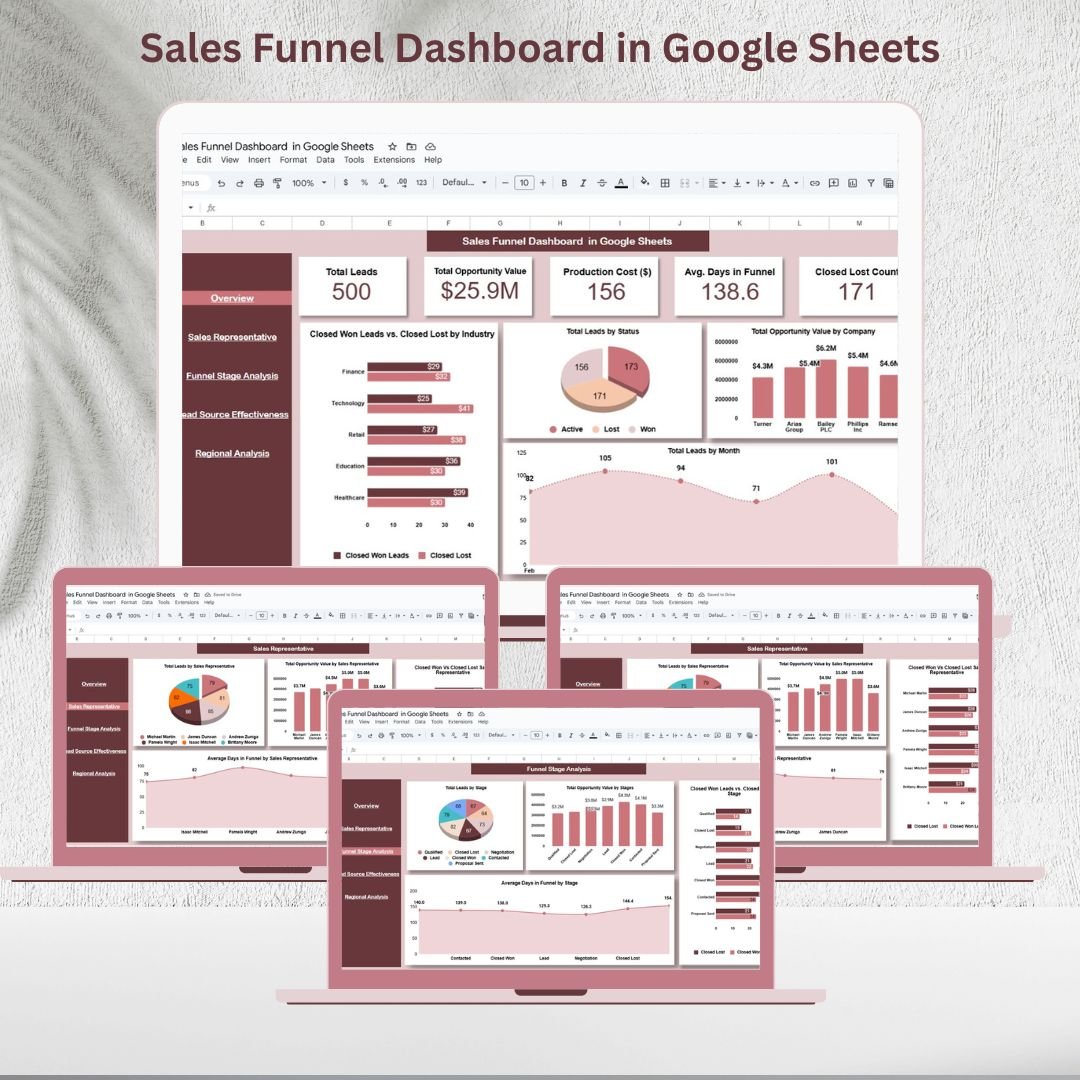
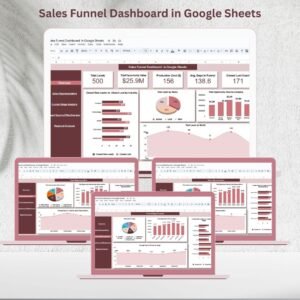
Converting leads into customers is the backbone of every successful business. Yet, without a structured system, managing leads, opportunities, and sales performance can quickly become overwhelming. The Sales Funnel Dashboard in Google Sheets is a ready-to-use, interactive template designed to simplify sales pipeline management while giving real-time insights into every stage of the funnel.Sales Funnel Dashboard in Google Sheets
Whether you’re a startup founder, sales manager, or part of a large sales team, this dashboard helps you track leads, monitor conversions, evaluate team performance, and forecast revenue with ease. Because it’s built in Google Sheets, the dashboard is collaborative, customizable, and accessible from anywhere.Sales Funnel Dashboard in Google Sheets
🔑 Key Features of the Sales Funnel Dashboard in Google Sheets
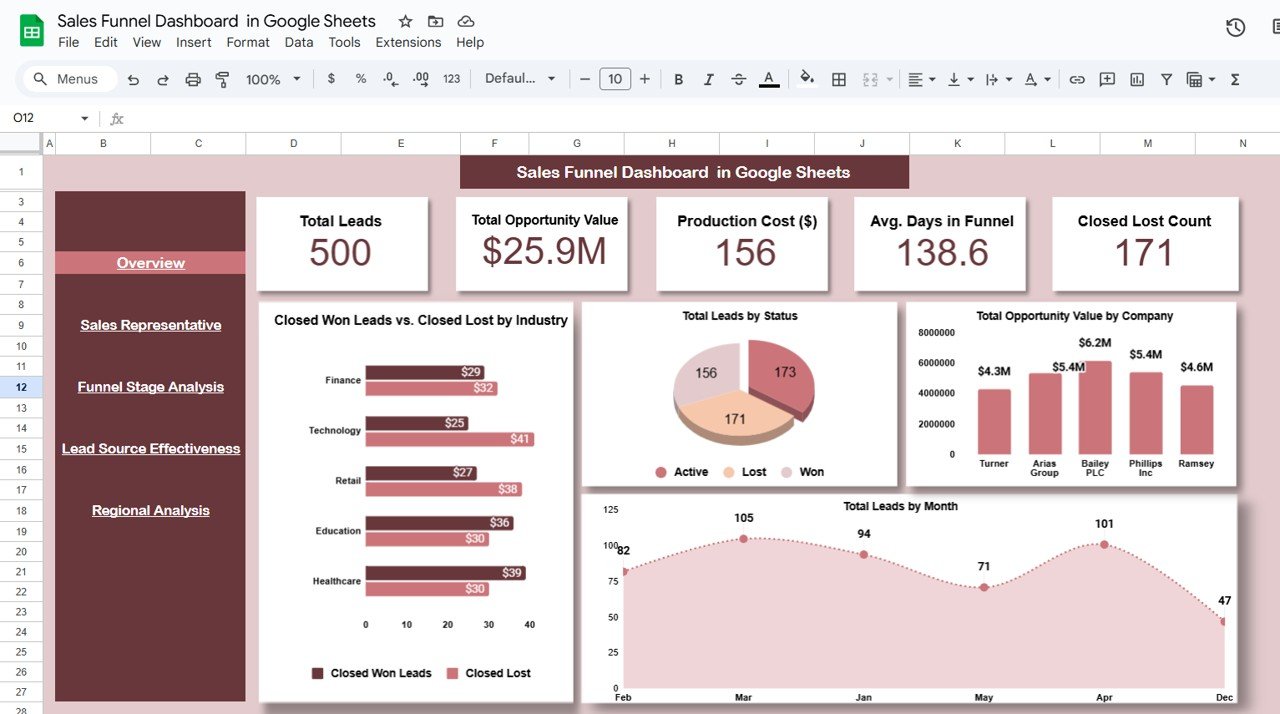
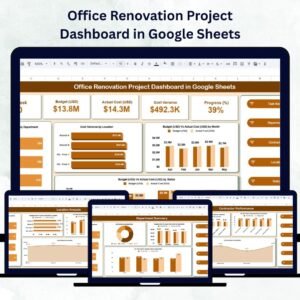
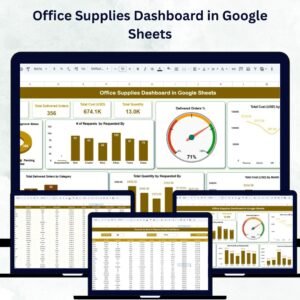
📌 Overview Sheet
-
High-level snapshot of your entire funnel
-
KPI Cards: Total Leads, Total Opportunity Value, Closed Won, Closed Lost, Avg. Days in Funnel
-
Charts: Closed Won vs Lost by Industry, Leads by Status, Opportunity Value by Company, Leads by Month
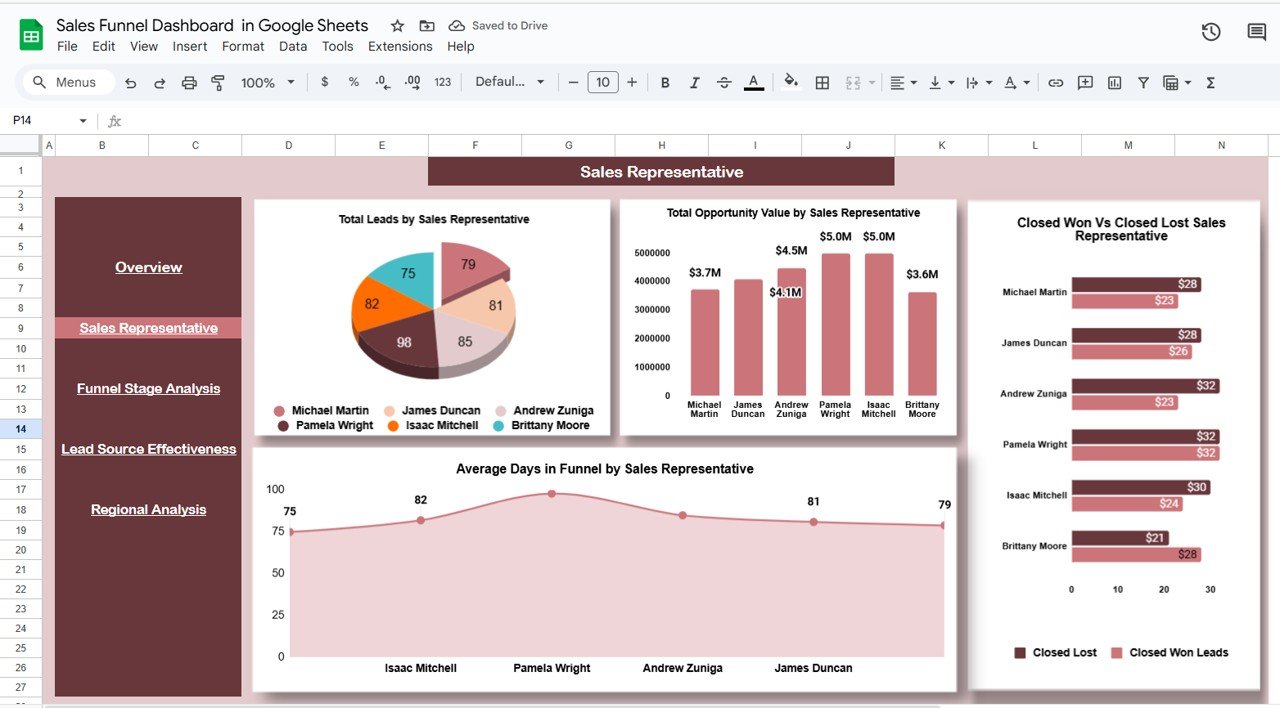
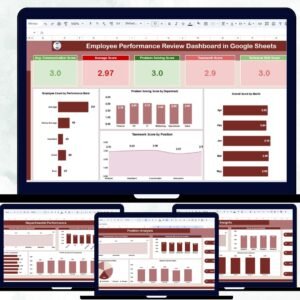
👩💼 Sales Representative Sheet
-
Evaluate performance of individual sales reps
-
Charts: Total Leads by Rep, Opportunity Value by Rep, Closed Won vs Lost by Rep, Avg. Days in Funnel by Rep
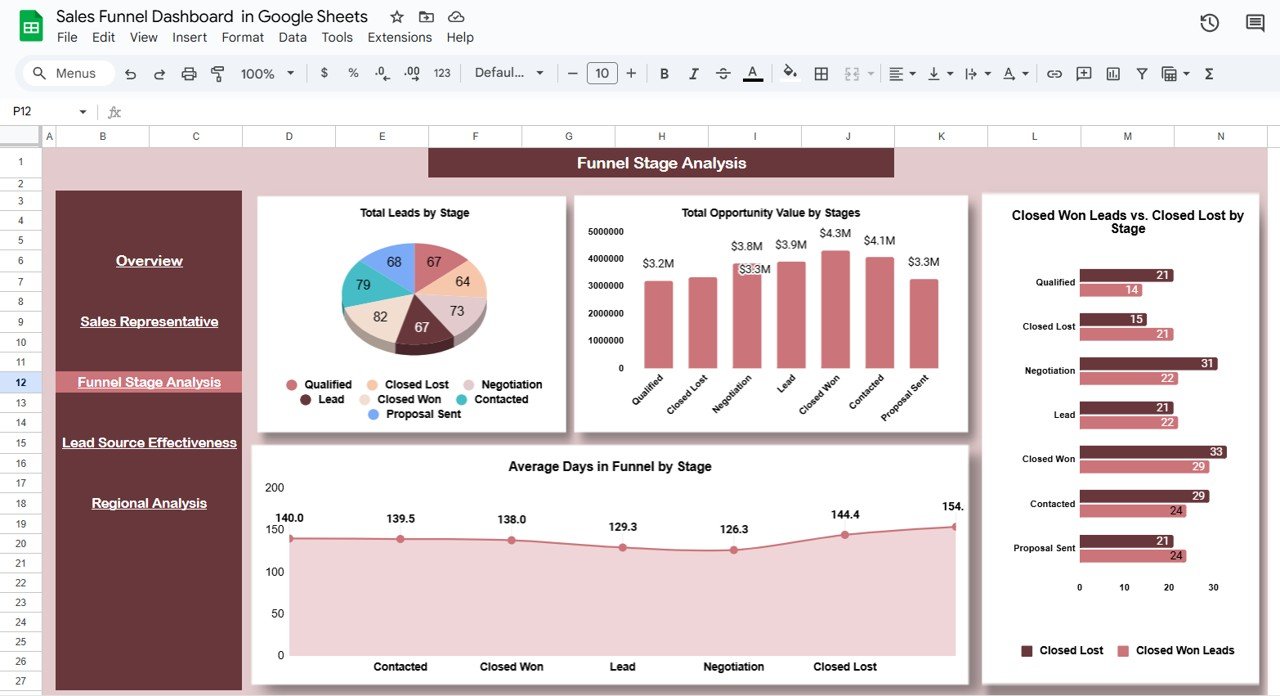
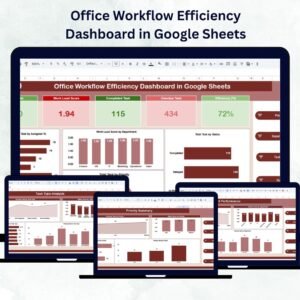
📈 Funnel Stage Analysis
-
Identify bottlenecks in each stage of the pipeline
-
Charts: Leads by Stage, Opportunity Value by Stage, Closed Won vs Lost by Stage, Avg. Days in Funnel by Stage
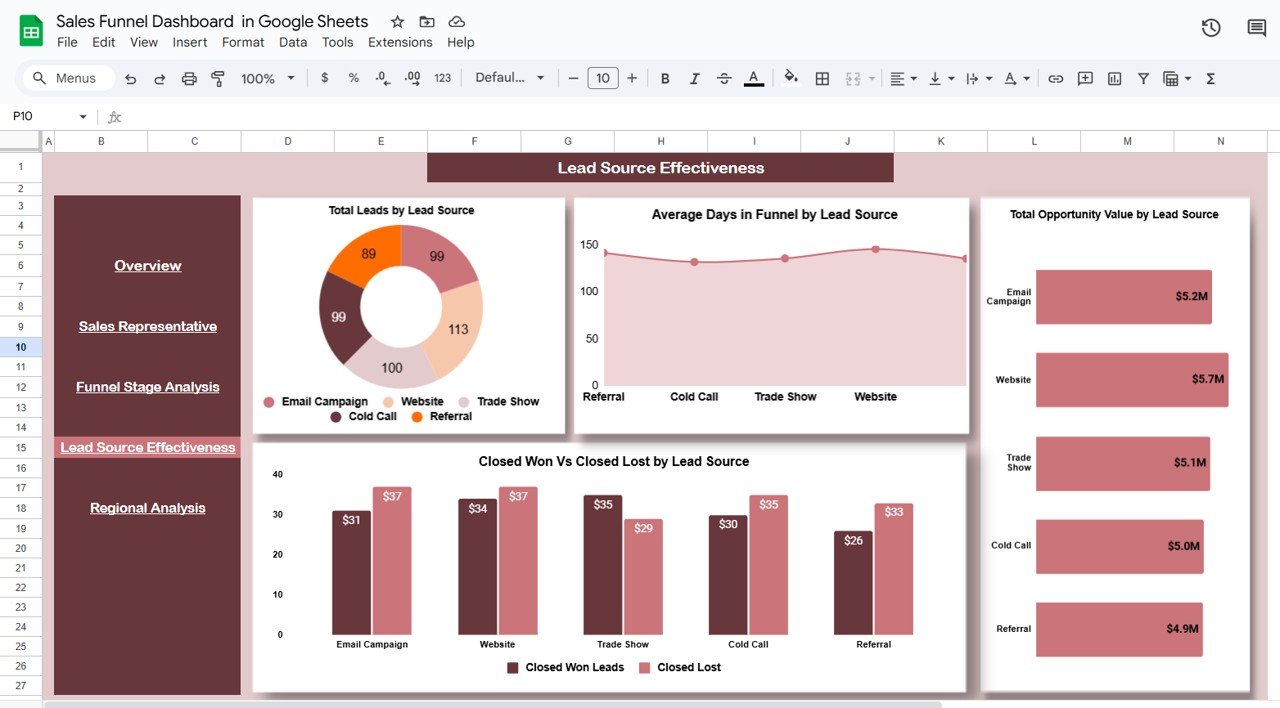
📊 Lead Source Effectiveness
-
Discover which channels drive the best results
-
Charts: Leads by Source, Avg. Days in Funnel by Source, Opportunity Value by Source, Won vs Lost by Source
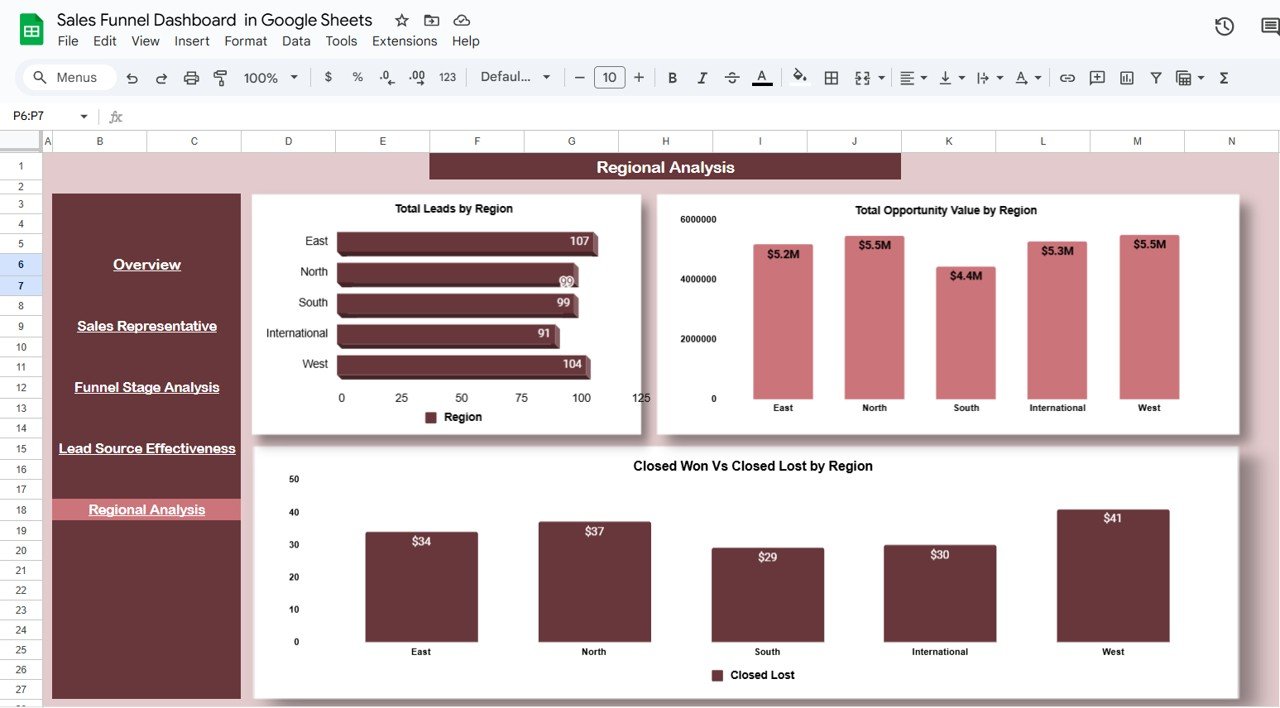
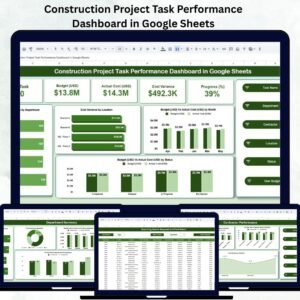
🌍 Regional Analysis
-
Track performance across geographies
-
Charts: Leads by Region, Opportunity Value by Region, Closed Won vs Lost by Region
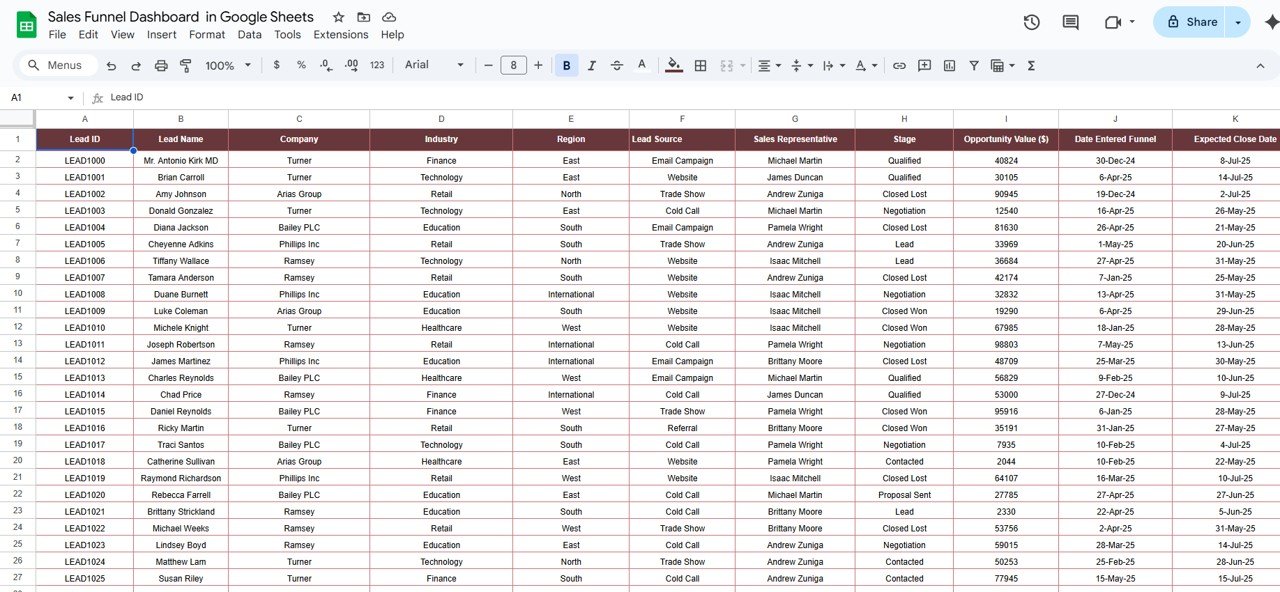
🧾 Data Sheet
-
Centralized input for all leads and opportunities
-
Captures details like source, stage, sales rep, region, and status
-
Updates flow automatically across all sheets for real-time reporting
📦 What’s Inside the Sales Funnel Dashboard?
✅ Overview Dashboard – Sales pipeline KPIs & trends
✅ Rep Performance Dashboard – Insights into individual sales reps
✅ Stage Analysis Dashboard – Track performance by funnel stage
✅ Lead Source Dashboard – Measure effectiveness of marketing & sales channels
✅ Regional Dashboard – Compare performance across locations
✅ Data Entry Sheet – Clean and structured input system
👩💼 Who Can Benefit from This Dashboard?
💼 Sales Managers – Monitor conversions, rep performance, and pipeline health
📊 Business Owners – Forecast revenue and identify high-value leads
🏢 Startups & SMEs – Gain visibility into sales trends without expensive CRM tools
🎯 Marketing Teams – Evaluate which lead sources deliver the best ROI
🌍 Large Enterprises – Track multi-region and multi-rep pipelines collaboratively
🧪 How to Use the Sales Funnel Dashboard
-
Enter Lead Data – Add leads, opportunities, values, sources, and reps in the Data Sheet
-
Review KPIs – Monitor funnel health via KPI cards and charts
-
Analyze Performance – Drill into sales rep, stage, source, or region
-
Spot Bottlenecks – Identify stalled leads and underperforming stages
-
Forecast Revenue – Use opportunity values to predict future sales
-
Collaborate in Real-Time – Share with your sales team for instant updates
🌟 Advantages of the Sales Funnel Dashboard
-
📊 Centralized Sales Data – Track everything in one place
-
🚦 Real-Time Monitoring – Update data and see instant results
-
🔍 Identify Bottlenecks – Spot stalled leads by stage or rep
-
🏆 Evaluate Team Performance – Compare reps, sources, and regions
-
📈 Forecast Revenue – Use opportunity values to project sales
-
🛠 Customizable – Add/remove KPIs to fit your business process
🚀 Why Choose This Dashboard?
Unlike costly CRMs, this Google Sheets solution provides a lightweight, powerful, and flexible way to manage your sales funnel. It gives you the same insights—without the complexity or extra cost.
With this dashboard, you’ll be able to:
✔ Maximize lead conversion rates
✔ Improve sales team performance
✔ Focus on high-value opportunities
✔ Optimize lead sources and marketing channels
Perfect for sales-driven businesses of all sizes, this dashboard ensures your pipeline is organized, visualized, and optimized for growth.
🔗 Click here to read the Detailed blog post
Watch the step-by-step video Demo:


Reviews
There are no reviews yet.