

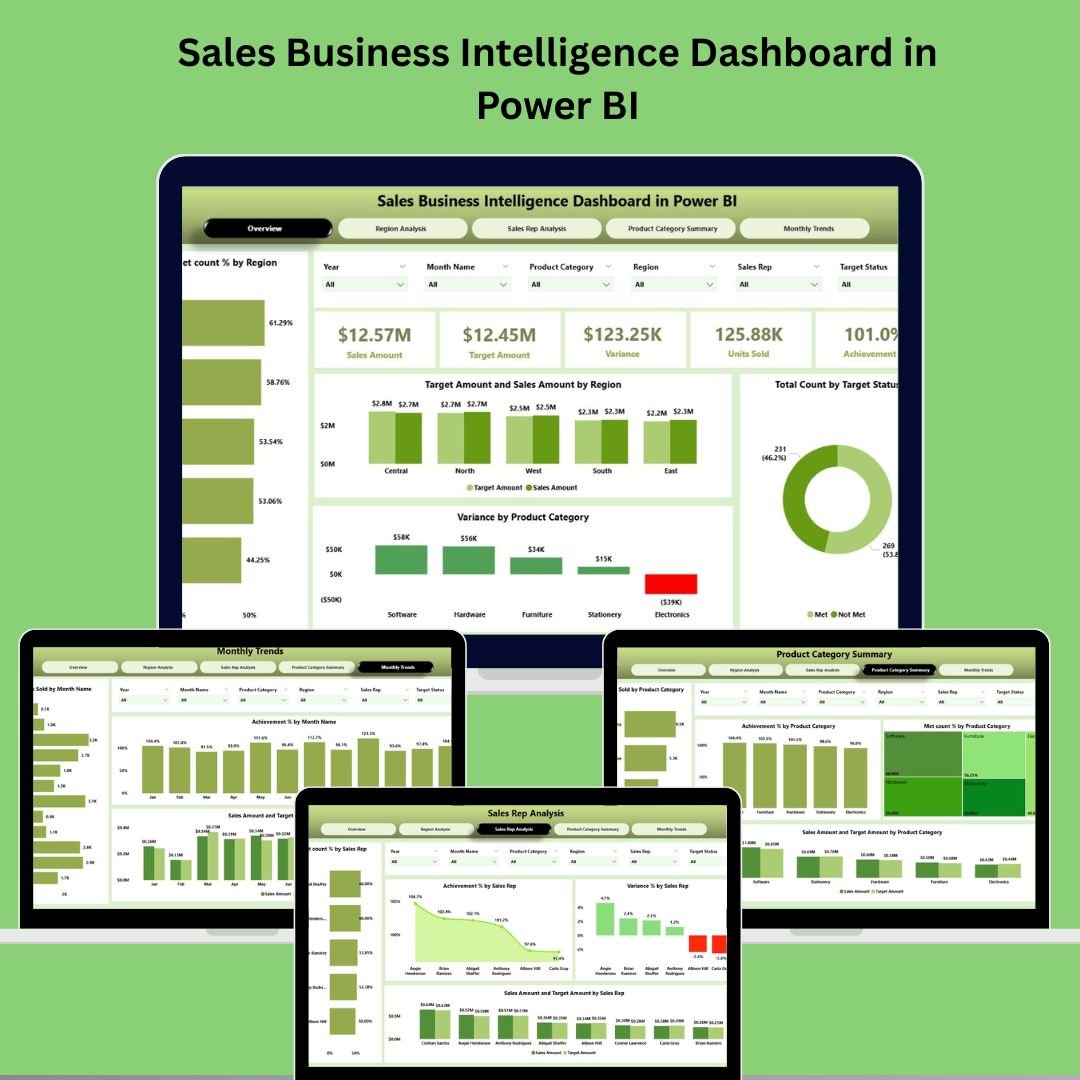
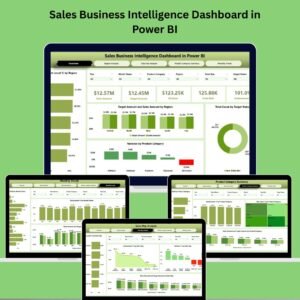
🚀 Introducing the Sales Business Intelligence Dashboard in Power BI – your all-in-one, interactive solution for real-time sales analysis. Designed for sales teams, business leaders, and analysts, this dashboard helps you monitor sales KPIs, track performance across regions and reps, and uncover trends by product category and timeline—all without complex coding.
From decision-making to strategy execution, this is your sales command center.
✅ Key Features of Sales Business Intelligence Dashboard in Power BI
🧭 Overview Page – Your Control Tower
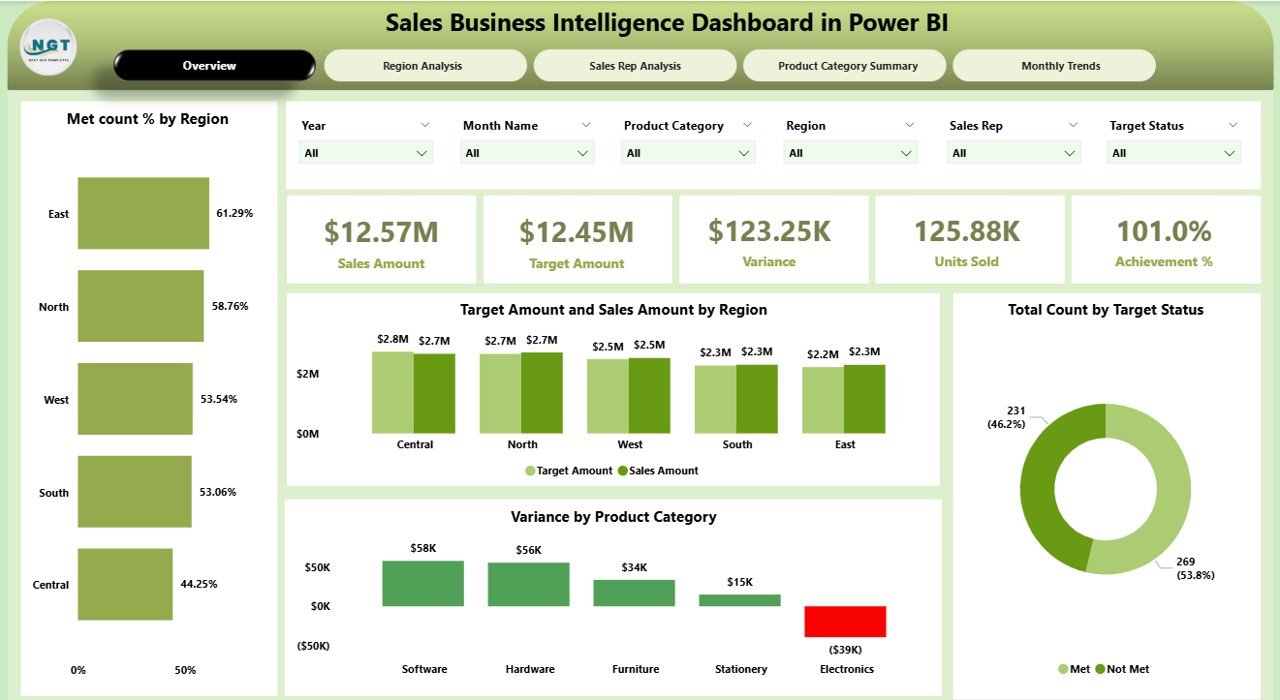
See your entire sales performance at a glance with:
📌 6 Smart Slicers (Region, Product, Time, Sales Rep, etc.)
📊 5 KPI Cards:
Total Sales
Target Sales
Variance
Achievement %
Met Count %
📈 4 Charts:
Met Count % by Region
Target vs. Sales by Region
Target Status Summary
Variance by Product Category
Great for executive-level snapshots and quick performance audits.
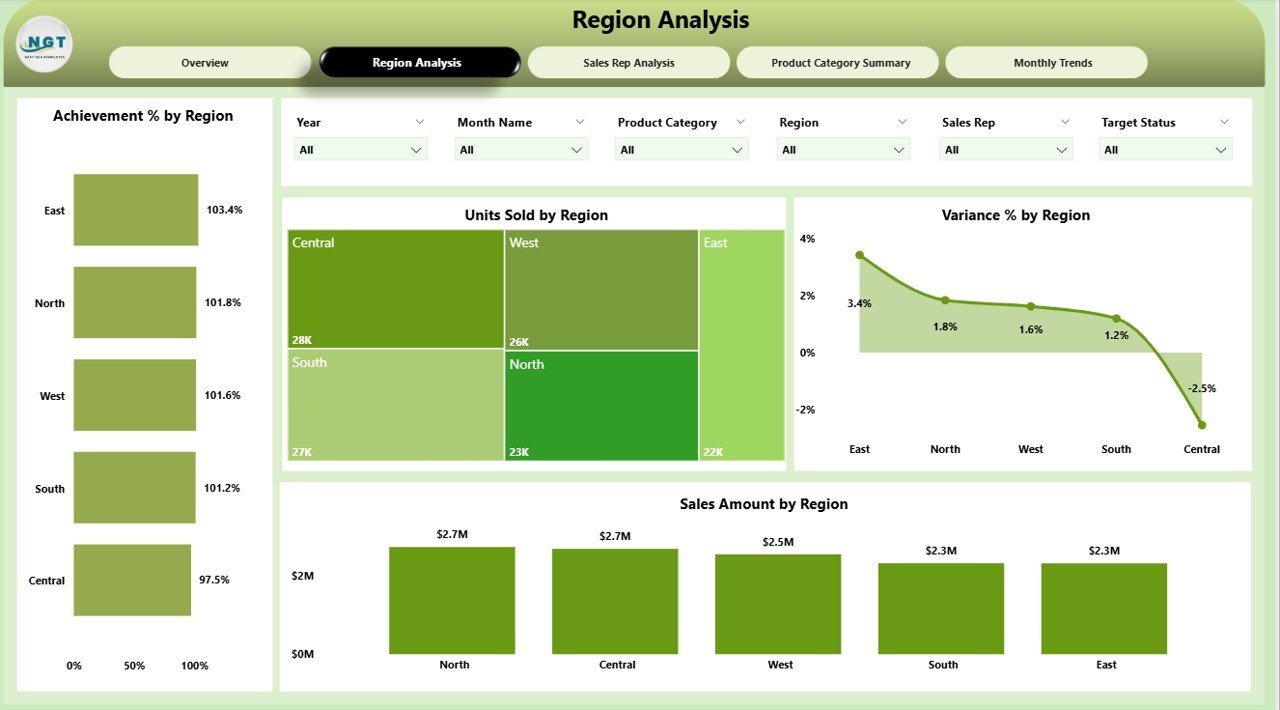
🌍 Region Analysis – Zoom into Geographic Sales
Break down performance by region with:
🎯 Achievement % by Region
📦 Units Sold
📉 Variance %
💰 Sales Amount by Region
Use filters to spot growth zones and underperforming territories.
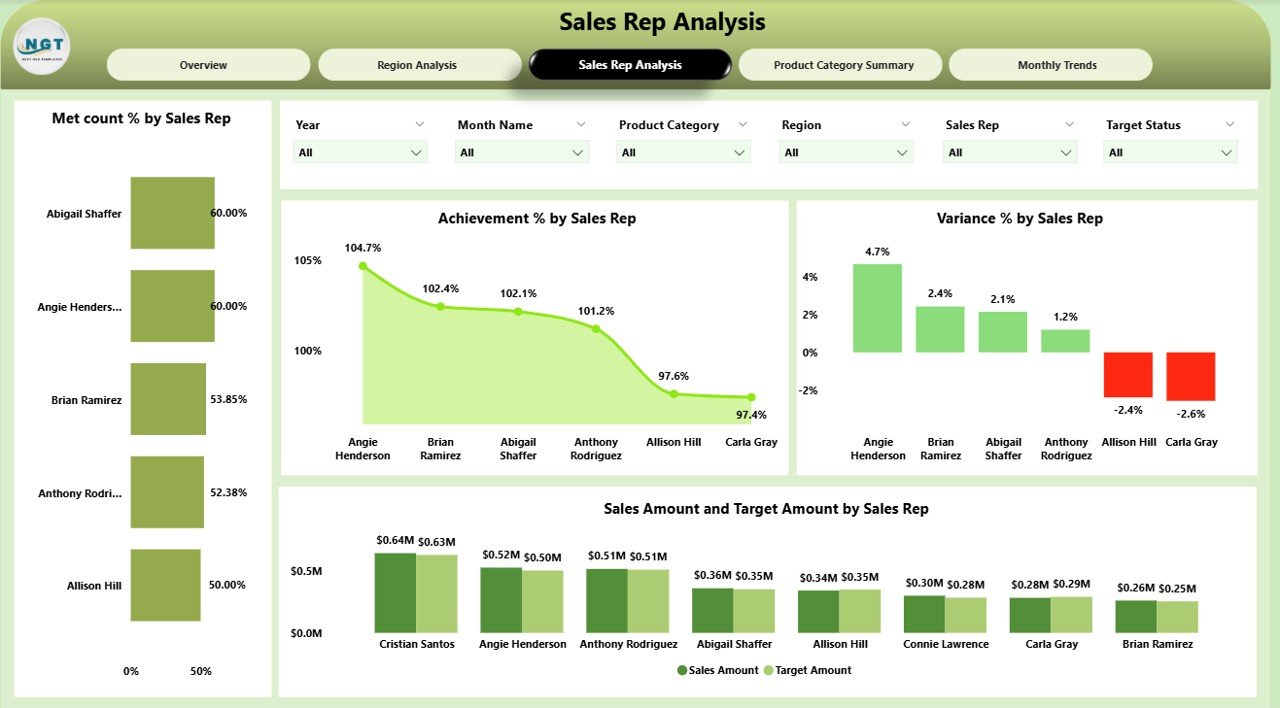
🧑💼 Sales Rep Analysis – Evaluate Individual Success
Identify top performers and coaching opportunities:
📊 Charts for Achievement %, Variance %, and Target vs. Sales
🧮 Drill-throughs for rep-specific insights
🎯 Met Count % breakdown
Perfect for boosting accountability and team engagement.
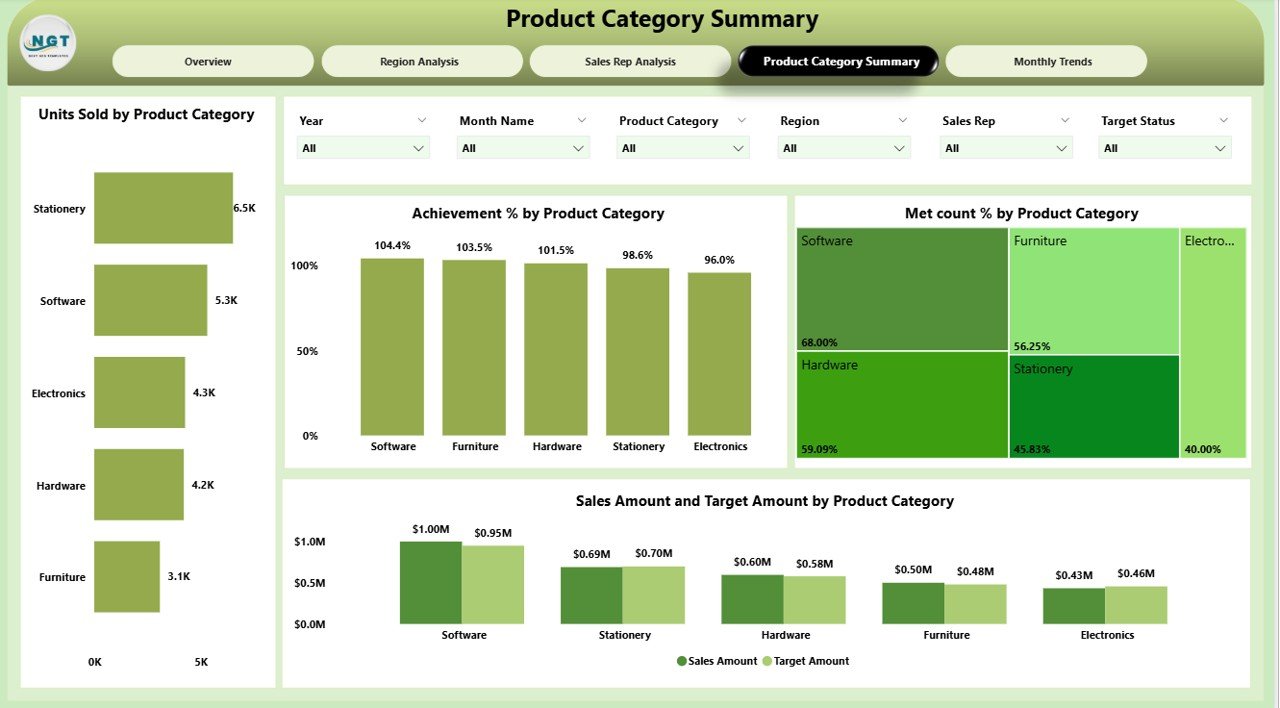
📦 Product Category Summary – Know What Sells Best
Dive deep into product line performance:
🧾 Units Sold by Product Category
✅ Achievement %
📊 Met Count %
🔄 Target vs. Sales by Product
Optimize inventory, focus marketing, and make smarter product decisions.
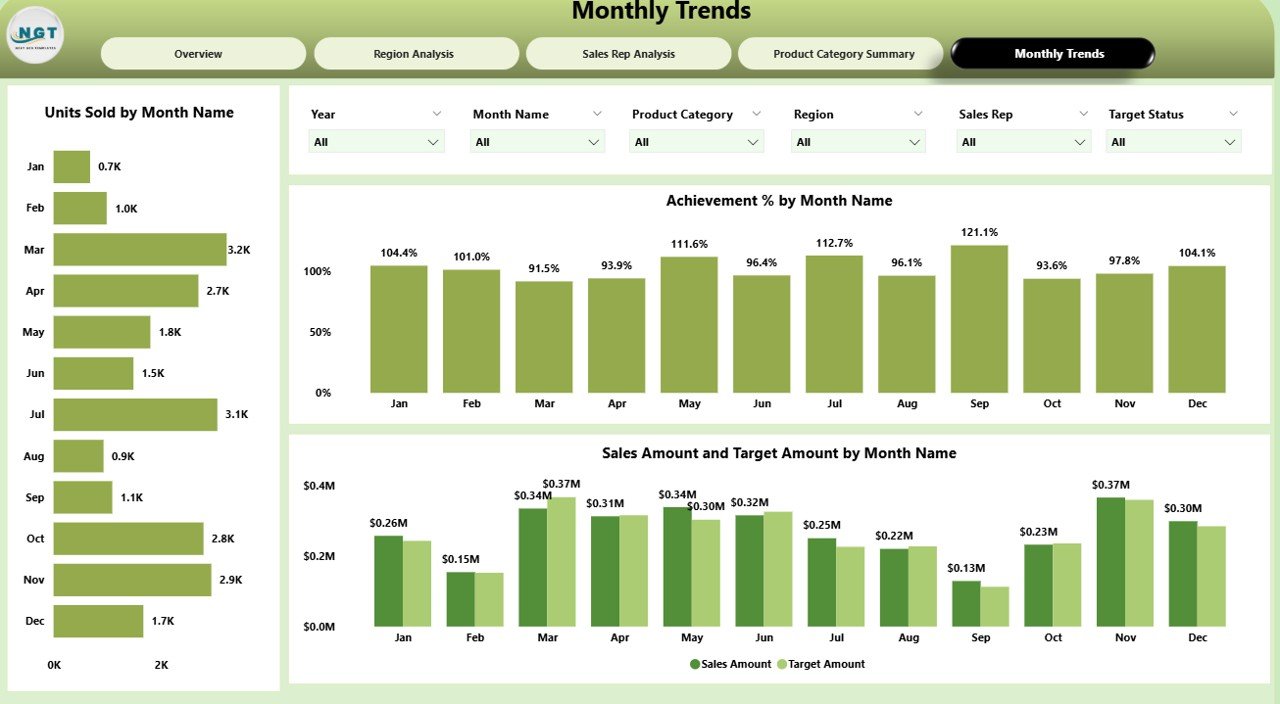
📅 Monthly Trends – Uncover Sales Patterns Over Time
Stay ahead of seasonality:
📈 Units Sold by Month
🟢 Achievement % Trend
🔄 Sales vs. Target by Month
Great for forecasting and planning campaigns or budgets.
📦 What’s Inside the Sales BI Dashboard Package?
✅ 5 Key Pages:
Overview
Region Analysis
Sales Rep Analysis
Product Category Summary
Monthly Trends
📁 Powered By:
Power BI Desktop
Excel data source (easy to maintain)
DAX for calculations
Slicers, Cards, Charts – no coding required
🔄 Fully customizable. Ready to plug in your own sales data.
🛠️ How to Use the Sales Business Intelligence Dashboard
📥 Download & Open the Power BI file
📊 Connect Excel Data (included or your own source)
🧠 Explore Pages via the left pane
🔍 Use Slicers to filter by region, rep, product, or time
📈 View KPIs, Charts, and Trends in real-time
📤 Share or Export to PDF, PowerPoint, or Teams
No technical knowledge needed—just insights that drive results.
👥 Who Can Benefit from This Dashboard?
🧑💼 Sales Managers – Track goals, reps, and territories
📊 Business Analysts – Dive into deep performance trends
🧑💻 Executives – View real-time, board-ready reports
📦 Product Managers – Monitor category-level sales
🏢 Retail, SaaS, B2B, B2C, and Startup Teams – Any sales-driven business!











Reviews
There are no reviews yet.