

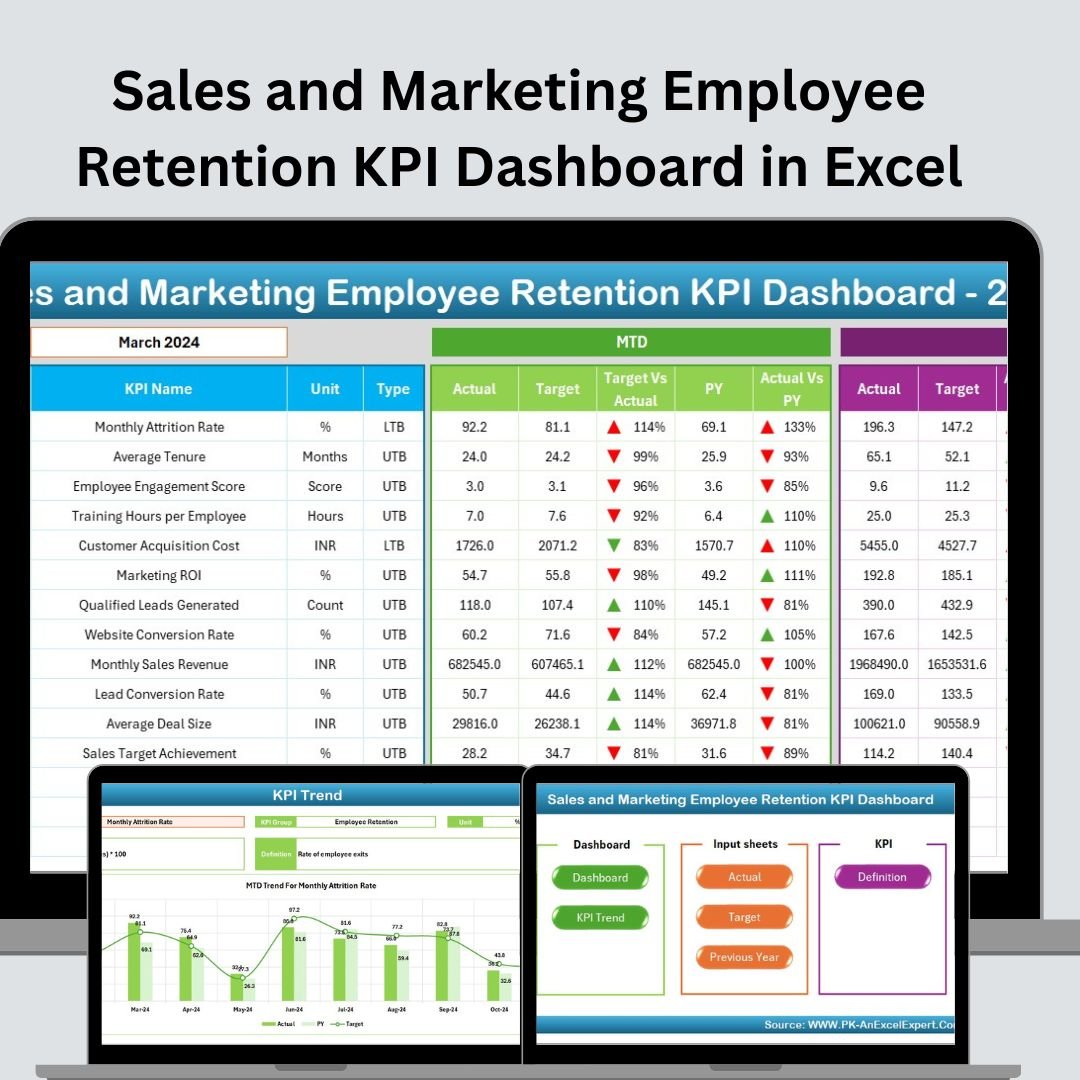
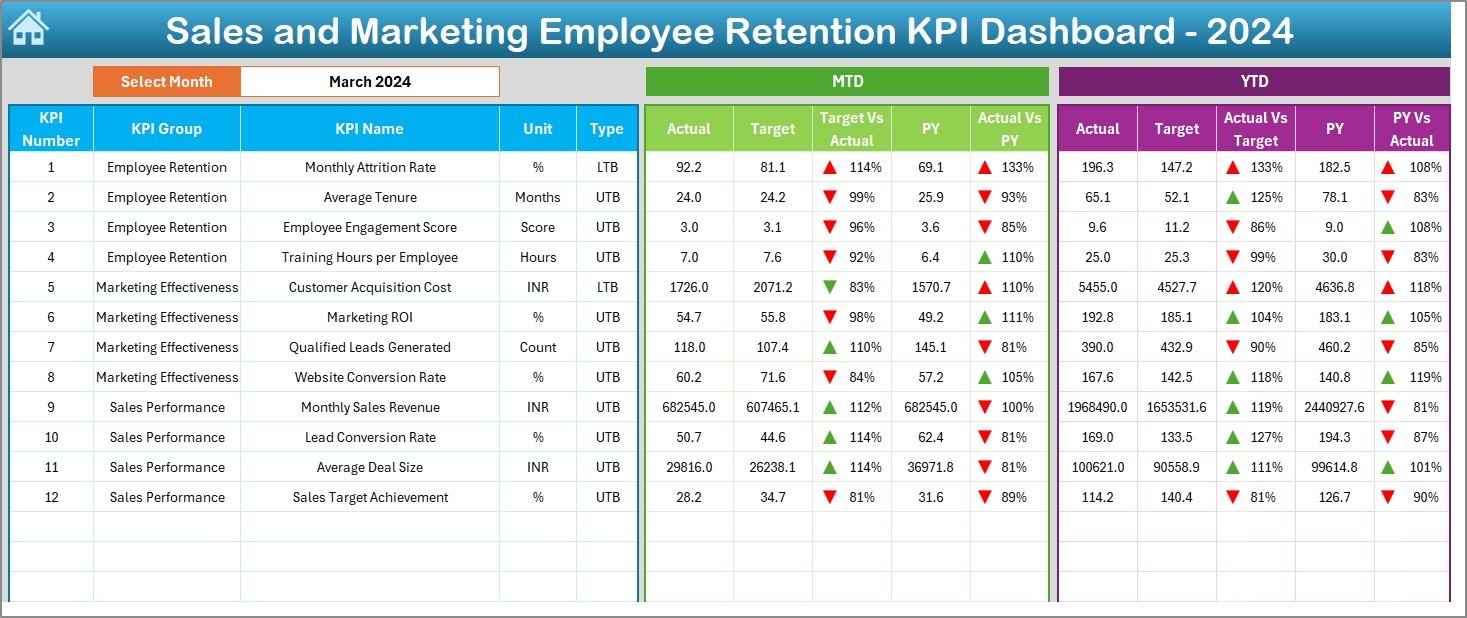
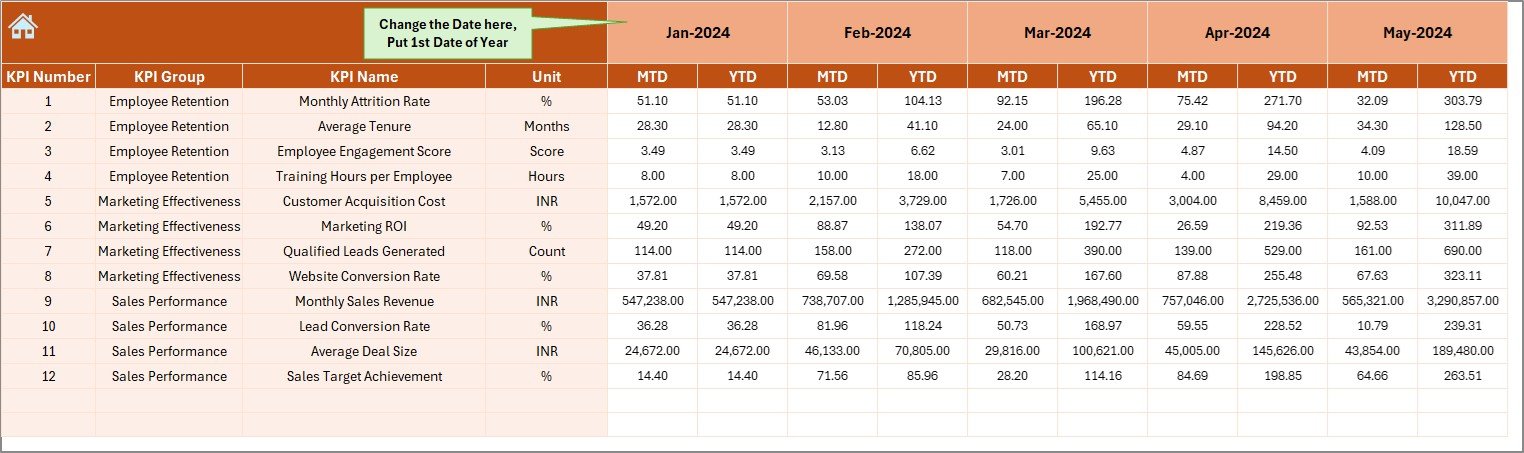
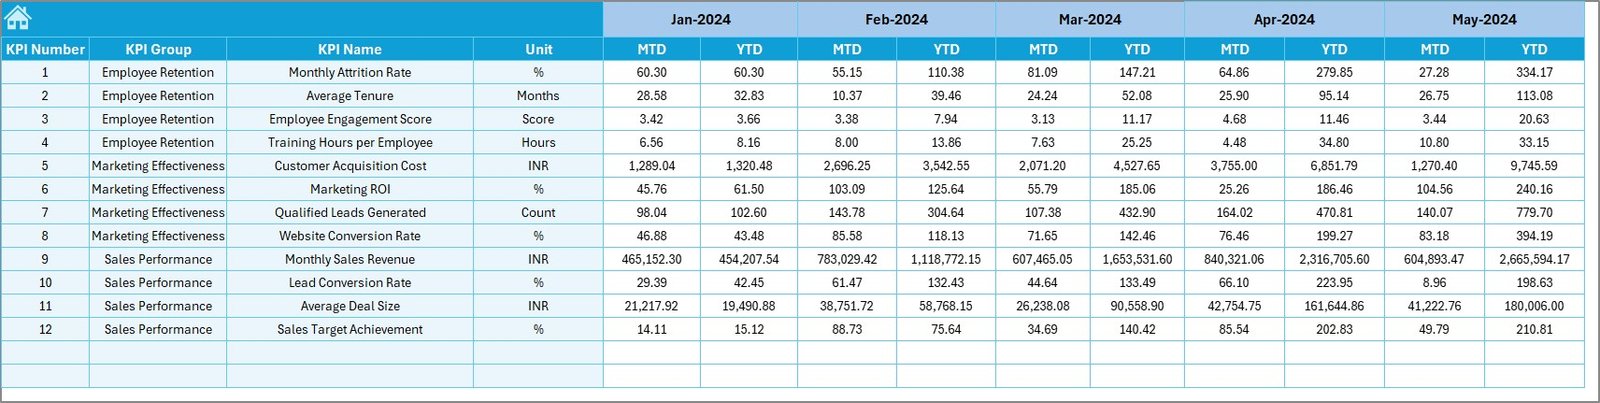
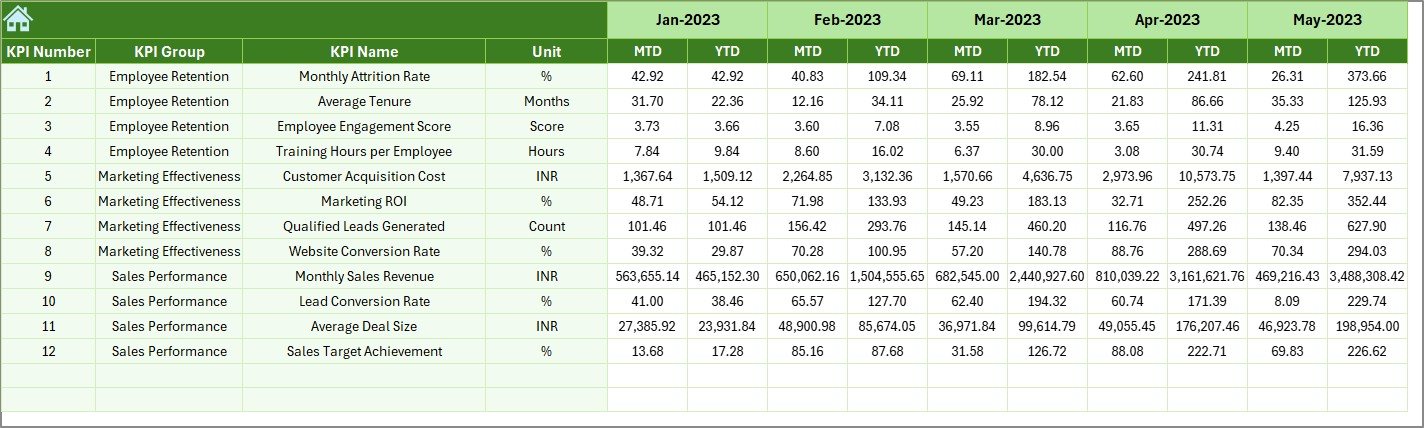
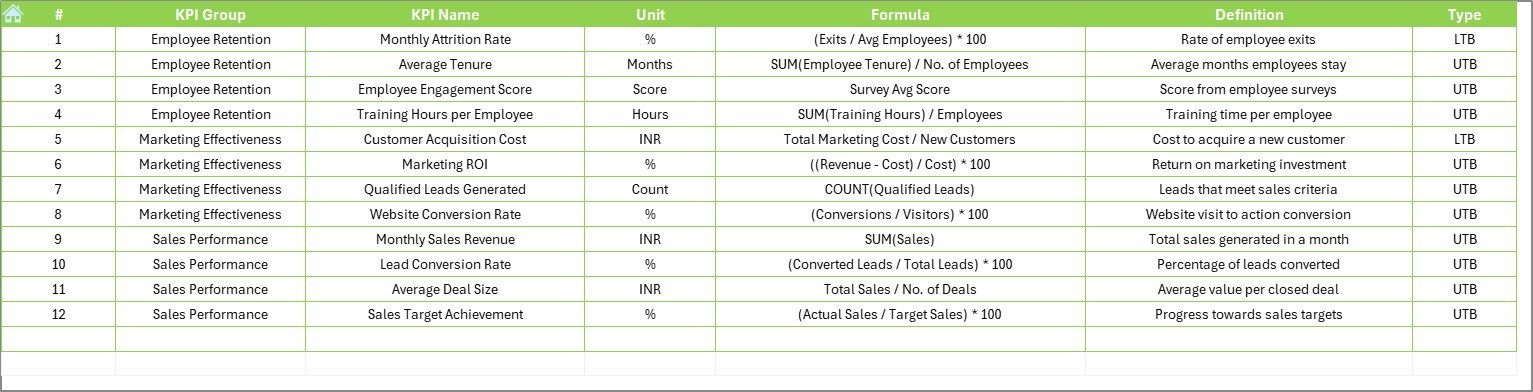

The Sales and Marketing Employee Retention KPI Dashboard in Excel is an essential tool designed for HR professionals, sales, and marketing managers to track and improve employee retention within their teams. This Excel-based dashboard focuses specifically on the sales and marketing sectors, where employee retention is crucial for maintaining a motivated workforce and sustaining business growth.
The dashboard provides real-time insights into key performance indicators (KPIs) such as turnover rates, engagement levels, and retention factors, helping businesses monitor the health of their teams. By using this dashboard, you can identify at-risk employees, assess engagement, and implement data-driven strategies to improve retention rates, all while aligning with your overall business objectives.
Key Features of the Sales and Marketing Employee Retention KPI Dashboard in Excel
📊 Employee Turnover Rate Monitoring
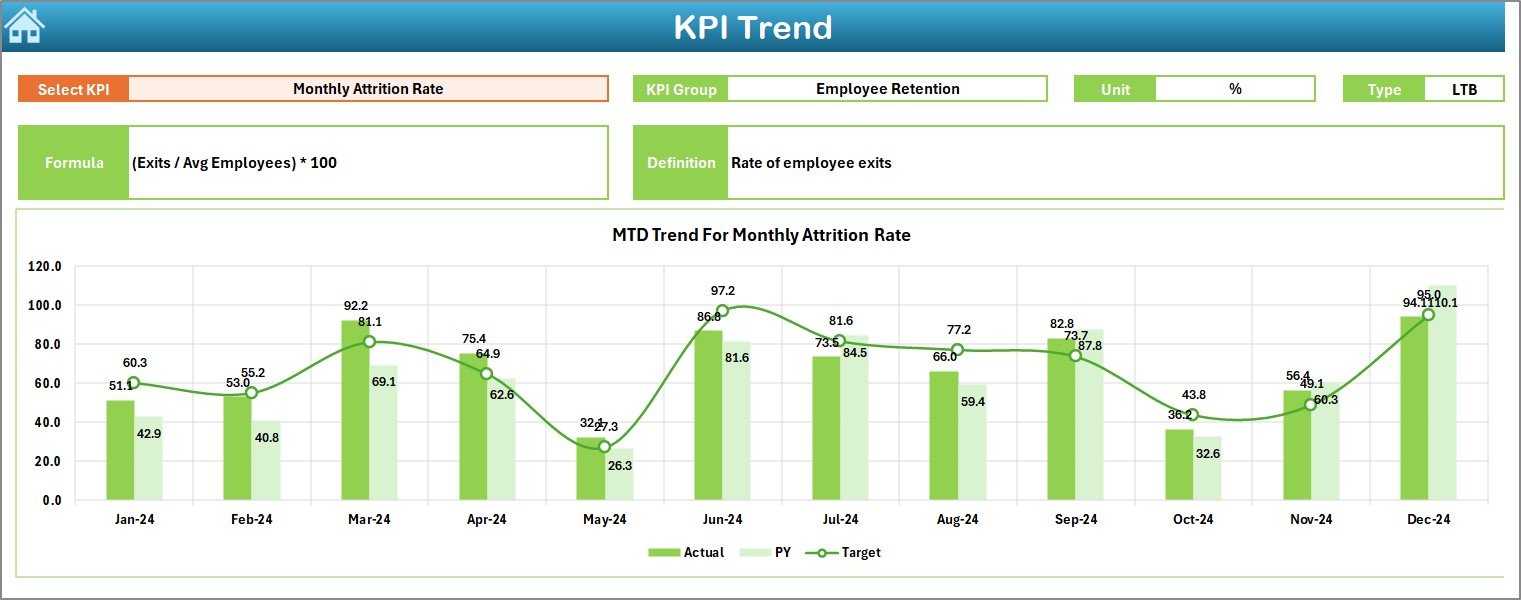
Track employee turnover in your sales and marketing teams. Monitor monthly and yearly turnover rates to identify trends and understand why employees are leaving.
📝 Employee Engagement Tracking
Monitor employee engagement scores through surveys, feedback, and performance metrics. This helps in identifying how satisfied and committed employees are to the organization.
📅 Retention Strategy Performance
Track the effectiveness of your retention strategies by comparing employee turnover and engagement levels before and after interventions. Measure the success of initiatives aimed at improving employee retention.
📉 High-Risk Employee Identification
Use the dashboard to identify employees who are at risk of leaving. Track performance, engagement, and tenure to pinpoint potential retention risks and take proactive action.
📈 Team Performance & Productivity
Monitor the performance and productivity levels of your sales and marketing teams. Understand how retention efforts affect team success and align retention strategies with business goals.
⚙️ Customizable KPIs & Metrics
Customize the dashboard to track specific KPIs that align with your organization’s goals. Add additional metrics, such as compensation data, training hours, or team-specific retention factors.
Why You’ll Love the Sales and Marketing Employee Retention KPI Dashboard in Excel
✅ Efficient Employee Retention Management
Effortlessly track employee turnover, engagement, and retention efforts. Use real-time data to make proactive decisions to retain top talent in your sales and marketing teams.
✅ Improve Engagement & Satisfaction
Monitor employee satisfaction and engagement in real time. Take action based on the insights gained to improve retention and create a positive work environment.
✅ Data-Driven Decision Making
Use the data gathered through the dashboard to inform decisions on retention strategies, training programs, and team-building activities.
✅ Track Retention Strategy Effectiveness
Measure the impact of your retention programs by comparing turnover rates and engagement levels over time. Refine your strategy based on data insights to enhance results.
✅ Scalable & Customizable for Your Needs
Whether you’re managing a small sales team or overseeing a large marketing department, this dashboard is fully customizable to suit your specific business needs.
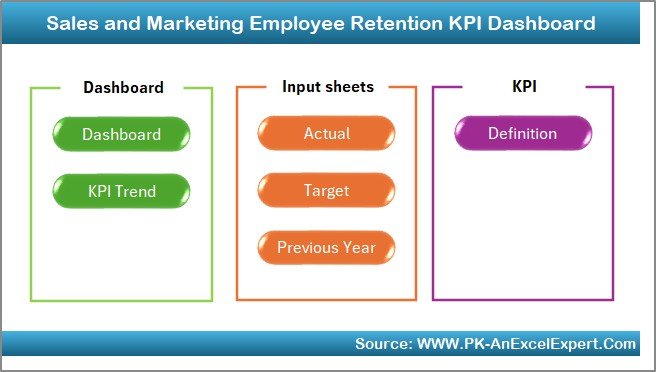
What’s Inside the Sales and Marketing Employee Retention KPI Dashboard in Excel?
Employee Turnover Rate Tracking: Monitor monthly and yearly turnover in your teams.
Employee Engagement Scores: Track engagement levels through surveys and feedback.
Retention Strategy Effectiveness: Measure the success of your retention programs.
High-Risk Employee Identification: Identify employees at risk of leaving.
Team Performance Monitoring: Track team performance and align retention efforts with business goals.
Customizable KPIs: Tailor the dashboard to fit your business’s specific needs.
How to Use the Sales and Marketing Employee Retention KPI Dashboard in Excel
1️⃣ Download the Template: Instantly access the Sales and Marketing Employee Retention KPI Dashboard in Excel.
2️⃣ Input Employee Data: Enter turnover rates, engagement scores, and team performance metrics.
3️⃣ Monitor KPIs: Track employee turnover, engagement, and retention strategies.
4️⃣ Identify High-Risk Employees: Use the dashboard to pinpoint employees at risk of leaving.
5️⃣ Optimize Retention Strategies: Use data insights to improve your employee retention strategies and business outcomes.
Who Can Benefit from the Sales and Marketing Employee Retention KPI Dashboard in Excel?
🔹 HR Professionals & Employee Relations Managers
🔹 Sales Managers & Marketing Directors
🔹 Business Owners & Executives
🔹 Small & Medium Enterprises (SMBs)
🔹 Large Corporations with Sales & Marketing Teams
🔹 Recruitment & Retention Specialists
🔹 Employee Engagement Consultants
Improve employee retention and optimize your workforce with the Sales and Marketing Employee Retention KPI Dashboard in Excel. Track key metrics, engage employees, and make data-driven decisions to enhance your team’s success and business growth.
Click here to read the Detailed blog post
Visit our YouTube channel to learn step-by-step video tutorials
Youtube.com/@PKAnExcelExpert
Watch the step-by-step video Demo:
Compatibility and Requirements
- Works in Microsoft Excel desktop (Excel 2016 or later, or Microsoft 365).
- You enter turnover, engagement and team performance data in Excel, and the dashboard updates from it. Microsoft’s Excel for Windows training covers the basics.
Frequently Asked Questions
What does this dashboard track?
It tracks employee turnover rates (monthly and yearly), engagement scores, retention strategy effectiveness, high-risk employees and team performance for sales and marketing teams.
How do I find employees who might leave?
The dashboard uses performance, engagement and tenure data to show which employees are at risk of leaving, so you can act early.
Can I measure whether a retention program worked?
Yes. It compares turnover and engagement levels over time, so you can see the effect of a retention initiative.
Can I add my own KPIs?
Yes. The KPIs are customizable. You can add metrics such as compensation data, training hours or team-specific retention factors.
Is there a Google Sheets version?
There is an Employee Retention KPI Dashboard in Google Sheets. It covers general employee retention rather than sales and marketing teams only.
Related Employee Retention and Sales and Marketing Templates
- Employee Retention KPI Dashboard in Excel: the general version for any team
- Human Resources Employee Retention KPI Dashboard in Excel: retention KPIs from the HR side
- Sales and Marketing Employee Satisfaction KPI Dashboard in Excel: satisfaction tracking for the same teams
- Employee Retention Dashboard in Excel: another retention dashboard
- Sales and Marketing Training and Development KPI Dashboard in Excel: training tracking for sales and marketing staff
Browse all Excel KPI dashboards and Excel sales and marketing templates.































Reviews
There are no reviews yet.