In today’s competitive business environment, having full visibility into your revenue streams isn’t optional—it’s mission-critical. Whether you’re running a startup, leading a sales team, or managing a regional branch, tracking revenue by product, channel, or region can unlock deeper insights and drive smarter decisions.
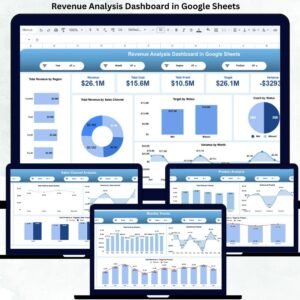
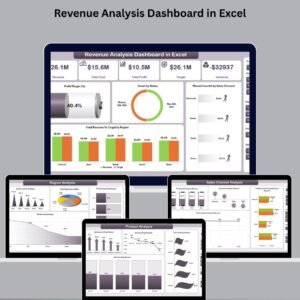
That’s where the Revenue Analysis Dashboard in Excel comes in—a robust, plug-and-play Excel template designed to help you monitor, analyze, and visualize revenue performance across multiple dimensions. 🎯💡
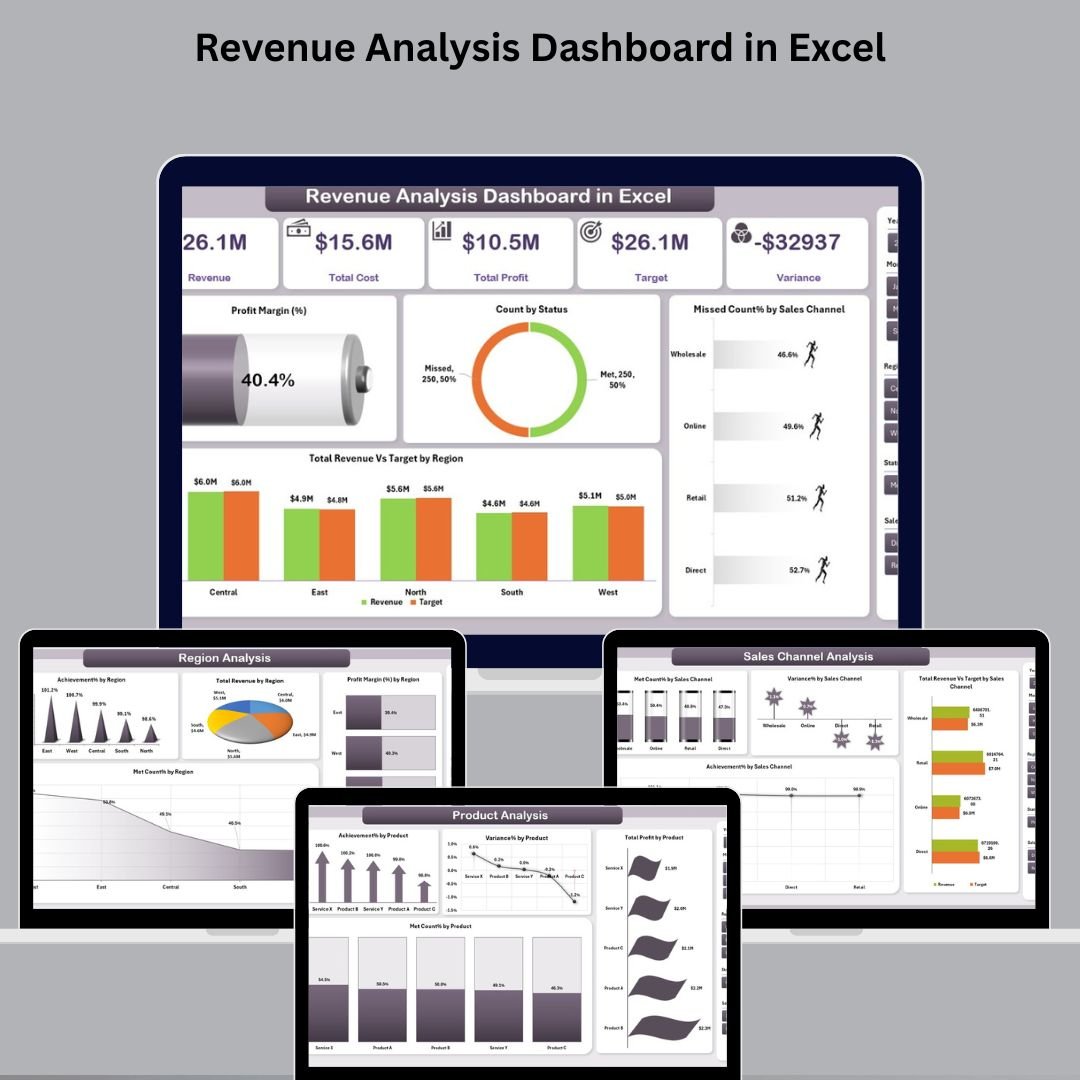
Built with slicers, pivot tables, interactive charts, and dynamic KPI cards, this dashboard provides clarity, structure, and insights—without the need for expensive BI software.
🛠️ Key Features of Revenue Analysis Dashboard in Excel
📌 Page Navigator (Left Sidebar)
Jump between five analysis pages using clickable buttons:
-
Overview
-
Region Analysis
-
Sales Channel Analysis
-
Product Analysis
-
Monthly Trends
🧭 Makes navigation seamless and boosts productivity.
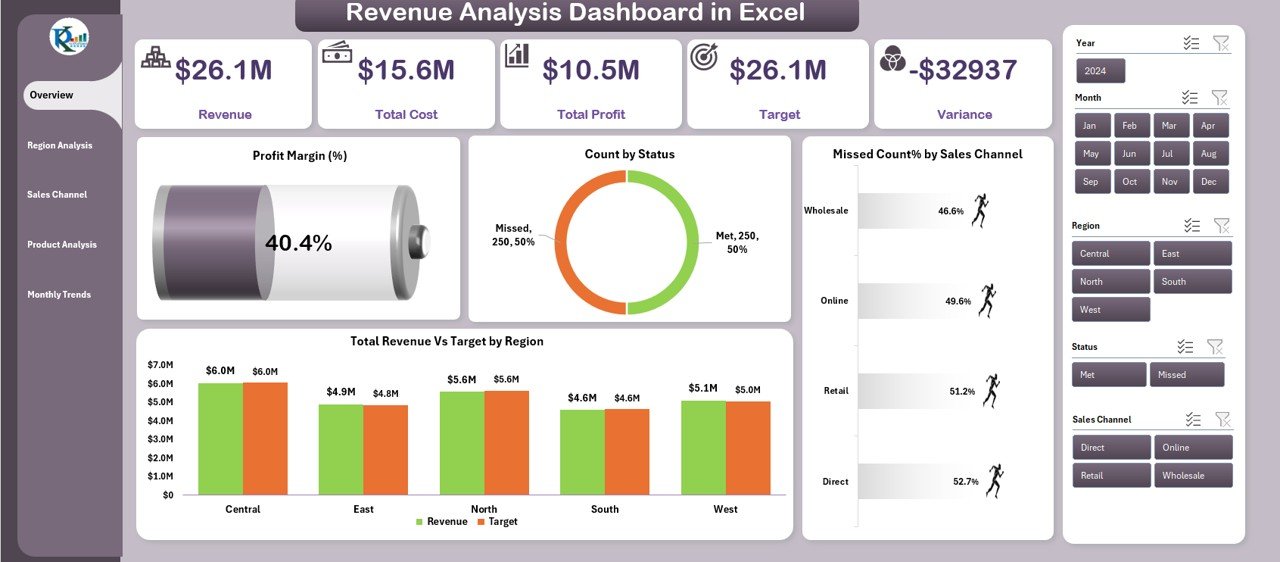
📊 Overview Page – The Executive Summary
Includes:
-
🎯 KPI Cards: Total Revenue, Target Achievement %, Total Profit, Met Count, Missed Count
-
📉 Charts:
-
Profit Margin (%)
-
Count by Status
-
Missed Count % by Channel
-
Revenue vs Target by Region
-
-
🎛 Slicers for Month, Year, Region, and more
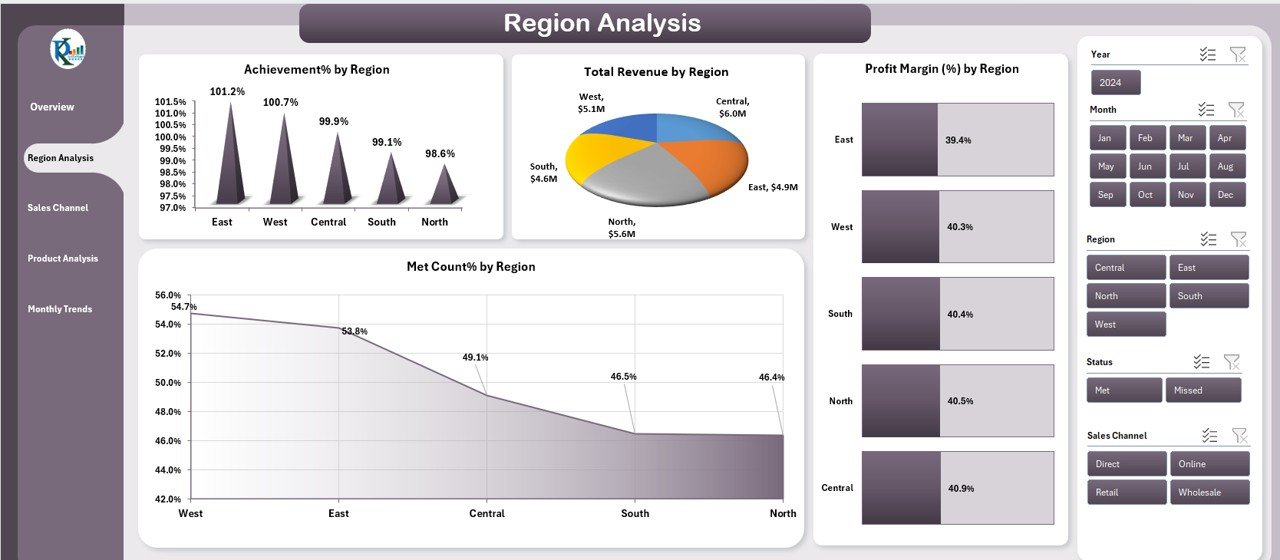
💼 Region Analysis Page
Compare performance across regions:
-
Achievement % by Region
-
Total Revenue by Region
-
Profit Margin by Region
-
Met Count % by Region
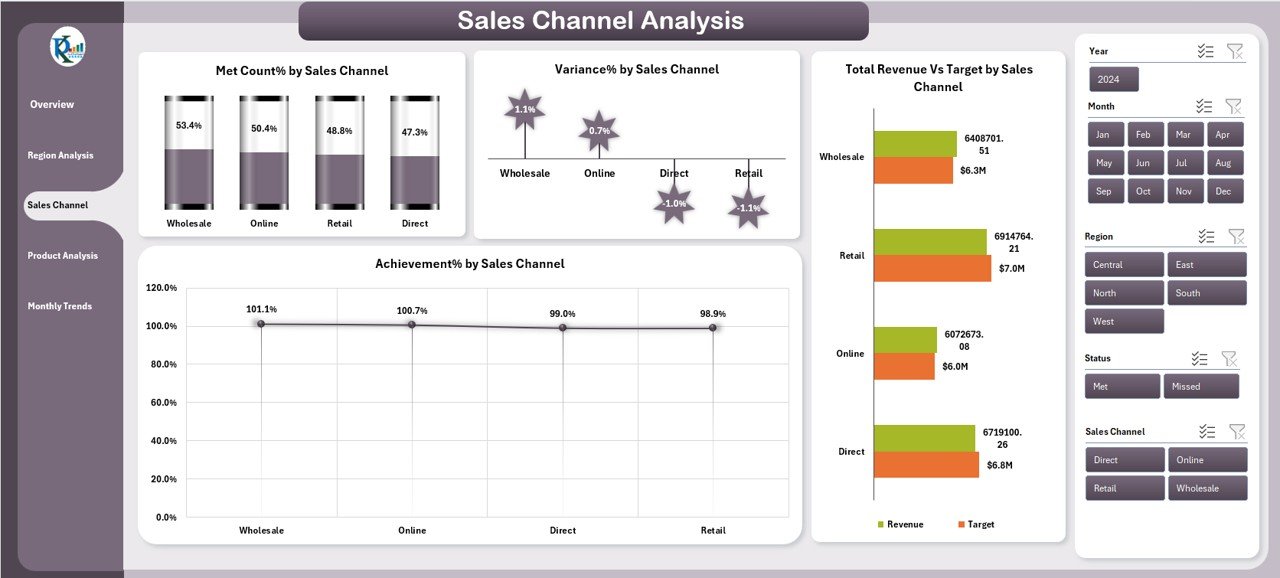
📦 Sales Channel Analysis Page
Evaluate distribution efficiency:
-
Met Count % by Channel
-
Variance % by Channel
-
Revenue vs Target by Channel
-
Achievement % by Channel
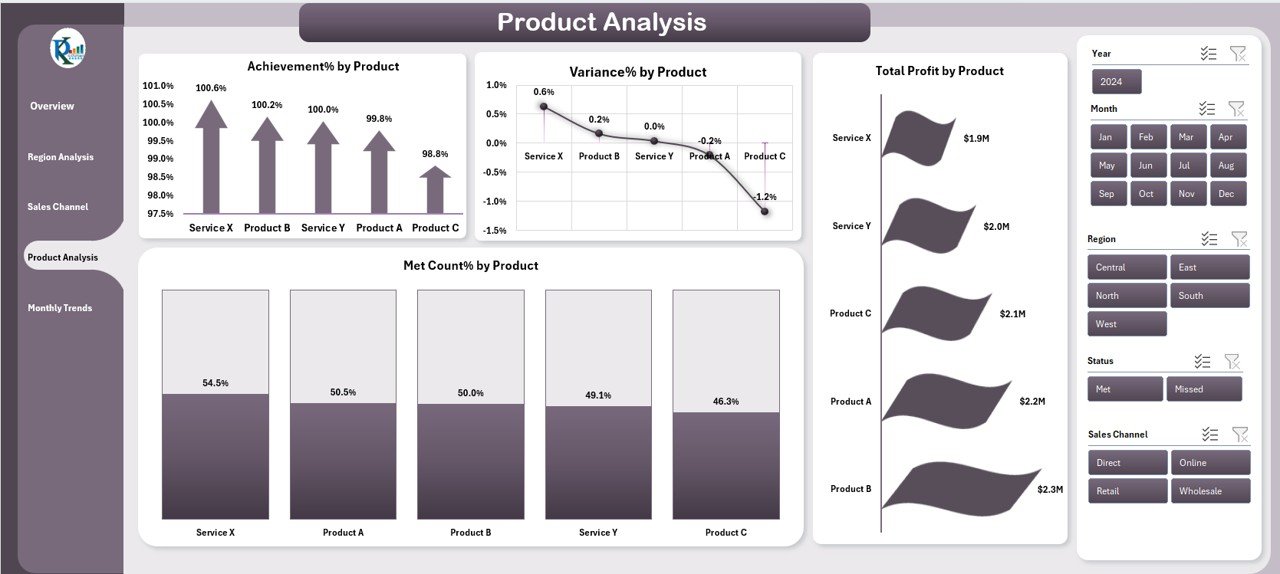
🛒 Product Analysis Page
Analyze profitability and success rates by product:
-
Achievement %
-
Variance %
-
Profit by Product
-
Met Count %
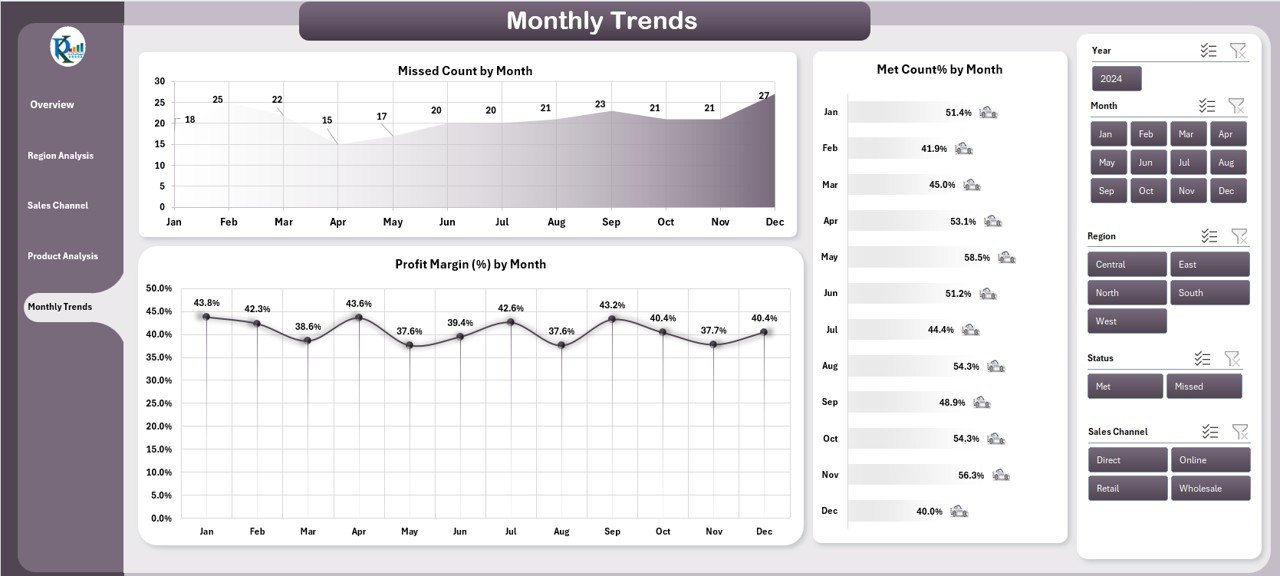
📆 Monthly Trends Page
Spot seasonal trends and long-term patterns:
-
Missed Count by Month
-
Profit Margin by Month
-
Met Count % by Month
📥 Data Sheet
Enter raw records including:
-
Date, Revenue, Target, Product, Region, Channel, Profit, Status
📋 Support Sheet
Maintain dropdown options and slicer control:
-
Product list, Region list, Status values (✔ / ✘), Sales Channels
📌 How to Use the Dashboard
✔️ Step 1: Enter/update records in the Data Sheet
✔️ Step 2: Use slicers to filter by time, region, channel, etc.
✔️ Step 3: Navigate via the Page Navigator
✔️ Step 4: Refresh pivots to update all KPIs and charts
✔️ Step 5: Present insights, share reports, and make informed decisions
👥 Who Can Benefit from This Dashboard?
✅ Sales Leaders – Identify which region or product needs attention
✅ Finance Managers – Monitor revenue vs target across channels
✅ E-commerce Operators – Visualize monthly trends by platform
✅ Retail Executives – Compare branch performance by channel
✅ Business Analysts – Prepare insights for quarterly reviews
✅ Consultants – Use it to track and present client performance metrics
📊 With this Excel template, you can finally leave behind cluttered spreadsheets and static reports. Instead, use a visual, interactive, and analytical tool that transforms your raw revenue data into actionable business intelligence.
🔗 Click here to read the Detailed blog post
🎥 Visit our YouTube channel to learn step-by-step video tutorials


Reviews
There are no reviews yet.