

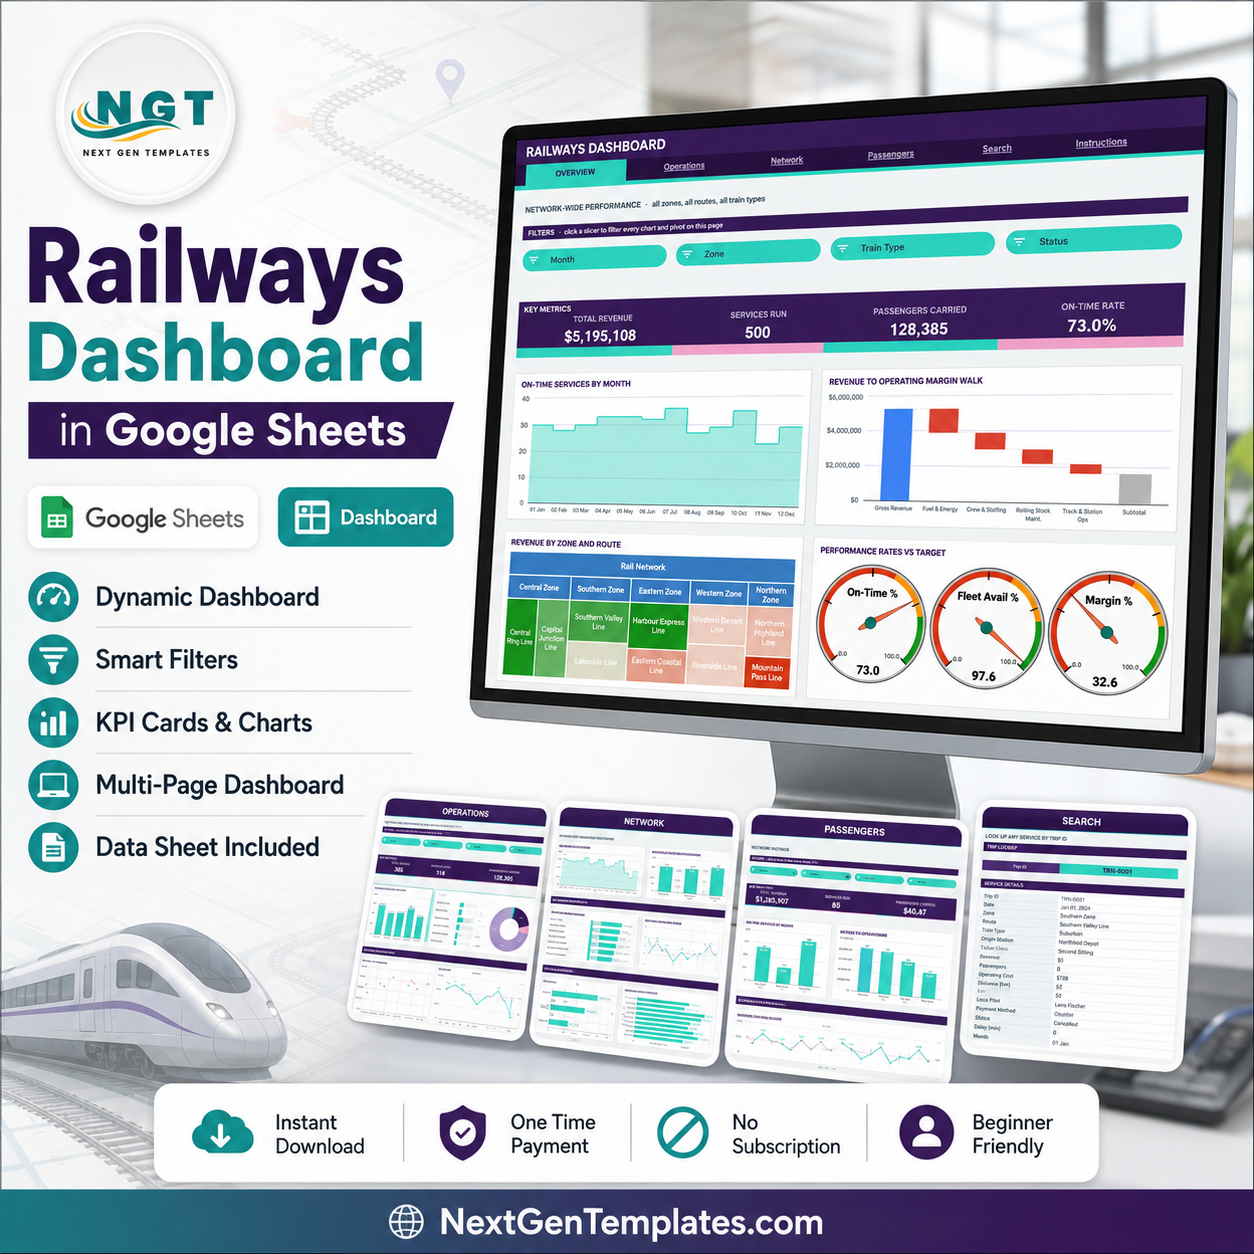

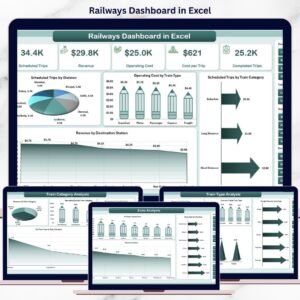
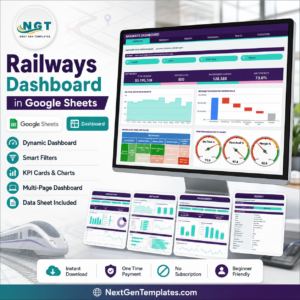
The Railways Dashboard in Google Sheets reports on 500 demo train services across 6 tabs, with 16 KPI cards, 19 charts and gauges, and 15 native slicers. Every chart reads a real pivot table – no helper formulas sit behind the visuals – and the pivots, slicers and formulas already cover 1,000 data rows, so setup means pasting your own service log over the sample rows.
🌍 Join 10,000+ customers in 180+ countries using NextGenTemplates to replace paid SaaS tools with one-time-purchase Excel, Google Sheets, Power BI, and HTML templates.
✅ Instant download · One-time payment · No subscription · No per-user fees · Lifetime access
Note: this is a reporting template you fill with your own operating records. The figures shown in the screenshots are demo data generated to illustrate the layout – they are not real network statistics, and the template makes no assessment of rail safety, signalling or regulatory matters.
🔑 Key Features of the Railways Dashboard in Google Sheets
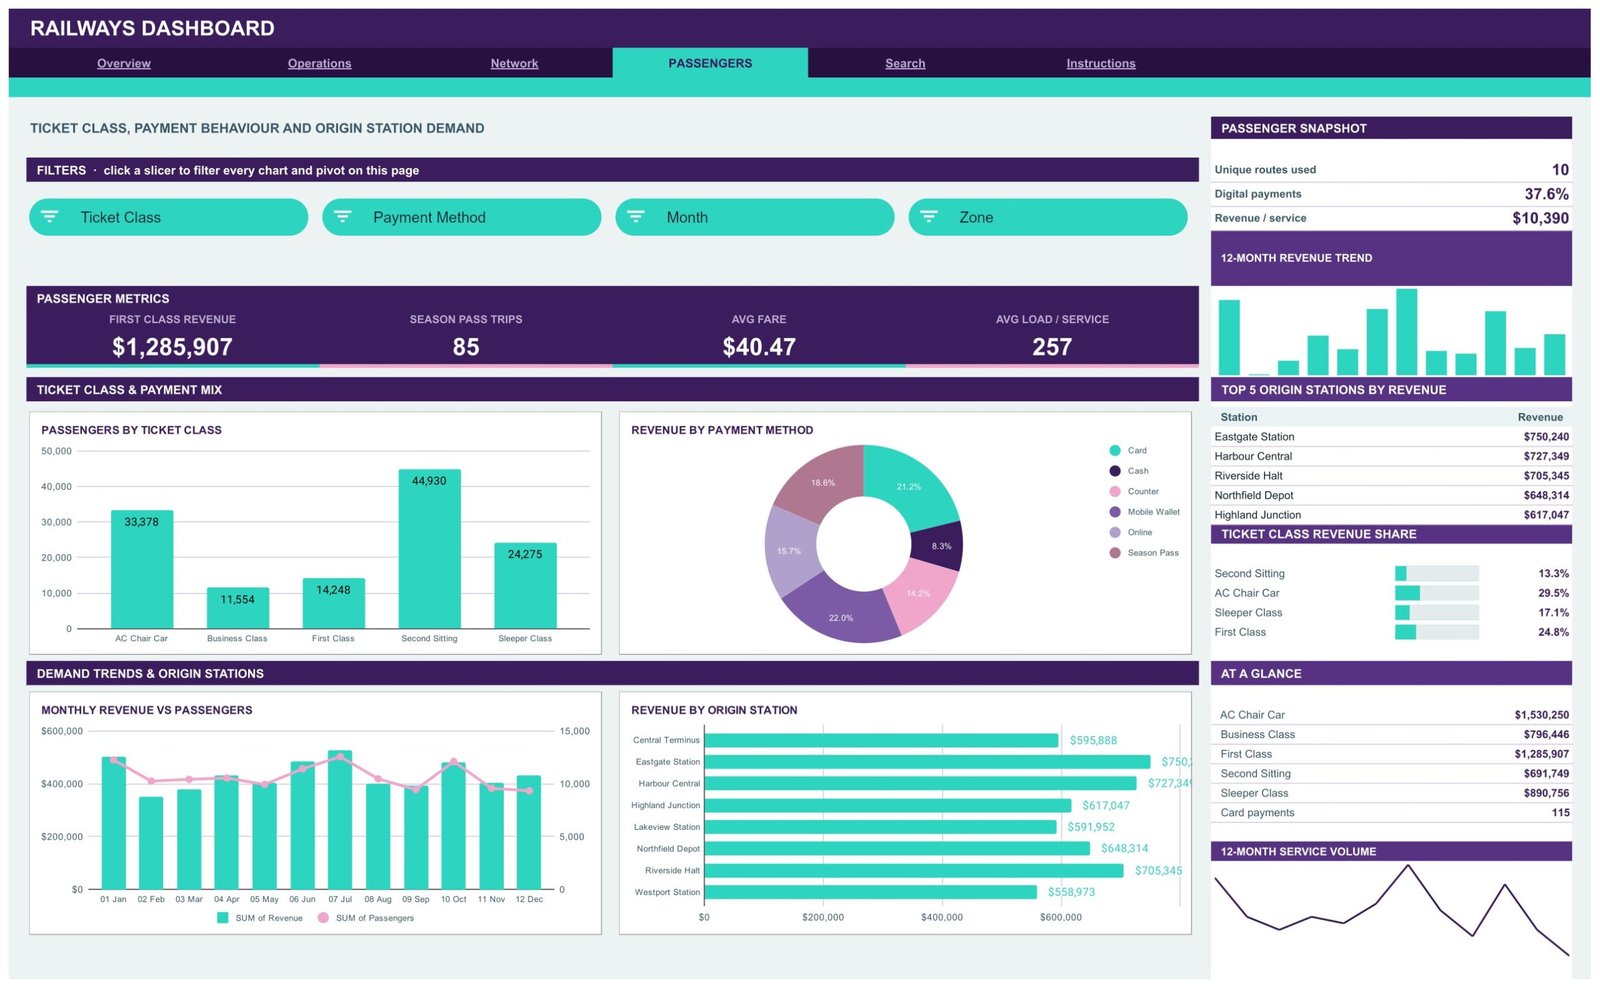
🚆 Four slicer-driven analysis pages. Overview covers network-wide punctuality and cost structure, Operations covers delays and reliability by train type, Network covers zone and route performance, and Passengers covers ticket class, payment behaviour and origin station demand. Each page carries its own filter strip.
📊 19 charts and gauges built on native pivot tables. The set includes a Revenue to Operating Margin Walk waterfall, a Revenue by Zone and Route treemap, Services by Status and Revenue by Payment Method donuts, a Distance vs Revenue scatter, two combo charts and three performance gauges reading On-Time %, Fleet Availability % and Margin %.
🎛️ 15 slicers across the four pages. Overview filters by Month, Zone, Train Type and Status; Operations adds Loco Pilot; Network filters by Zone, Route and Month; Passengers filters by Ticket Class, Payment Method, Month and Zone. Click any slicer and every chart, pivot and Top 5 panel on that page redraws together.
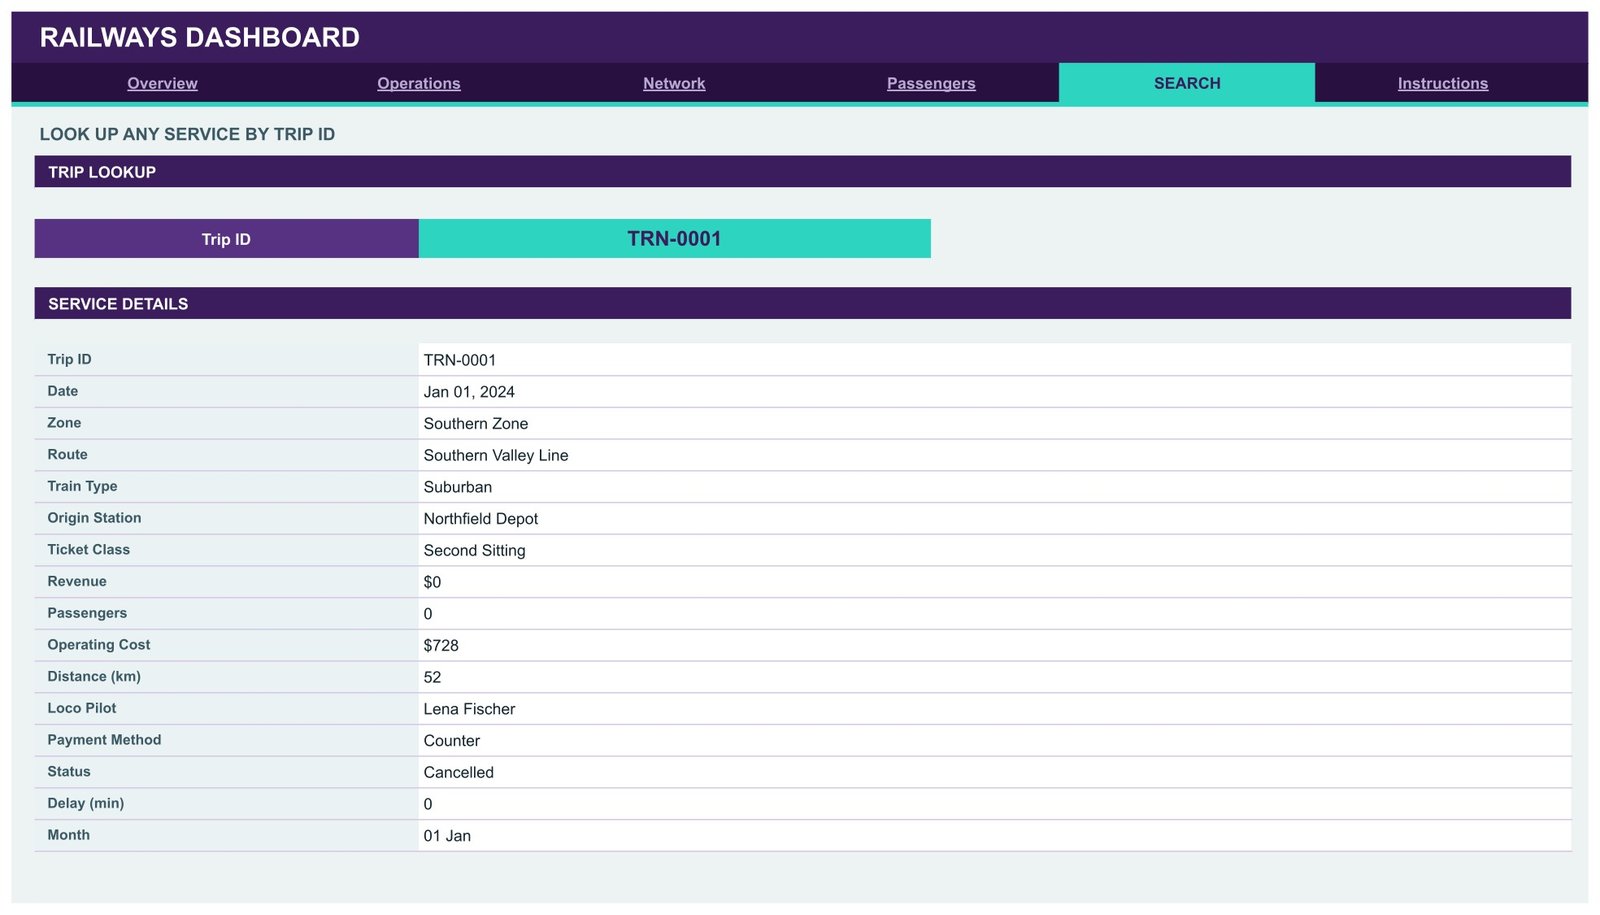
🔍 A Trip ID search page. Pick any Trip ID from the dropdown and the Service Details panel returns all 16 fields for that service – date, zone, route, train type, origin station, ticket class, revenue, passengers, operating cost, distance, loco pilot, payment method, status, delay and month.
📈 A persistent sidebar on every analysis page. Each page keeps a snapshot block, a 12-Month Revenue Trend column chart, a Top 5 ranking table, a share-of-total bar panel, an At A Glance list and a 12-month service volume sparkline – so the context never leaves the screen while you filter.
♾️ Auto-expanding to 1,000 rows. Pivots, slicers and every formula already cover row 1001. Paste new services anywhere in that range and the whole dashboard updates on its own. Need more? Open the Apps Script file, raise DATA_ROWS and re-run main().
📦 What’s Inside the Railways Dashboard in Google Sheets
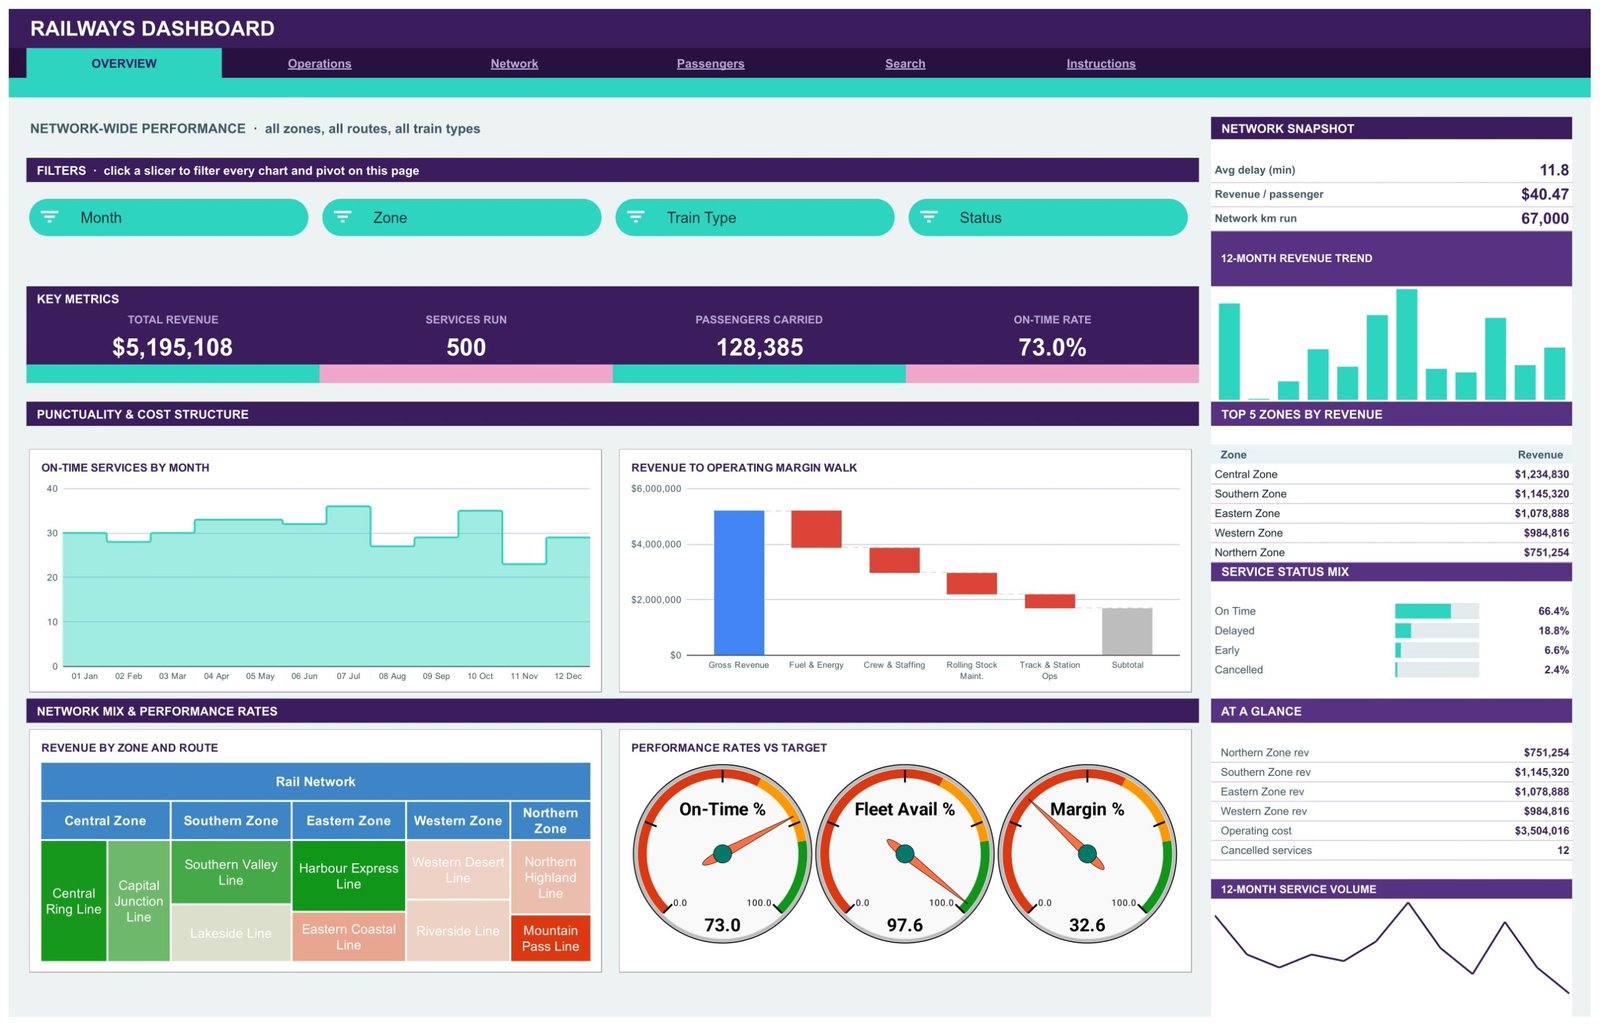
Page 1: Overview – Network-Wide Performance
The landing page carries four KPI cards – Total Revenue, Services Run, Passengers Carried and On-Time Rate – above an On-Time Services by Month area chart and a Revenue to Operating Margin Walk waterfall that steps gross revenue down through Fuel & Energy, Crew & Staffing, Rolling Stock Maintenance and Track & Station Ops. Below sit a Revenue by Zone and Route treemap and three Performance Rates vs Target gauges. The sidebar holds the network snapshot, Top 5 Zones by Revenue and a Service Status Mix panel.
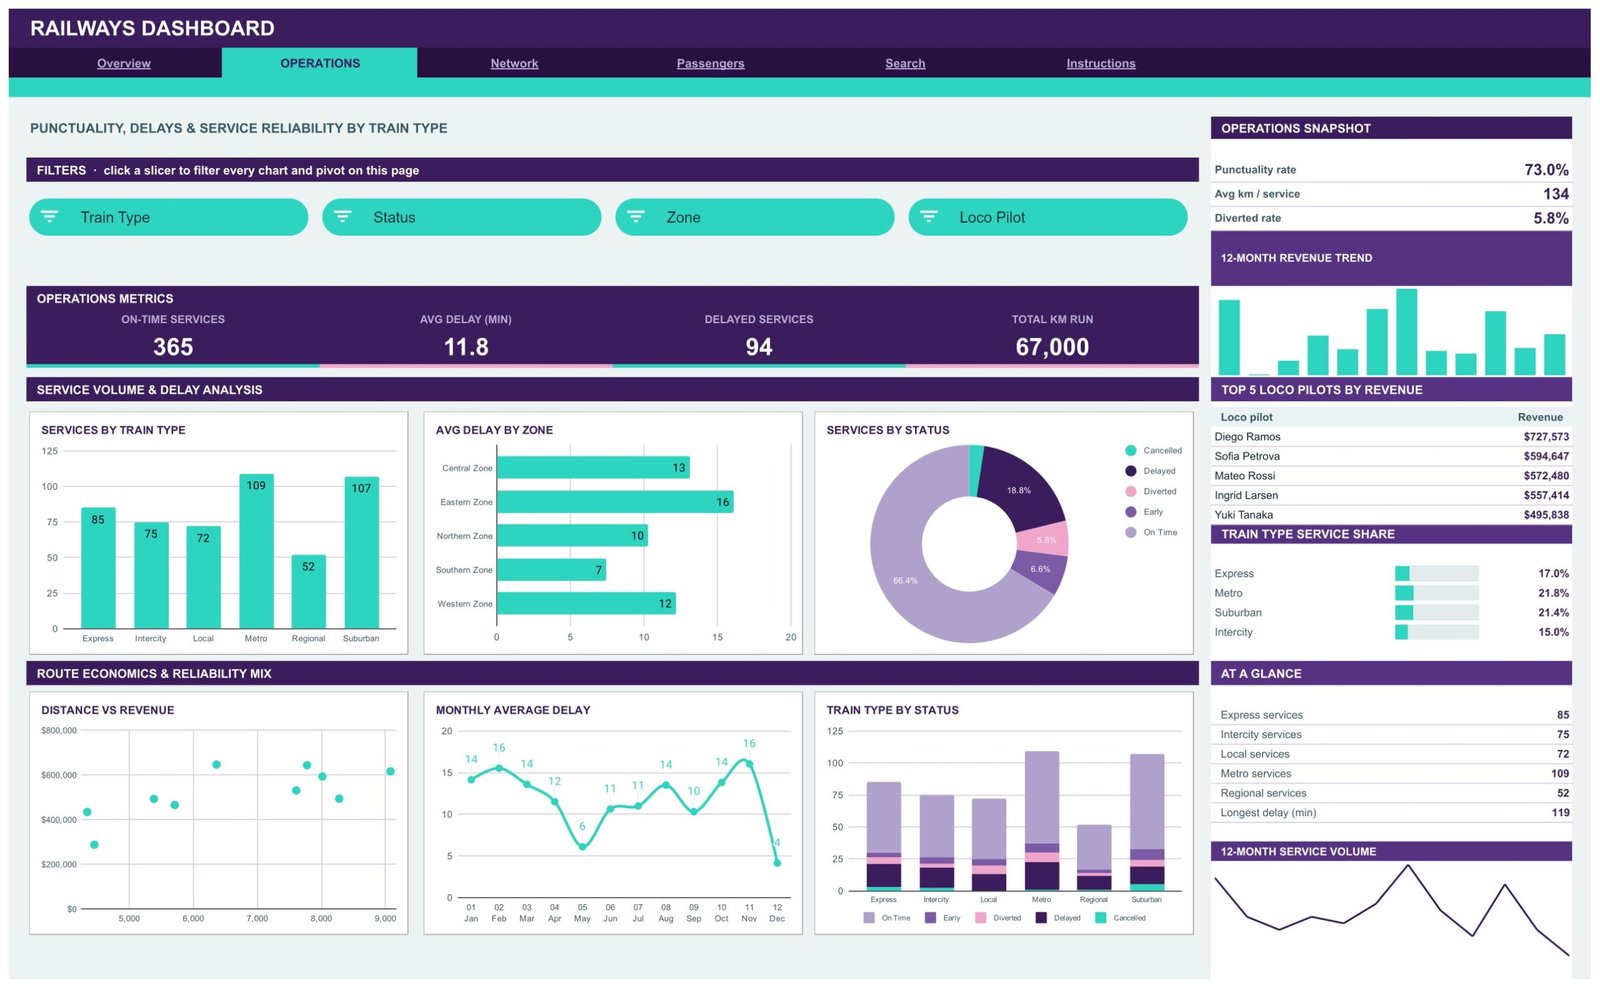
Page 2: Operations – Punctuality, Delays and Reliability by Train Type
KPI cards report On-Time Services, Avg Delay (min), Delayed Services and Total km Run. Charts include Services by Train Type, Avg Delay by Zone, Services by Status, Distance vs Revenue, Monthly Average Delay and Train Type by Status. The sidebar adds an operations snapshot, Top 5 Loco Pilots by Revenue and a Train Type Service Share panel.
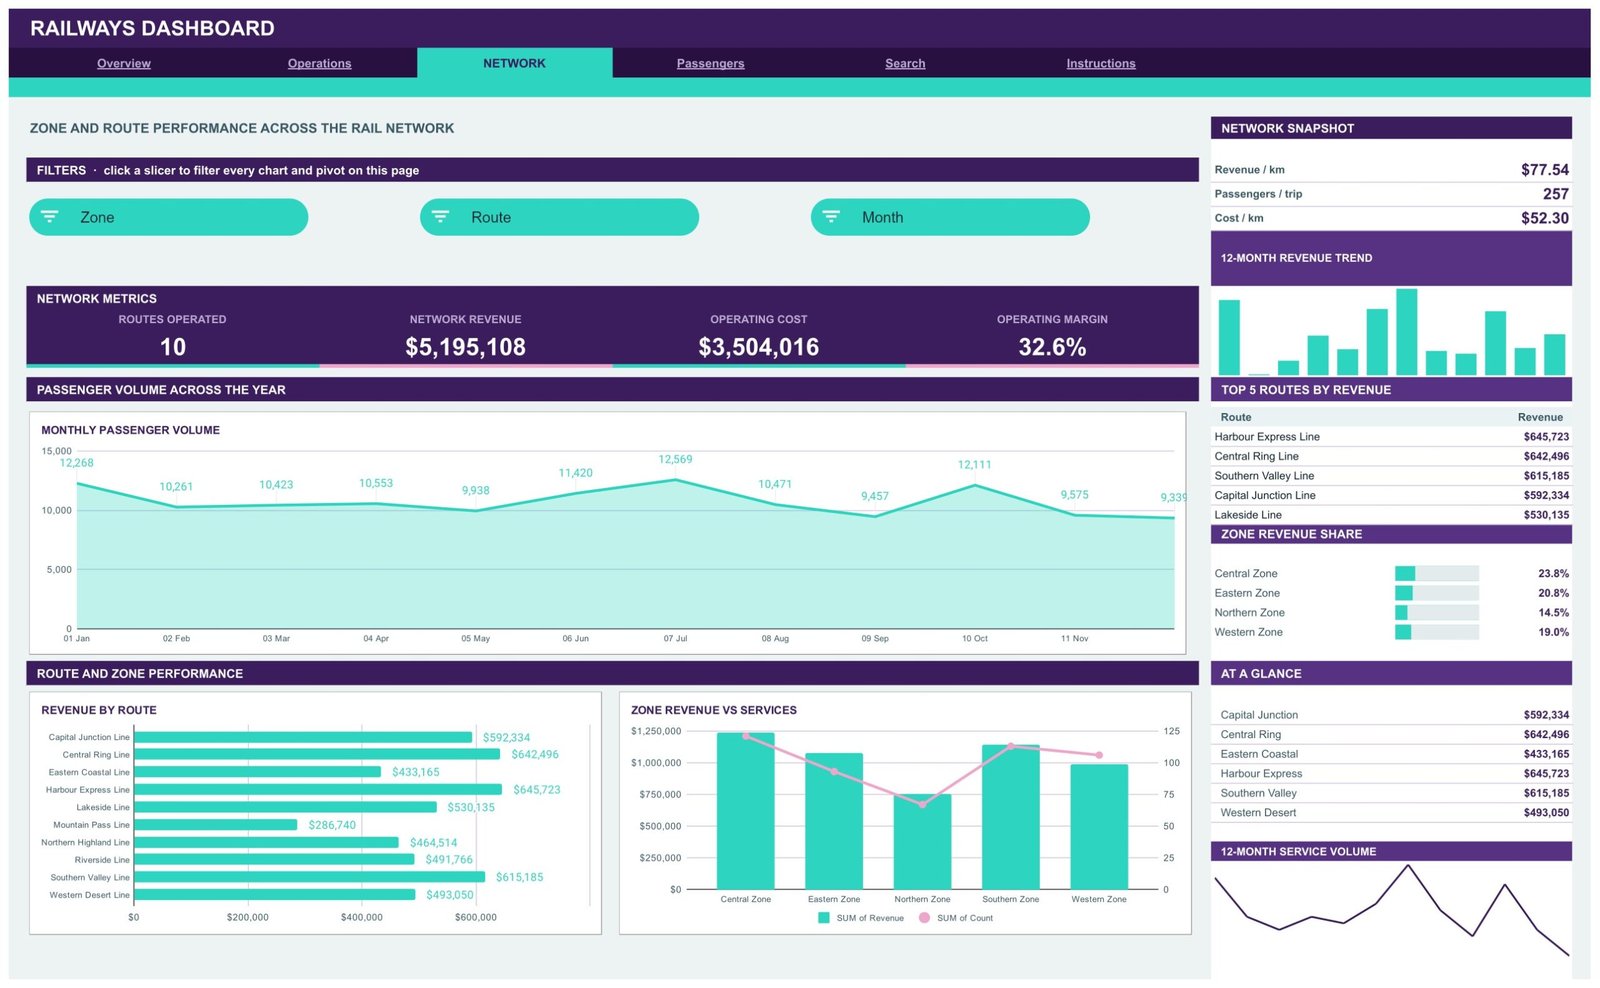
Page 3: Network – Zone and Route Performance
This page tracks Routes Operated, Network Revenue, Operating Cost and Operating Margin, then breaks them out with Monthly Passenger Volume, Revenue by Route and Zone Revenue vs Services. The sidebar reports revenue per km, passengers per trip and cost per km alongside Top 5 Routes by Revenue and a Zone Revenue Share panel.
Page 4: Passengers – Ticket Class, Payment and Station Demand
KPI cards show First Class Revenue, Season Pass Trips, Avg Fare and Avg Load per Service. Charts cover Passengers by Ticket Class, Revenue by Payment Method, Monthly Revenue vs Passengers and Revenue by Origin Station. The sidebar lists unique routes used, digital payment share, revenue per service, Top 5 Origin Stations by Revenue and a Ticket Class Revenue Share panel.
Page 5: Search – Look Up Any Service by Trip ID
Choose a Trip ID and the Service Details table returns the complete record for that service across all 16 data fields. Useful when a colleague asks about one specific working rather than a trend.
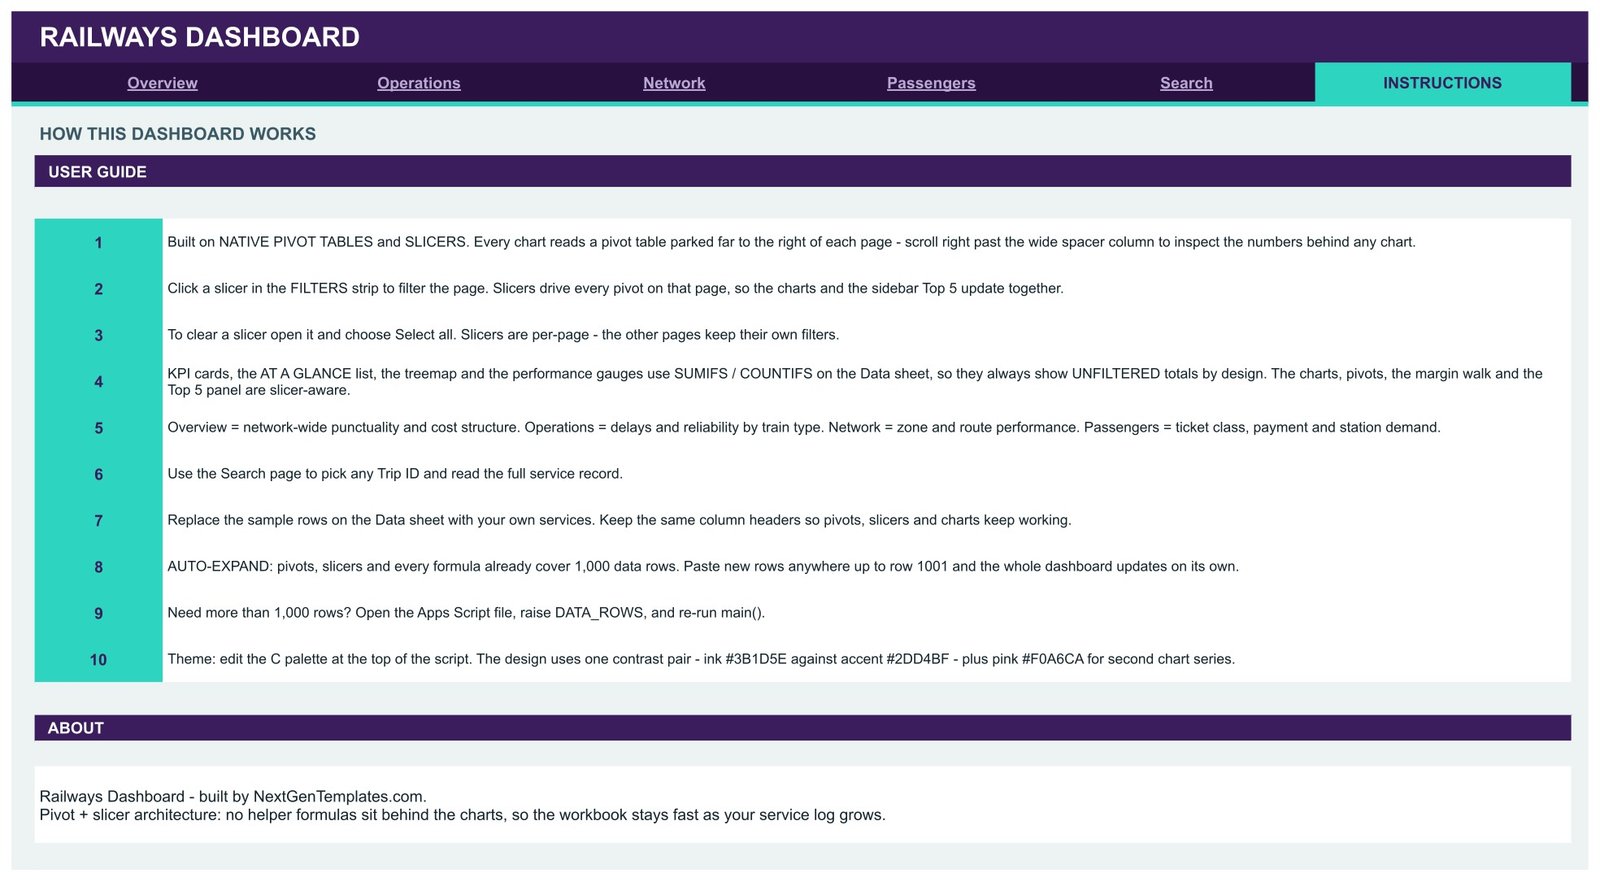
Page 6: Instructions – How This Dashboard Works
A 10-step user guide explains the pivot-and-slicer architecture, which cards are slicer-aware and which show unfiltered totals by design, how to clear a slicer, how to replace the sample rows, and how to change the colour palette in the Apps Script file.
Data sheet
One flat table of 16 columns – Trip ID, Date, Zone, Route, Train Type, Origin Station, Ticket Class, Revenue, Passengers, Operating Cost, Distance (km), Loco Pilot, Payment Method, Status, Delay (min) and Month – pre-loaded with 500 clearly labelled demo rows. Keep the headers, swap the rows, and every page follows.
📊 Railways Dashboard in Google Sheets vs. a Microsoft Excel Dashboard vs. Paid Rail BI Software – Where This Fits
| Feature | Railways Dashboard in Google Sheets | Microsoft Excel Dashboard | Zoho Analytics / Tableau |
|---|---|---|---|
| Cost | $9.99 one-time ✅ | $13.99-$19.99 one-time | $25-$150 / user / month |
| Platform | Any browser, no install ✅ | Excel desktop licence | Cloud BI platform |
| Setup time | Under 10 minutes ✅ | Under 15 minutes | Days of modelling |
| Real-time team collaboration | Built in via Google Drive ✅ | Needs OneDrive co-authoring | Yes, per seat |
| Mobile access | Google Sheets app ✅ | Excel mobile app | Vendor app |
| Customisable fields | Edit any column or pivot ✅ | Yes | Admin-controlled |
| Share with a link | Yes, free viewers ✅ | File sharing | Paid seat per viewer |
| Year-1 cost at 5 users | $9.99 total ✅ | $13.99-$19.99 plus licences | $1,500-$9,000 |
| Trip-level record lookup | Built-in Search page ✅ | Depends on build | Requires a report |
For teams that want route, punctuality and revenue reporting without paying per-seat BI fees, the Railways Dashboard in Google Sheets sits in the sweet spot.
👥 Who This Template Is For – and Who It’s Not For
✅ This template is built for:
- Operations and planning analysts at regional rail, metro and suburban operators who currently report from spreadsheets
- Commercial and revenue teams tracking fare income by ticket class, payment method and origin station
- Transport consultancies and student projects that need a working rail reporting model without building one from scratch
- Depot and route managers who want a shareable monthly pack instead of a slide deck rebuilt by hand
❌ This template is NOT for:
- Anyone needing a safety, signalling, incident or regulatory-compliance system – this template does none of that and makes no such assessment
- Live train-running, timetabling or dispatch, which need a real-time operational system, not a spreadsheet
- Teams with millions of service records – Google Sheets is not the right store at that volume
- Buyers who want the demo figures to be usable as industry benchmarks; they are generated sample data only
⚙️ How to Use the Railways Dashboard in Google Sheets
- Open the PDF in your download and click the copy link to create your own editable copy in Google Drive.
- Open the Instructions tab and read the 10-step guide – it explains which cards are slicer-aware and which are not.
- Go to the Data sheet and replace the 500 demo rows with your own services, keeping the 16 column headers exactly as they are.
- Return to Overview and click any slicer chip in the FILTERS strip to filter every chart and pivot on that page.
- To clear a filter, open the slicer and choose Select all. Slicers are per page, so each page keeps its own view.
- Use the Search page to pull the full record for a single Trip ID.
- Paste additional services anywhere up to row 1001 – pivots, charts and formulas already cover that range.
- Share the file from Google Drive with view or edit access for as many colleagues as you need.
💼 Real-World Use Cases
Priya runs commercial reporting for a five-zone regional operator. She pastes the month’s service export into the Data sheet and uses the Network page to see revenue per km and operating margin by route, then screenshots the Top 5 Routes by Revenue panel straight into her board pack – work that used to take two afternoons of pivot-rebuilding.
Marco manages a suburban depot. He filters the Operations page by Train Type and Zone to see where average delay sits highest that month, and uses Train Type by Status to show his team the split between on-time, early, delayed, diverted and cancelled workings.
Aisha teaches a transport analytics module. She hands students the copy link and asks them to load a public timetable extract, then compare fare income by ticket class and payment method on the Passengers page – a full working model without a BI licence.
❓ Frequently Asked Questions
What does the Railways Dashboard in Google Sheets actually track?
The Railways Dashboard in Google Sheets tracks revenue, services run, passengers carried, on-time rate, average delay, delayed services, kilometres run, routes operated, operating cost, operating margin, average fare and average load per service across 16 KPI cards on four analysis pages.
Is the sample data real railway data?
No. The Railways Dashboard in Google Sheets ships with 500 generated demo service rows purely to show the layout working. They are not real network statistics and should not be quoted or used as benchmarks. Replace them with your own records before reporting anything.
Does this template cover rail safety or regulatory compliance?
No. The Railways Dashboard in Google Sheets is a reporting layer over data you supply. It makes no assessment of safety, signalling, engineering fitness or regulatory compliance, and it should not be used as evidence for any of those purposes.
How long does setup take?
Under 10 minutes. Open the PDF, click the copy link, then paste your service records over the demo rows on the Data sheet keeping the same headers. Pivots, slicers and charts already reach row 1001, so no rebuild is needed.
How does this compare to a paid BI tool like Tableau or Zoho Analytics?
Paid BI platforms charge $25-$150 per user per month and need a modelling project first. The Railways Dashboard in Google Sheets is a one-time $9.99 purchase, opens in any browser, and can be shared with unlimited free viewers through Google Drive.
Can I add more than 1,000 service rows?
Yes. The Railways Dashboard in Google Sheets covers 1,000 rows out of the box. For more, open the attached Apps Script file, raise the DATA_ROWS value and re-run main() as described on the Instructions tab.
Can I change the colours to match our brand?
Yes. The Instructions tab explains that the whole theme comes from one palette at the top of the Apps Script file, so a single edit and re-run recolours every page of the Railways Dashboard in Google Sheets.
👤 About the Author
Built by PK – Microsoft Certified Professional with 15+ years of Excel, Google Sheets, and Power BI experience. Founder of NextGenTemplates, reaching 300K+ subscribers across YouTube channels (@PK-AnExcelExpert, @NextGenTemplates, @NeoTechNavigators). Every template is hand-built and tested before release.
🔗 Explore Related Templates
Staying inside the transport line, the Transportation Services Dashboard in Google Sheets covers multi-mode trip and fleet reporting, while the Shipping Dashboard in Google Sheets handles consignment and carrier performance. For port-side operations see the Marine & Ports Dashboard in Google Sheets.
Also available as: the same topic ships as the Railways Dashboard in Excel, and freight teams can use the Railway Cargo Dashboard in Power BI.
Browse the full Google Sheets Dashboard Templates catalogue or the wider Google Sheets Templates library for adjacent operations reports.
📖 Click here to read the Detailed Blog Post
🎥 Visit our YouTube channel for step-by-step video tutorials
👉 YouTube.com/@NextGenTemplates
Watch the step-by-step video Demo:
📅 Last updated: August 2026
Compatibility and Requirements
- Works in Google Sheets. You need a free Google account and a web browser.
- Each analysis page has its own slicers, and the Search page uses a Trip ID dropdown. Google explains how in-cell dropdowns work in Create an in-cell dropdown list.












Reviews
There are no reviews yet.